
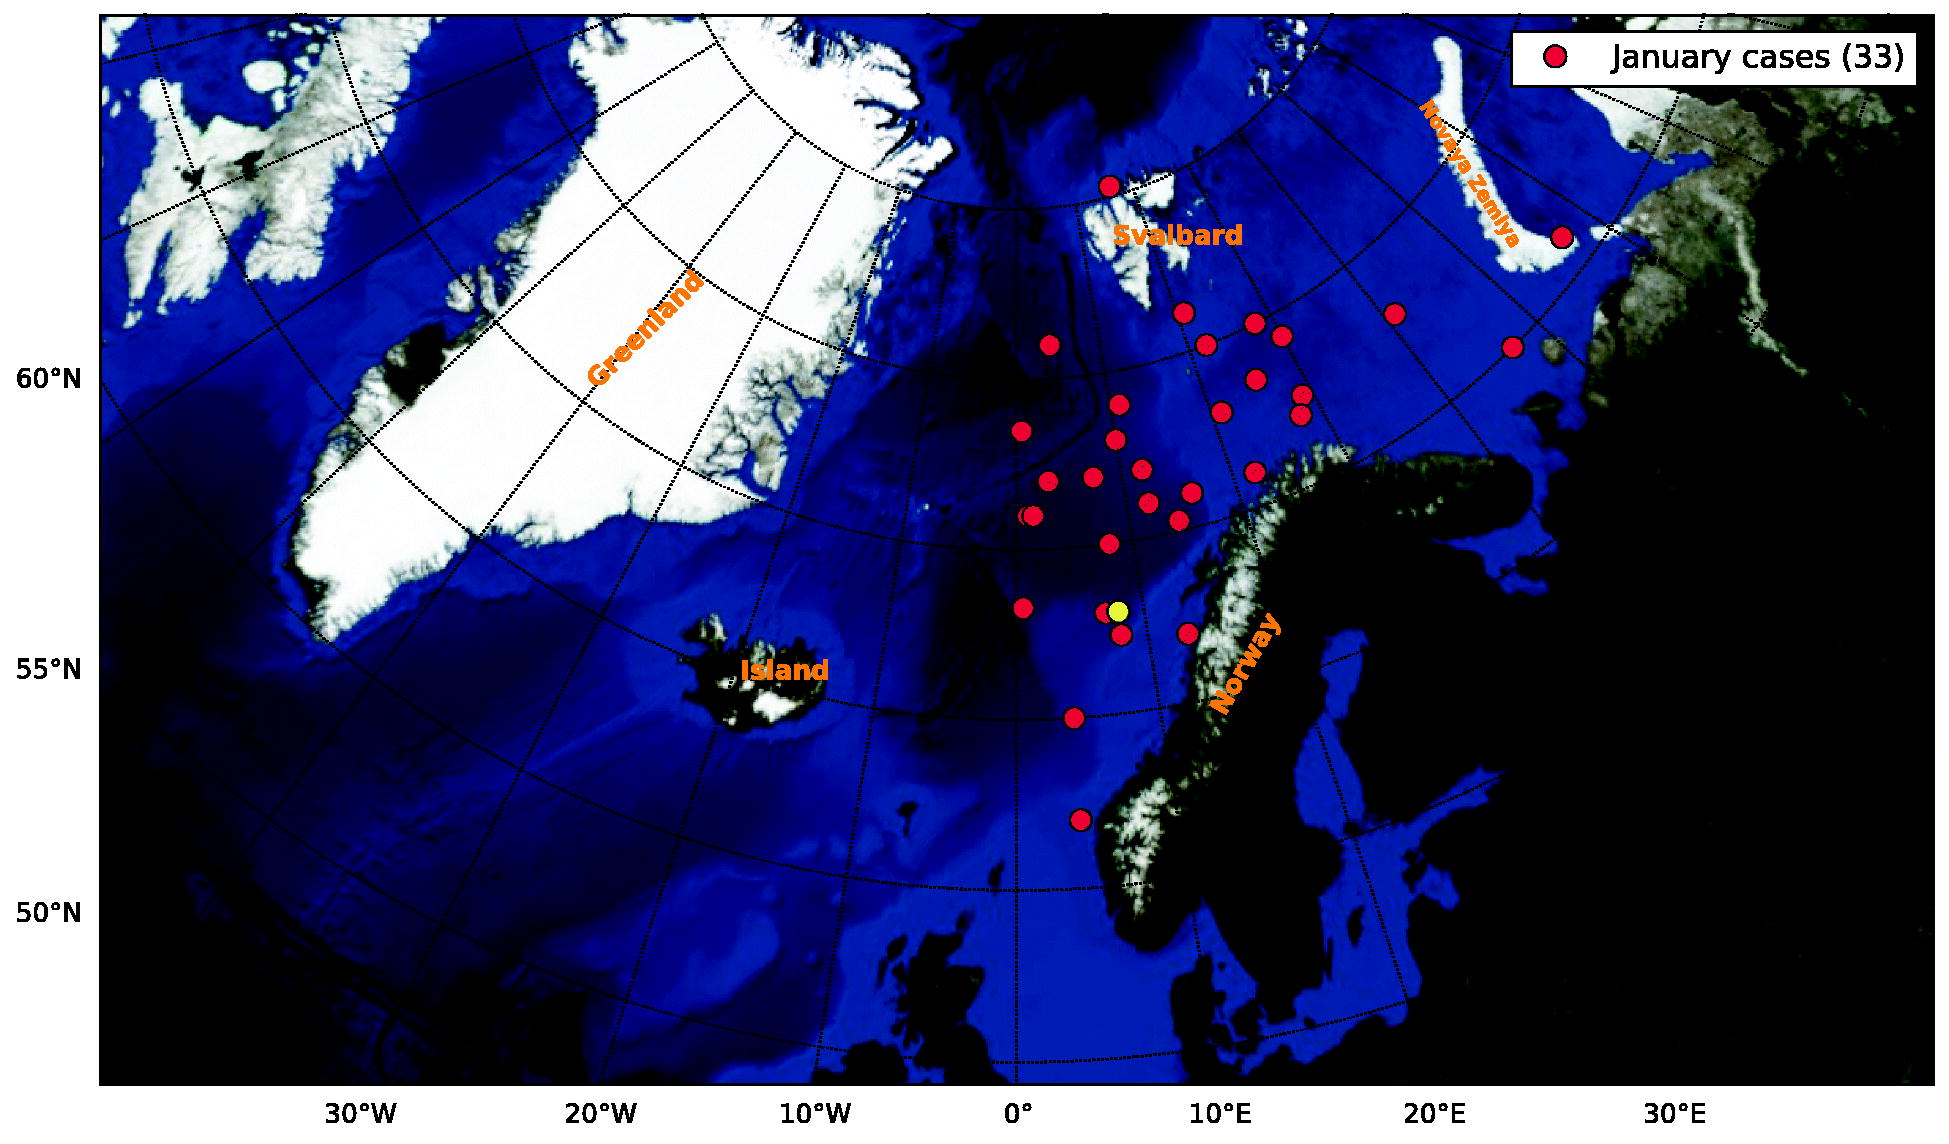
Fig. 1.
January PLs between 2000 and 2011. Each of the 33 cases is represented at the location reported in the Noer and Lien (2010) list (red dots). The case marked with yellow is the one presented in Fig. 2.
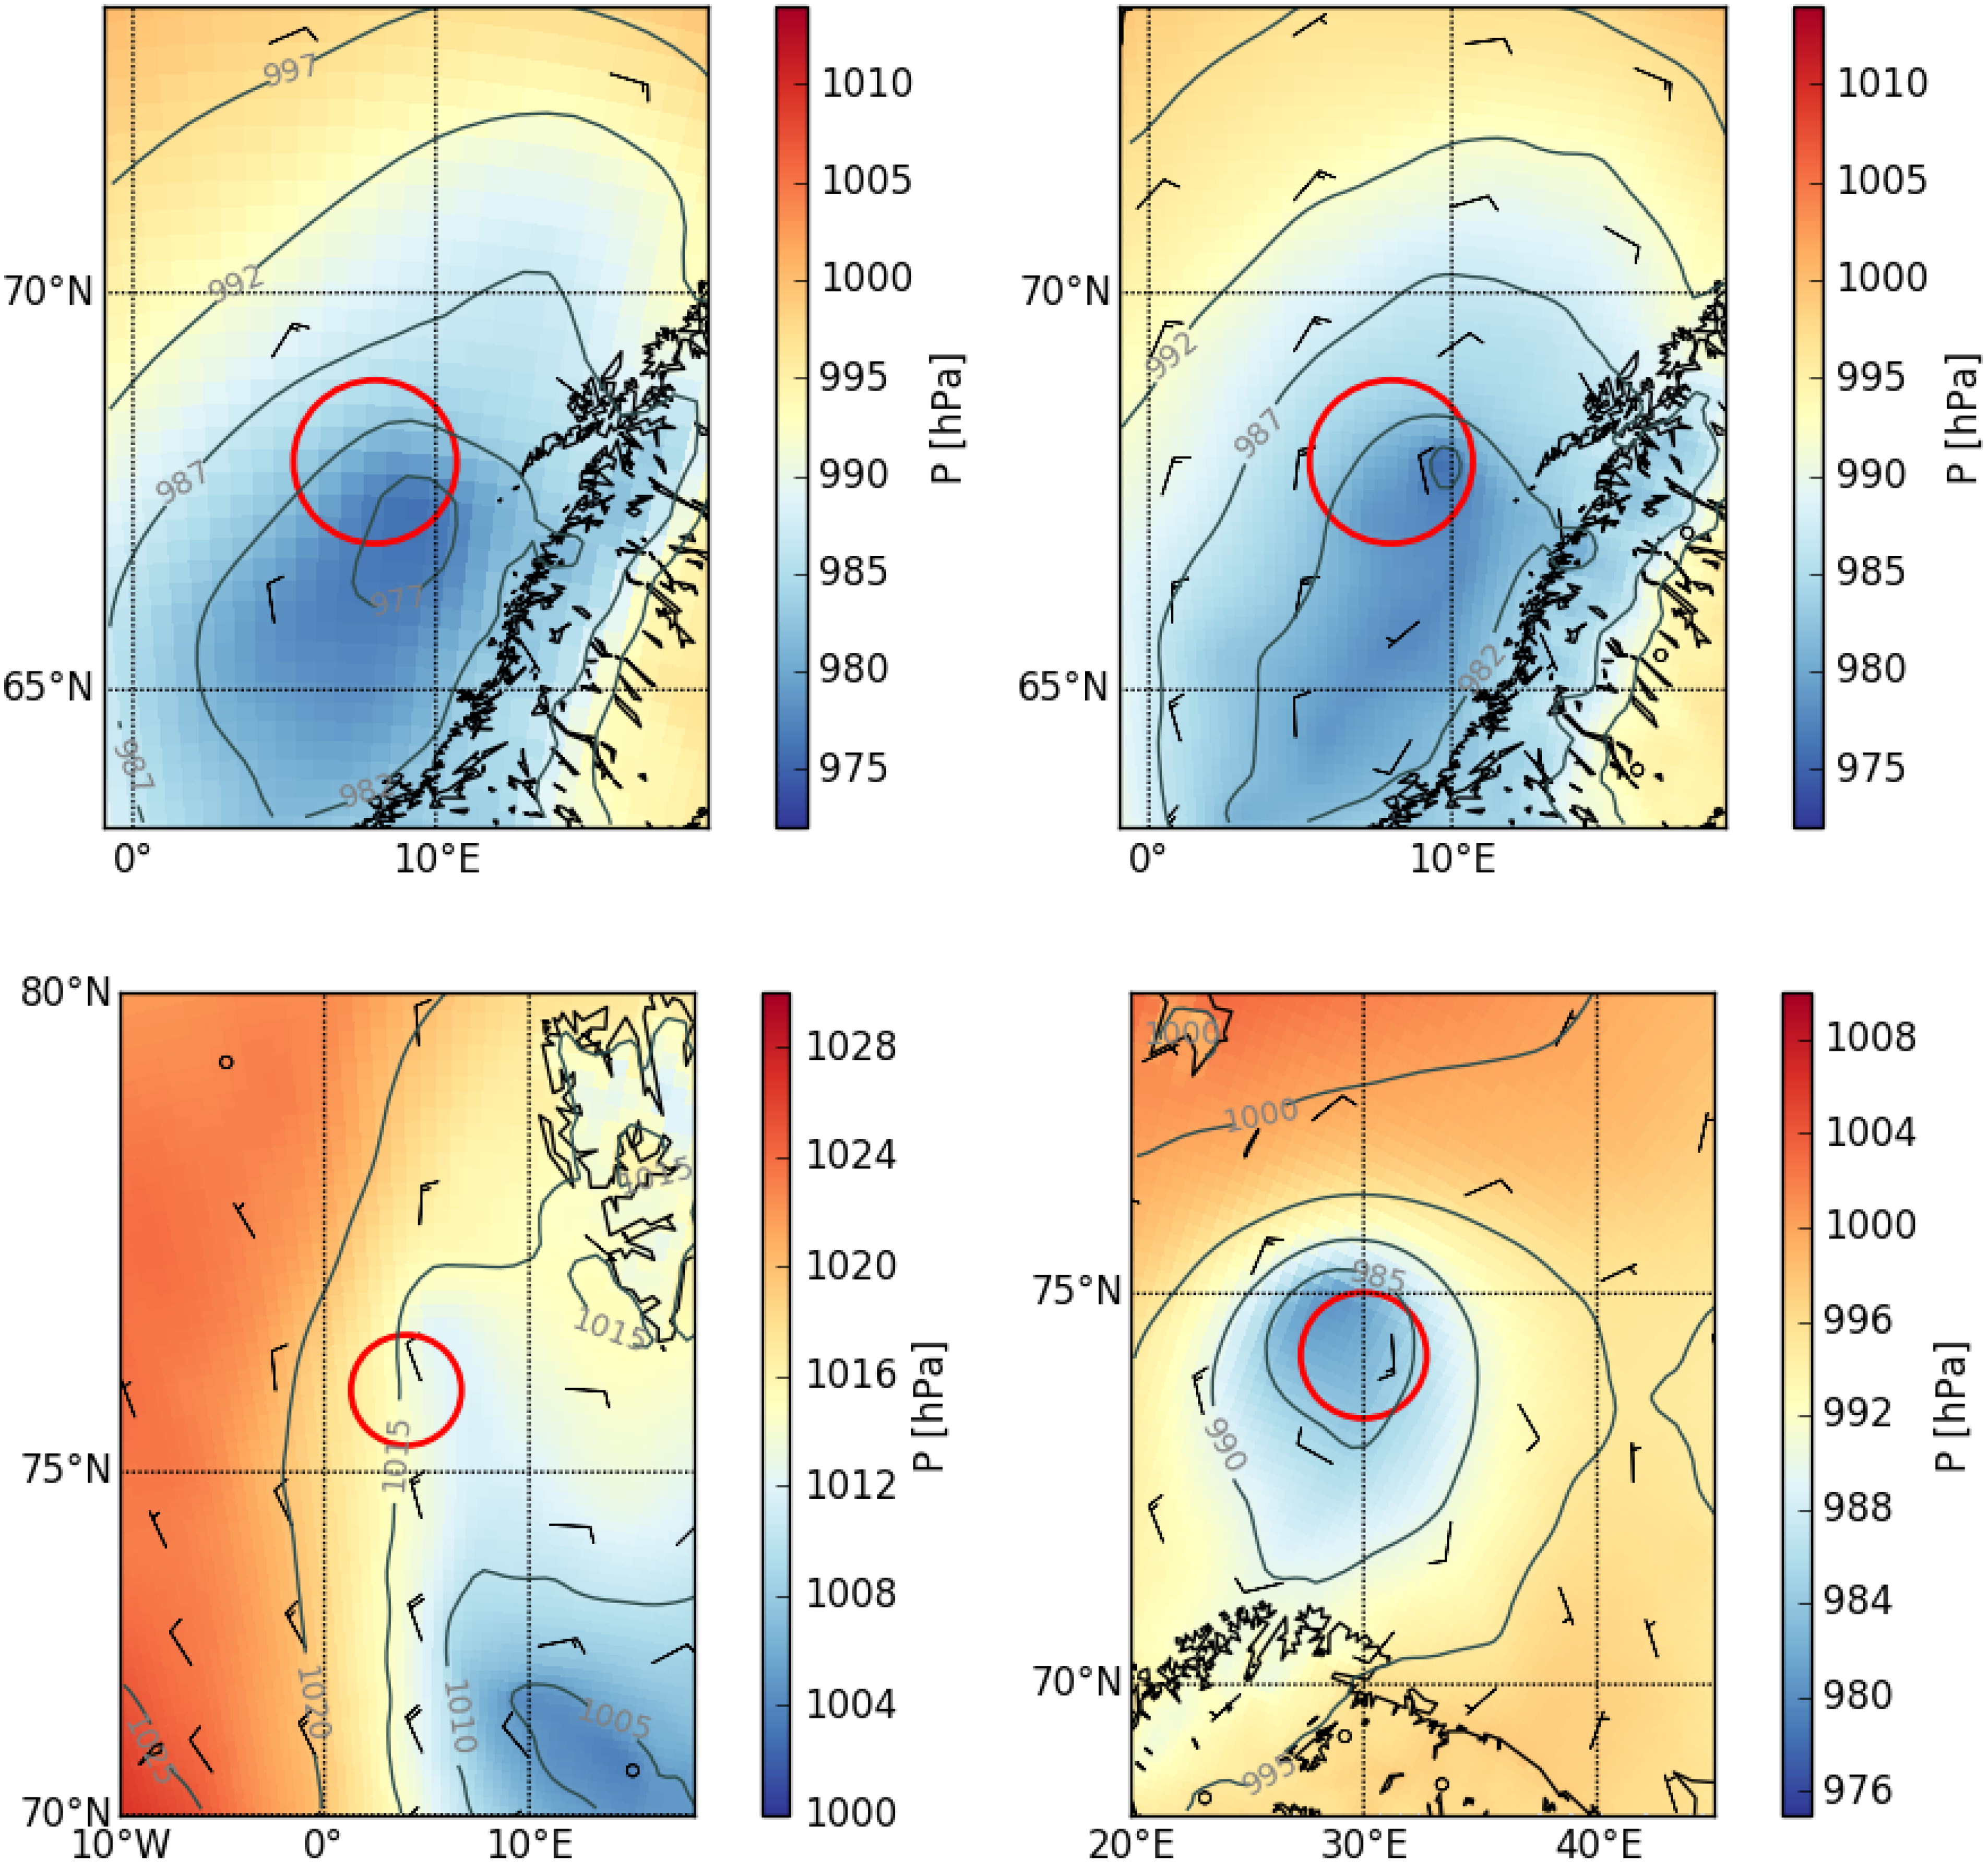
Fig. 2.
MSLP (colour shading and grey counters every 5 hPa) and wind speed and direction (wind barbs) for PL cases on 29 January 2010 from ASRv1 (upper left) and ASRv2 (upper right) and for 22 January 2007 (lower left) and 30 January 2011 (lower right). Both cases in the bottom row were plotted using the ASRv2 data. The red circle indicates a 200 km radius around the location from NL list.
Table 1.
PL conditions (denoted by C1,C2,…C6; see Section 2.4) and their values taken from various studies (second and third column, respectively). The last two columns give the 75 percentile means of C1, C2, C3, C4(i), C4(ii), maximum of C5 and mean of C6 for all the 33 cases during the genesis stage found using the ASR versions 1 and 2.
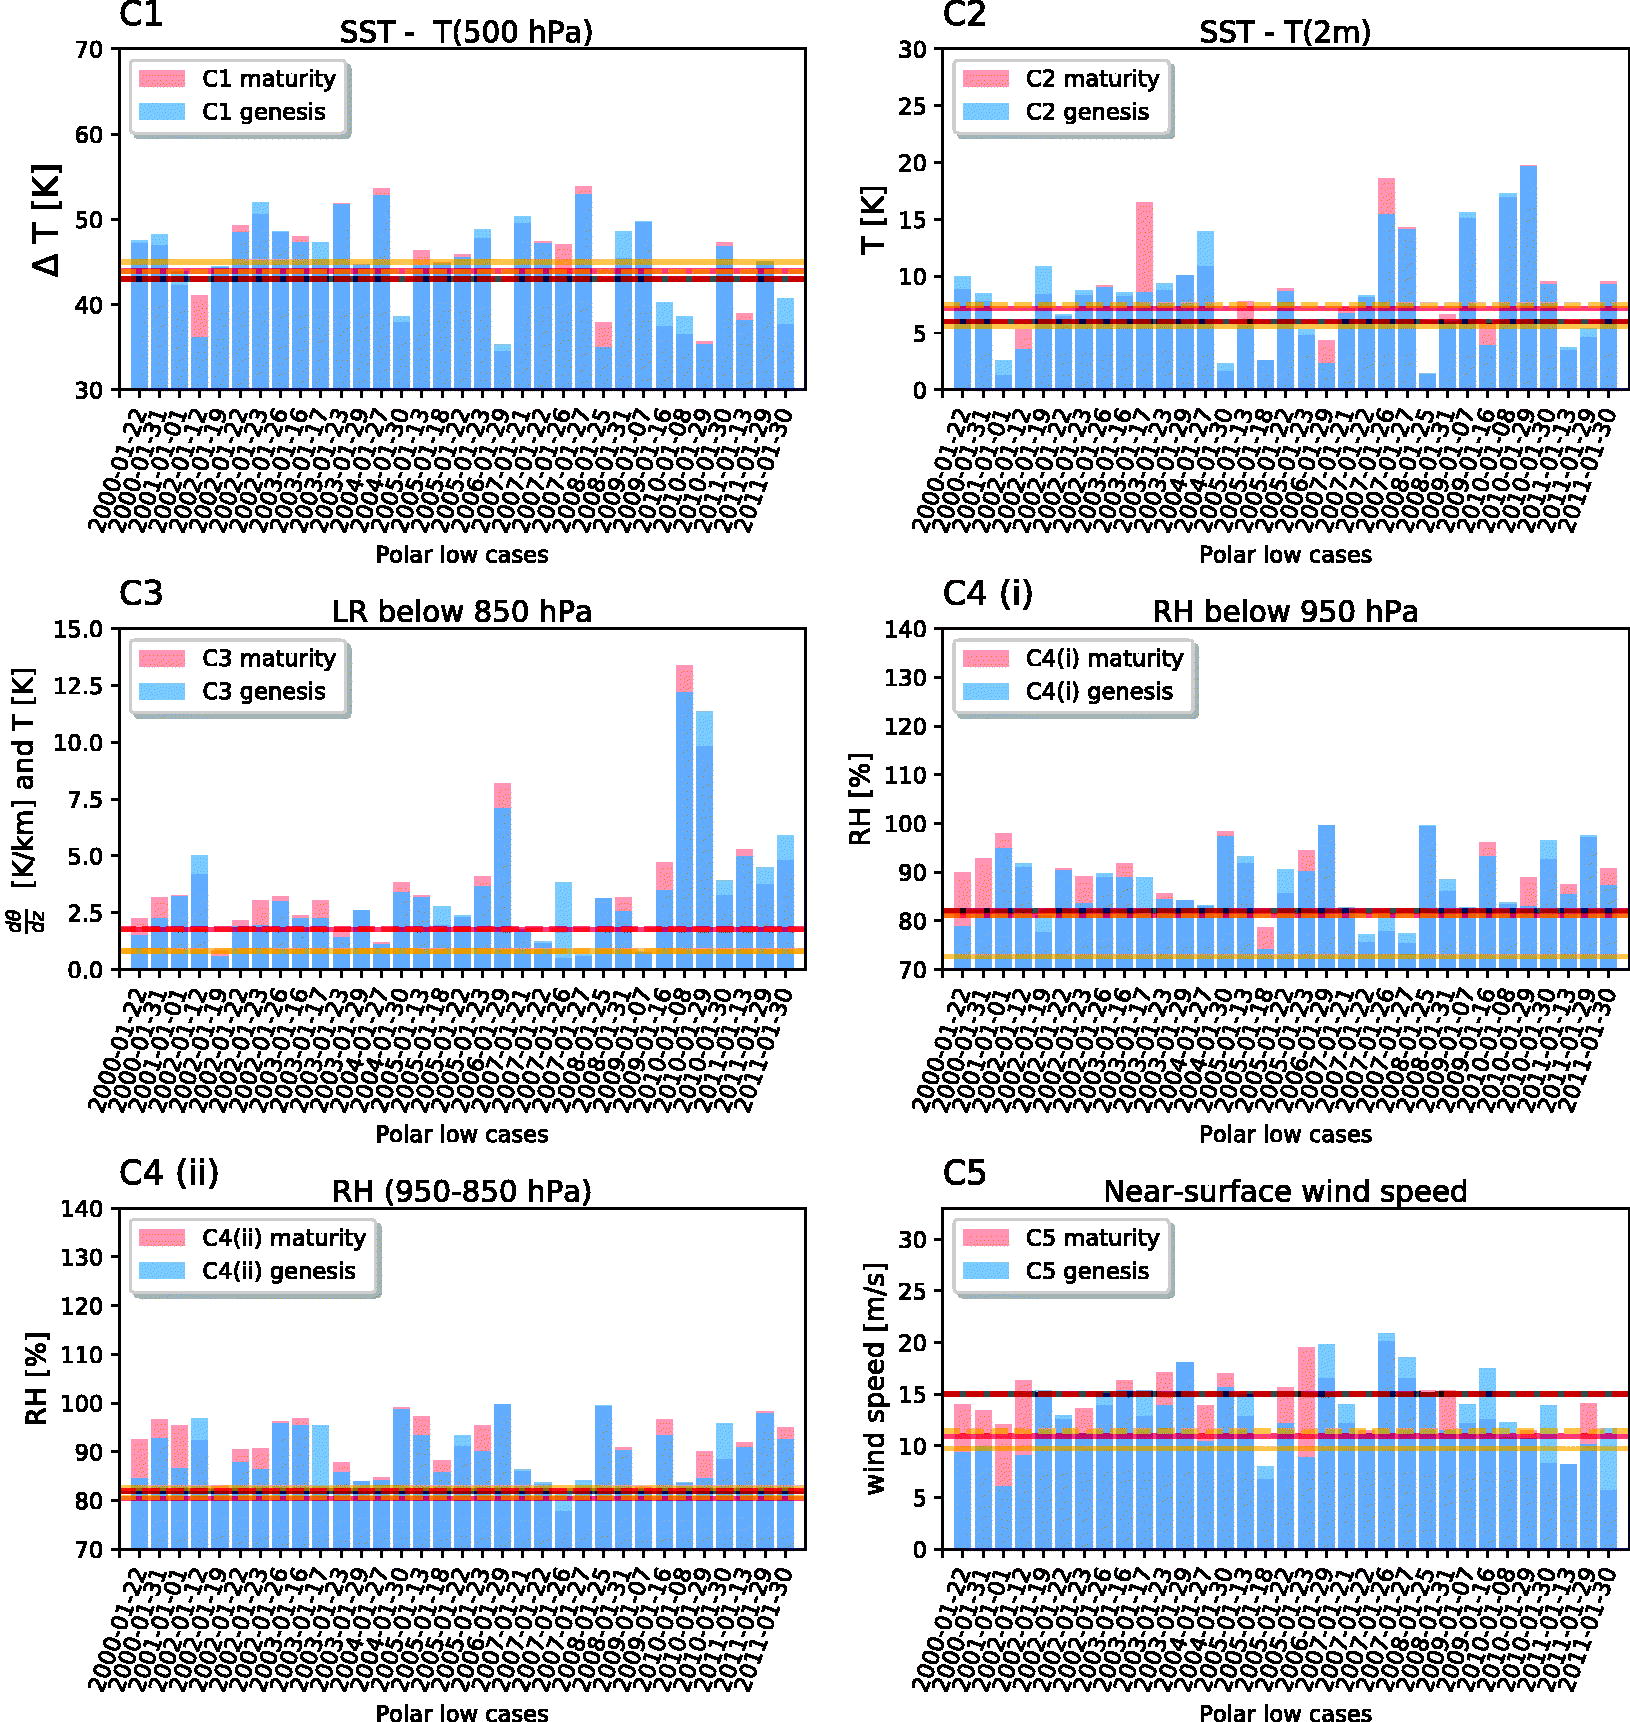
Fig. 3.
Bars represent the values for the different conditions based on ASRv2 grid points within a 200 km radius around the genesis (blue) and maturity (orange) point for each of the January cases between 2000 and 2011. C1 (upper left), C2 (upper right), C3 (middle left), C4(i) (middle right), C4(ii) (bottom left) and C5 (bottom right). Horizontal lines represent: the literature threshold from Table 1 (black), ASRv2 mean (red) and ASRv1 mean (yellow) for genesis (maturity) stage denoted with full (dashed) line.
Table 2.
Overview of conditions for each PL case at genesis stage with their dates and location. Values in the table are means for a 200 km radius around the genesis point.
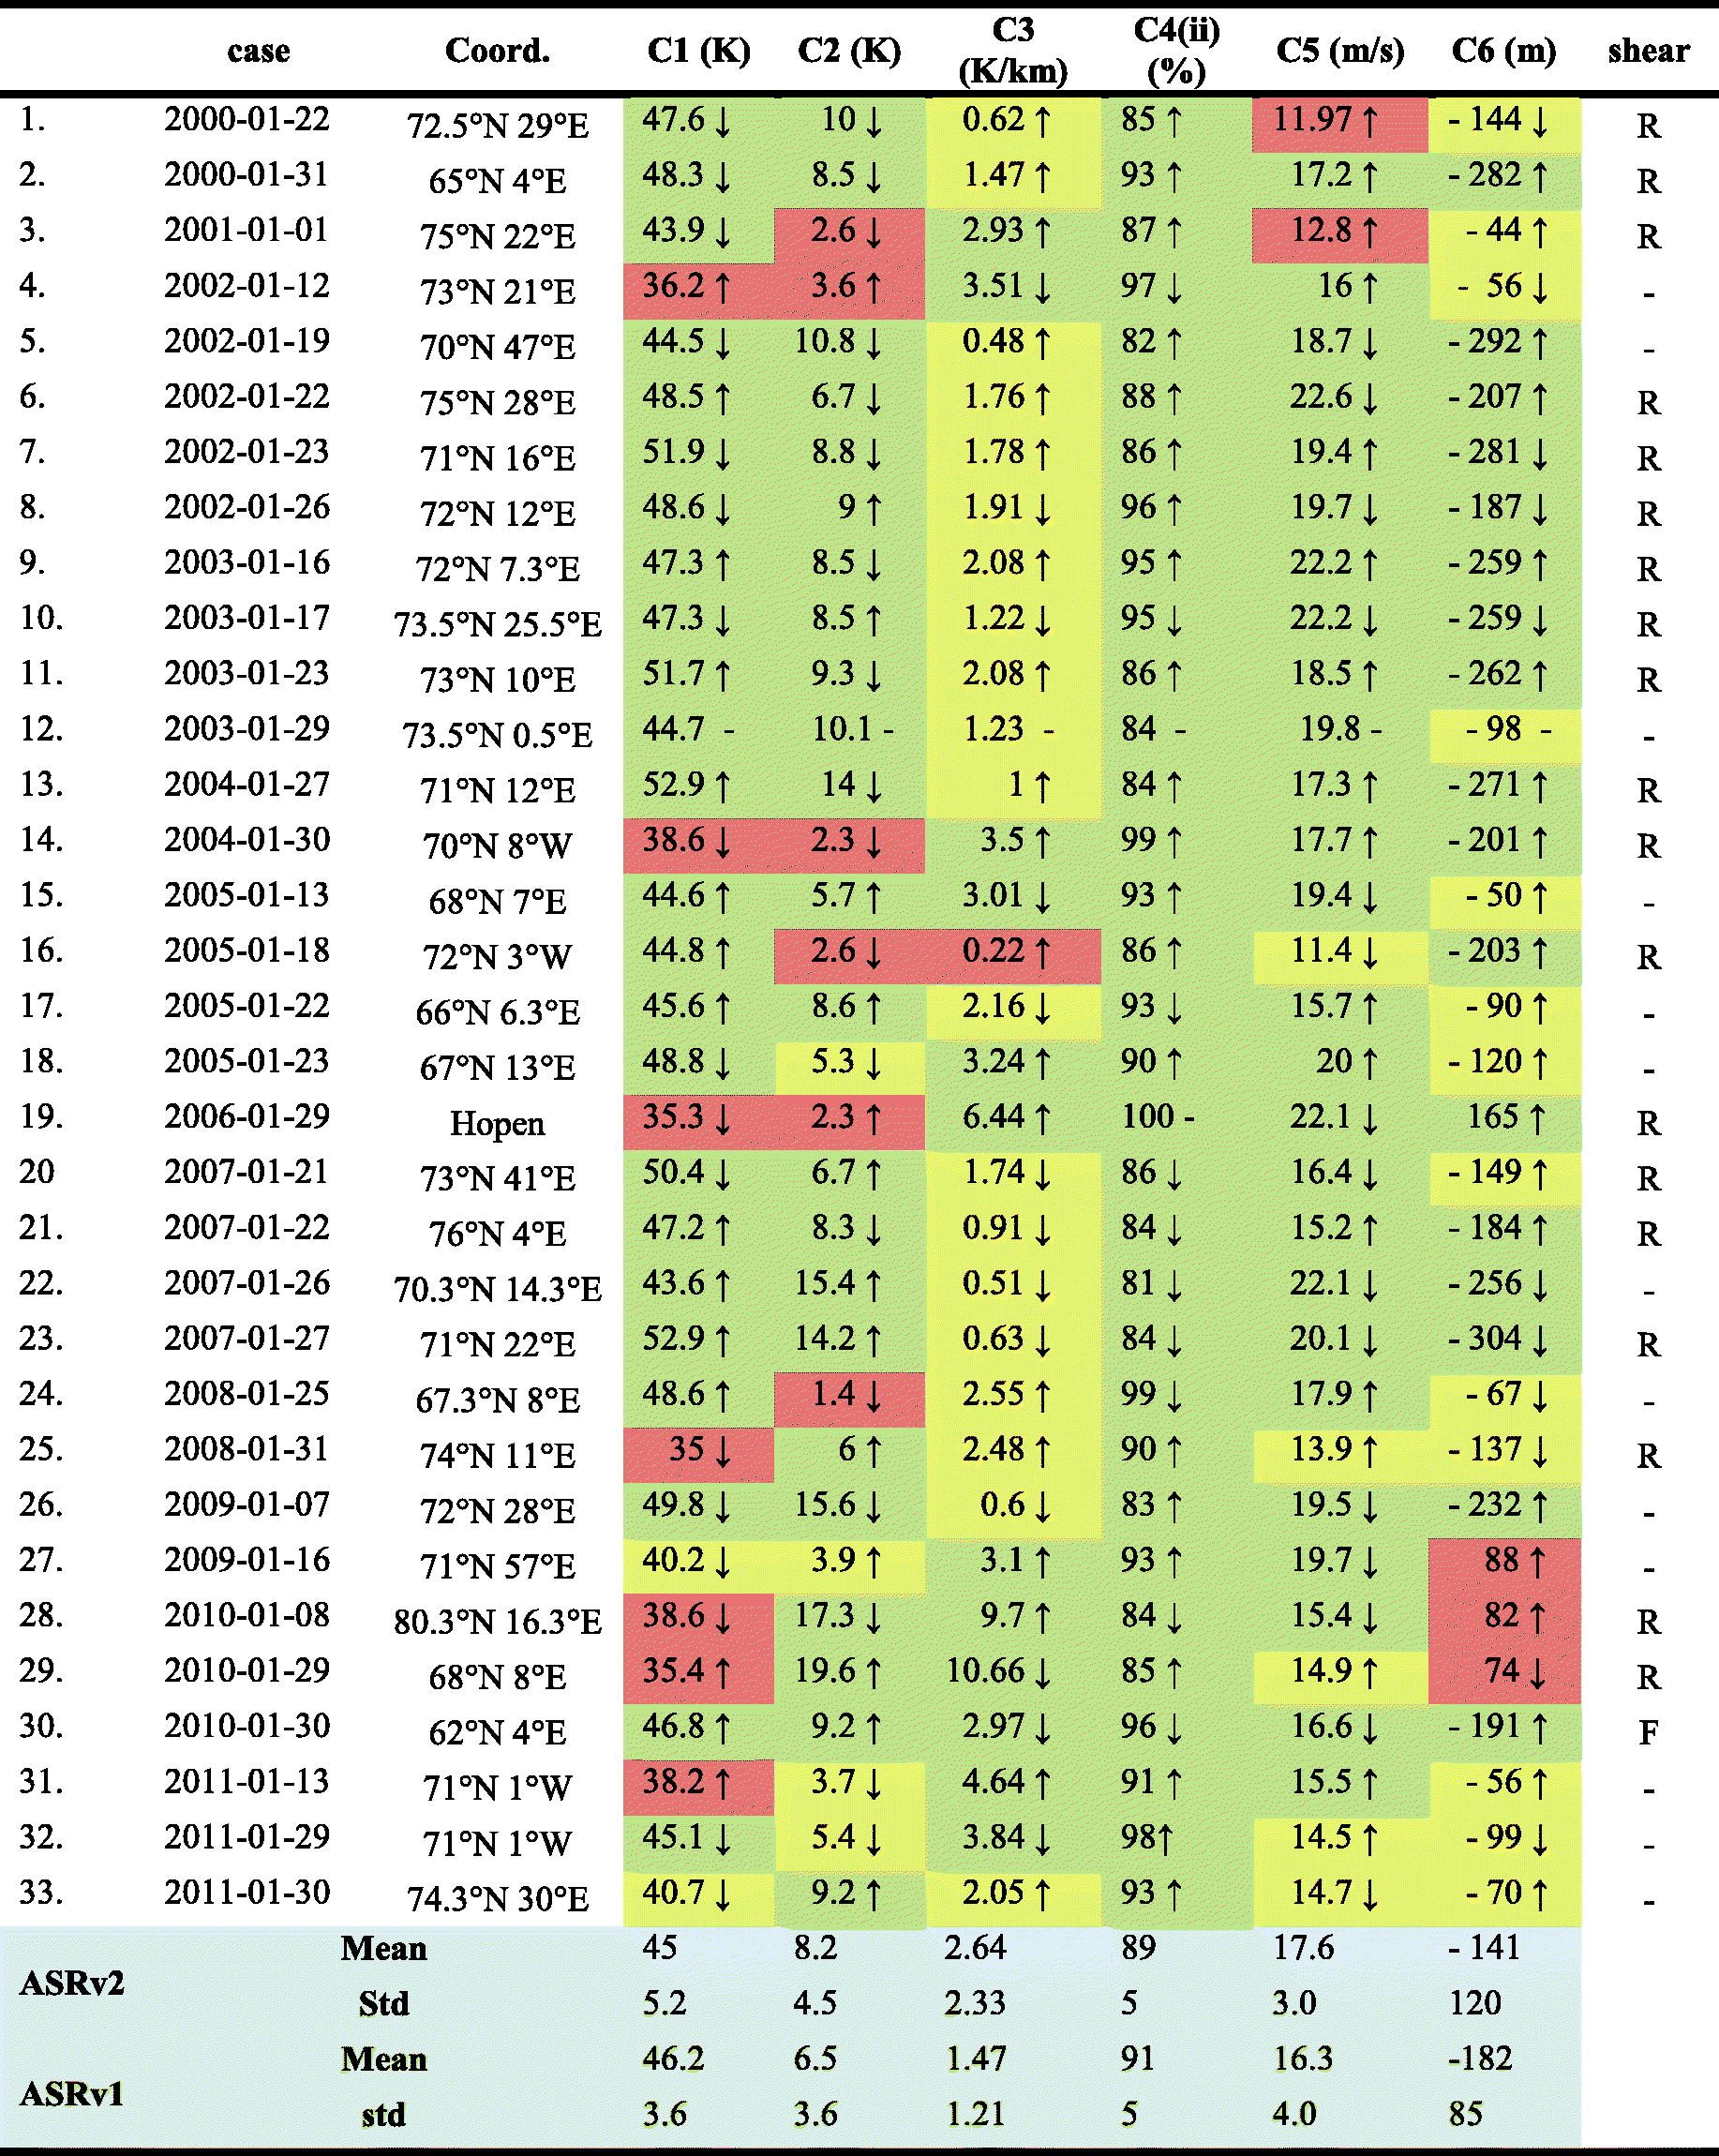
[i] Thresholds are marked in colours and, for the conditions C1–C5, have the following meaning: red – condition has not been fulfilled, yellow – condition is neutral (between one STD and the mean (or the threshold)) and green – condition is fulfilled. For C6, the colours indicate the following: red – conditions is above zero, yellow - condition is between zero and -160 gpm and green - condition is fulfilled. For the thresholds, refer to Table 1. The last two rows give the mean and STD of the condition of the respective column. The arrow next to each value represents an increase (decrease) at the maturity stage.
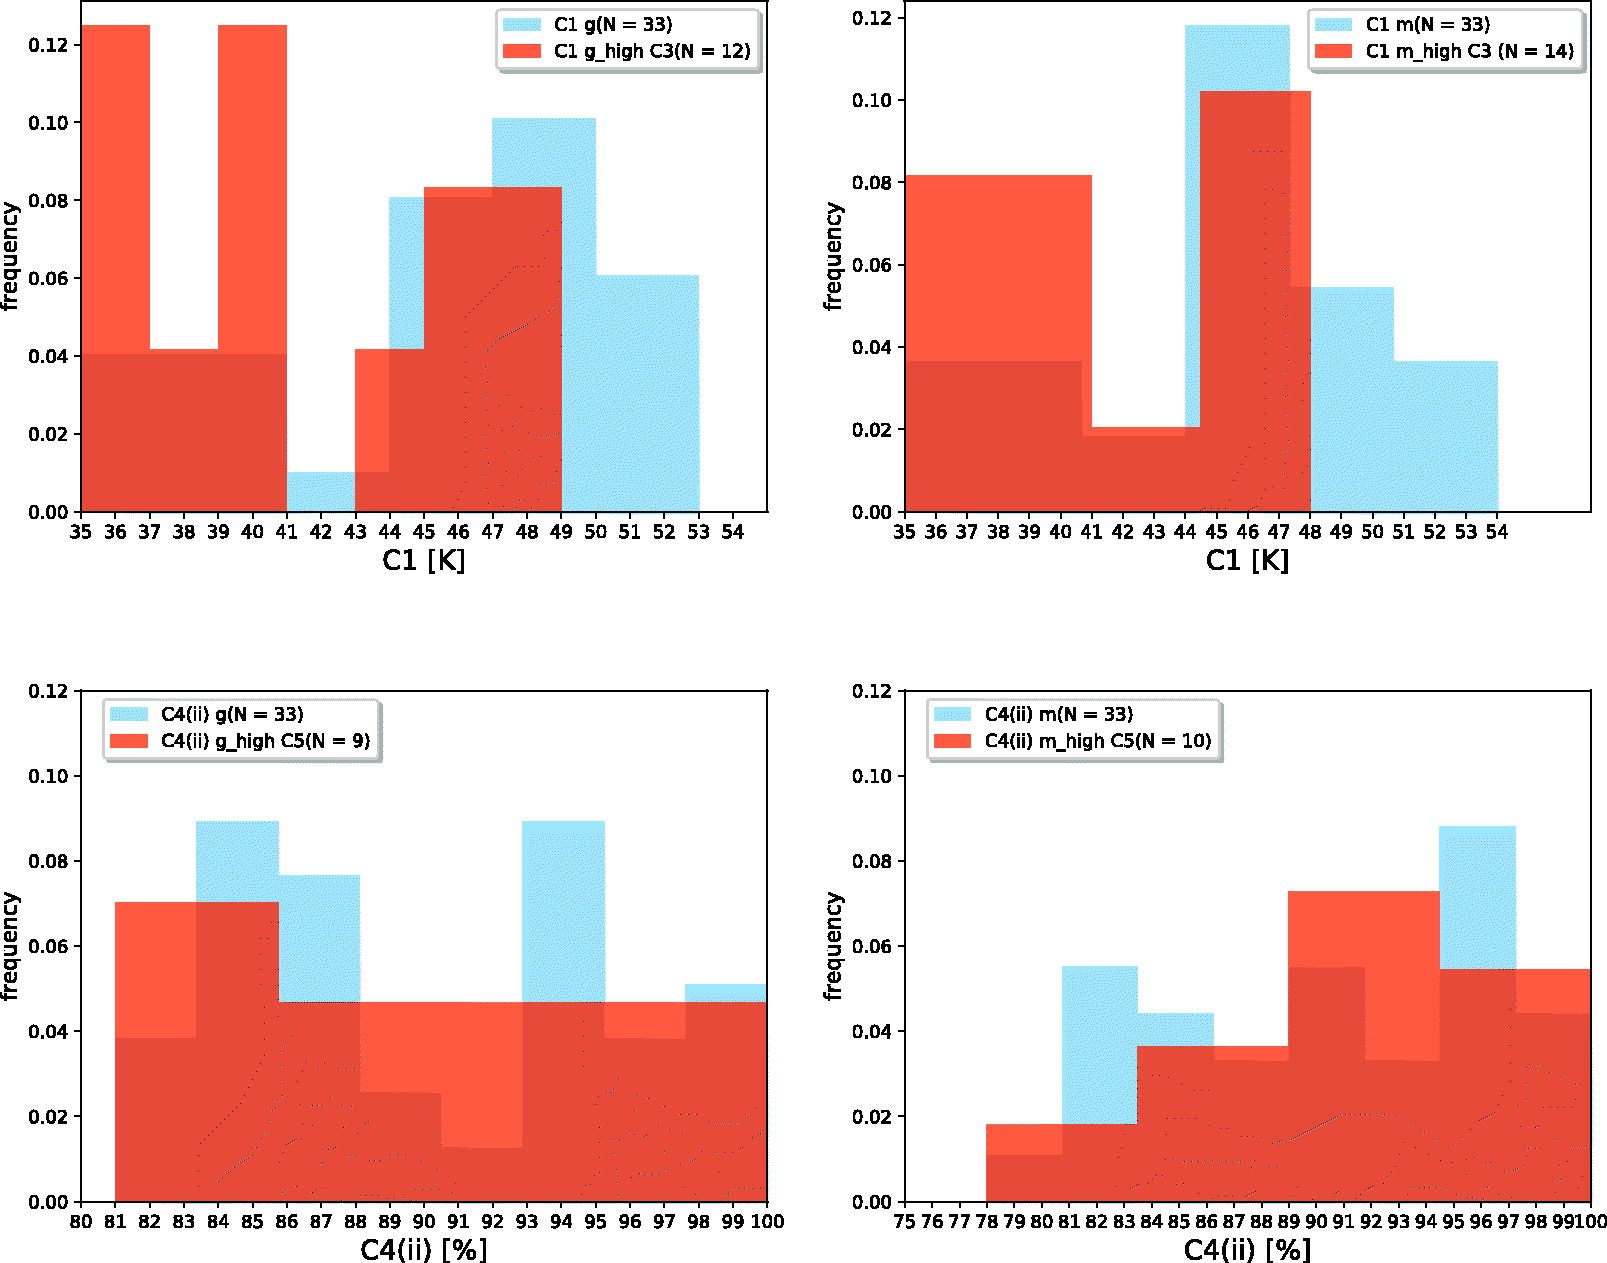
Fig. 4.
Frequency of occurrence of condition C1 for all 33 cases (blue) and for cases with C3 above mean 75 percentile value of ASRv2 (orange) at genesis (g) (upper left) and maturity (m) (upper right) stages. Similar is shown for conditions C4(ii) with high C5 (above threshold) (bottom).
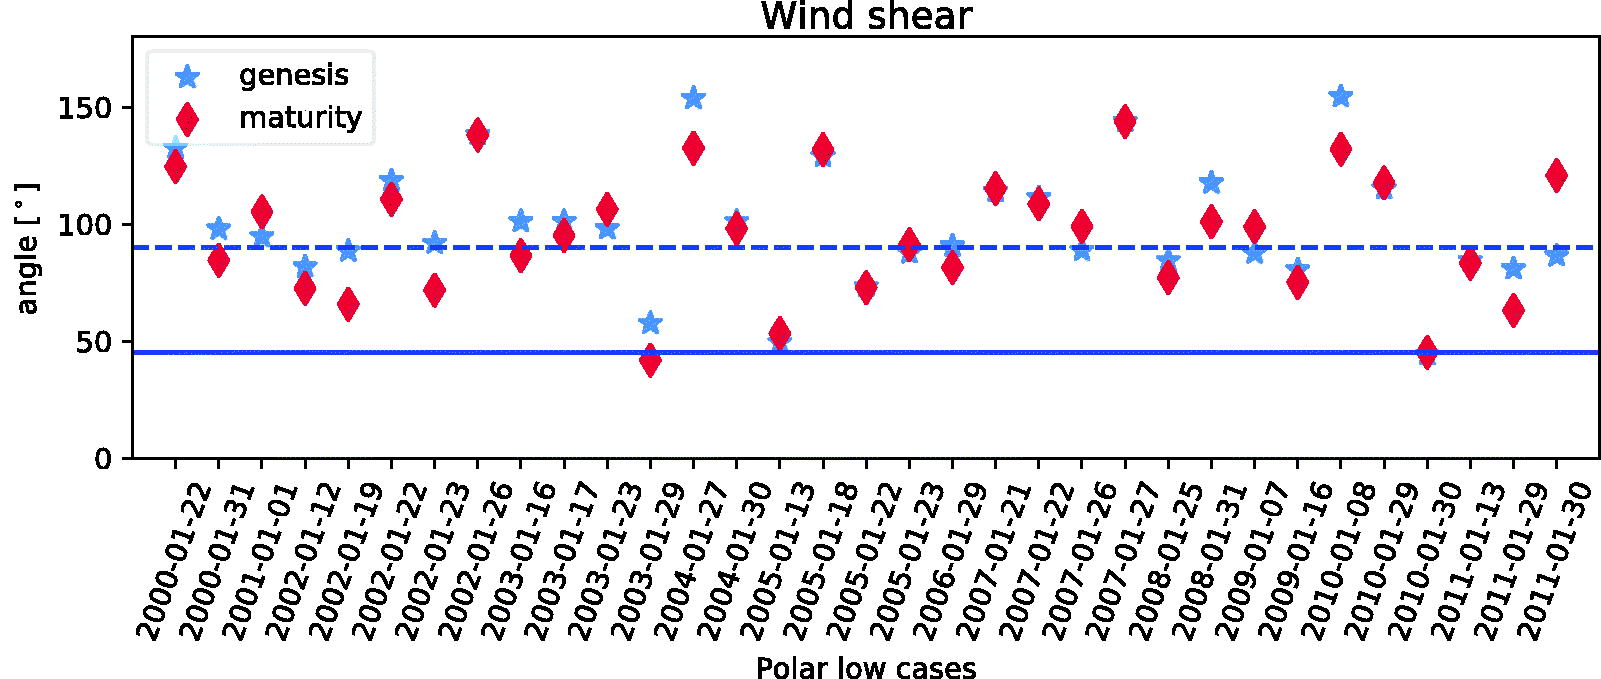
Fig. 5.
Wind shear at genesis (blue stars) and maturity (red diamonds) stages. Blue lines separate forward (below blue thick line; 45) and reverse (above blue dashed line; 90) shear.
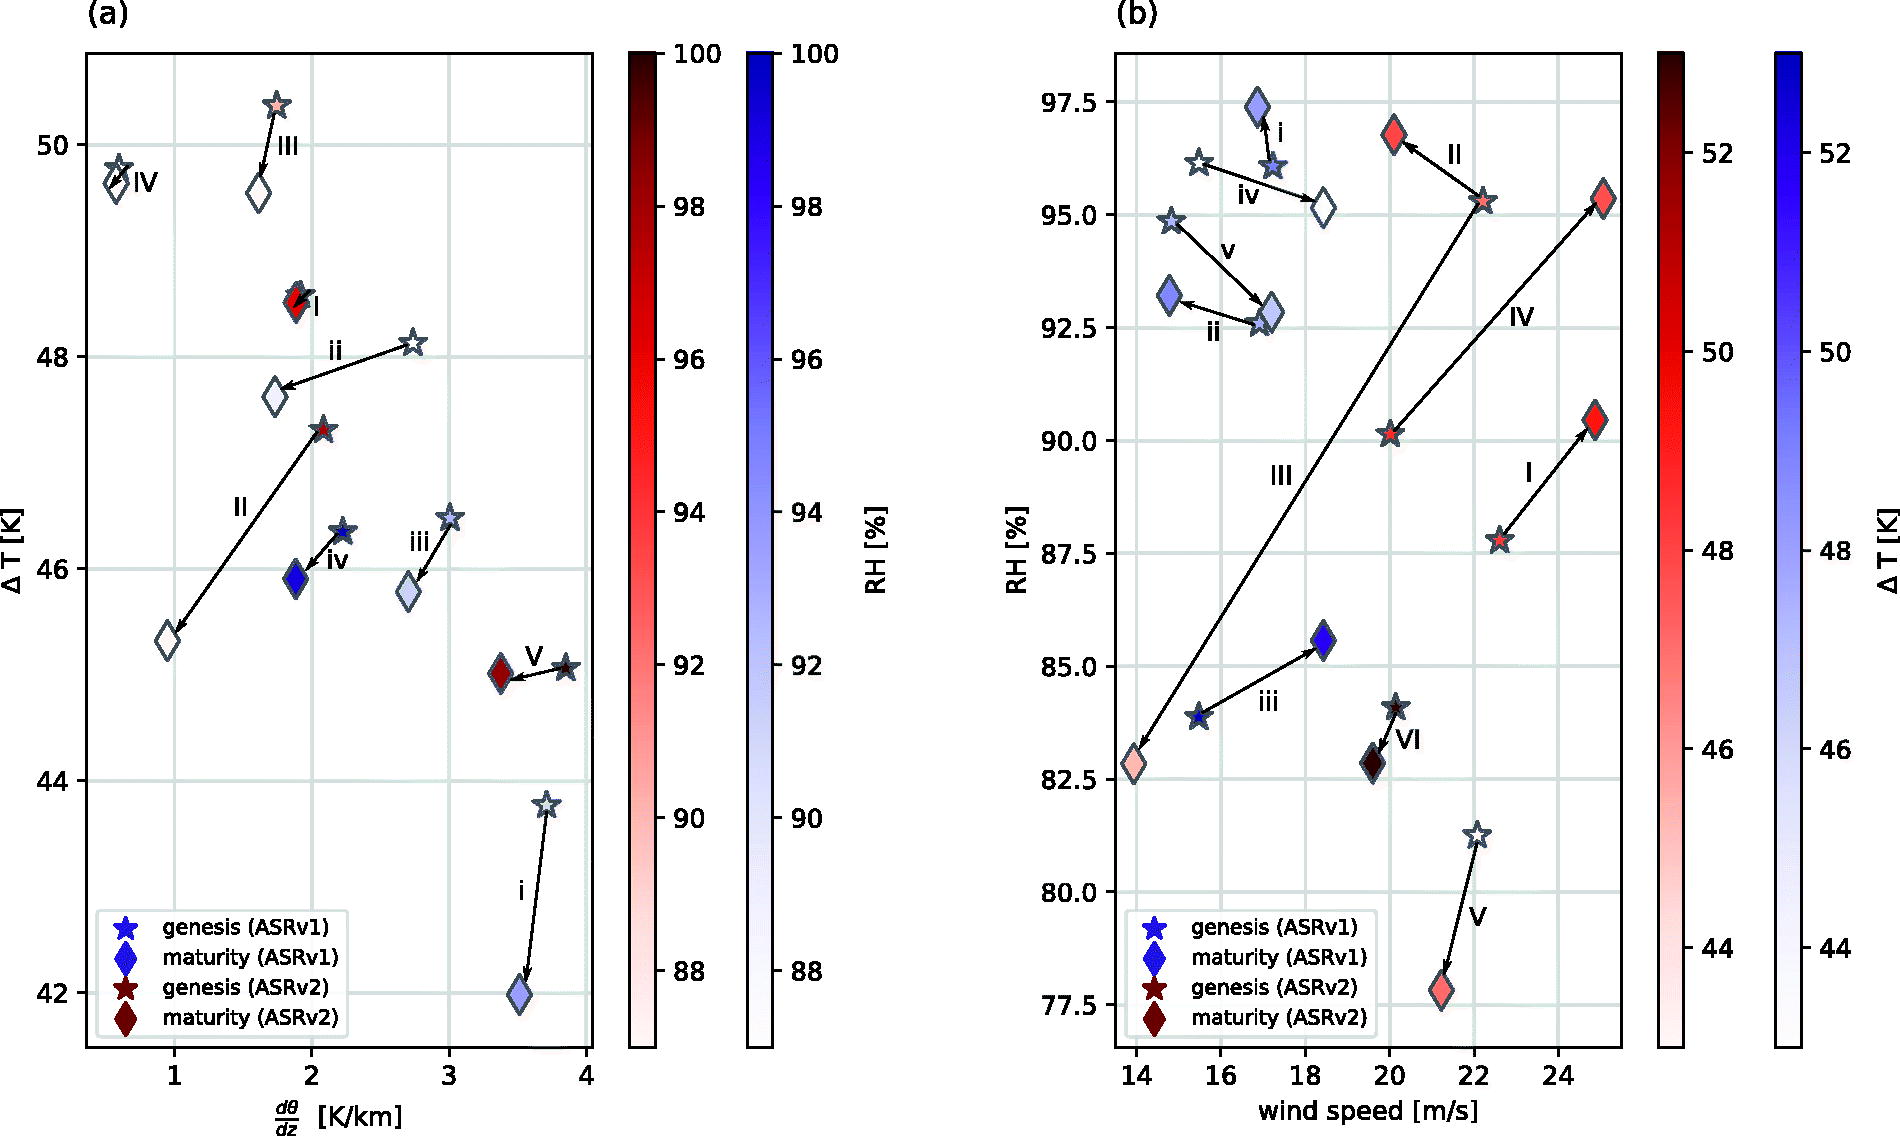
Fig. 6.
(a) Mean 75 percentile values of C3: (x-axis), C1: (y-axis) and C4(ii): RH(850–950 hPa) (colour shading) for 4 cases of the ASRv1 (1 January 2001, 23 January 2005, 25 January 2008 and 29 January 2010) (purple) at genesis (stars) and maturity (diamonds) stages and 5 cases of the ASRv2 (26 January 2002, 17 January 2003, 21 January 2007, 7 January 2009 and 29 January 2011) (red). Lower (upper) case roman numbers above arrows indicate the same case at different stages from ASRv1 (ASRv2). (b) C5: near-surface wind speed (x-axis), C4(ii): RH(850–950 hPa) (y-axis) and C1: (color shading) for cases with strong C5 in ASRv1 (26 January 2002, 22 January 2005, 31 January 2008, 7 January 2009 and 30 January 2010) (purple) and ASRv2 (22 January 2002, 16 January 2003, 17 January 2003, 23 January 2005, 26 January 2007 and 27 January 2007) (red).
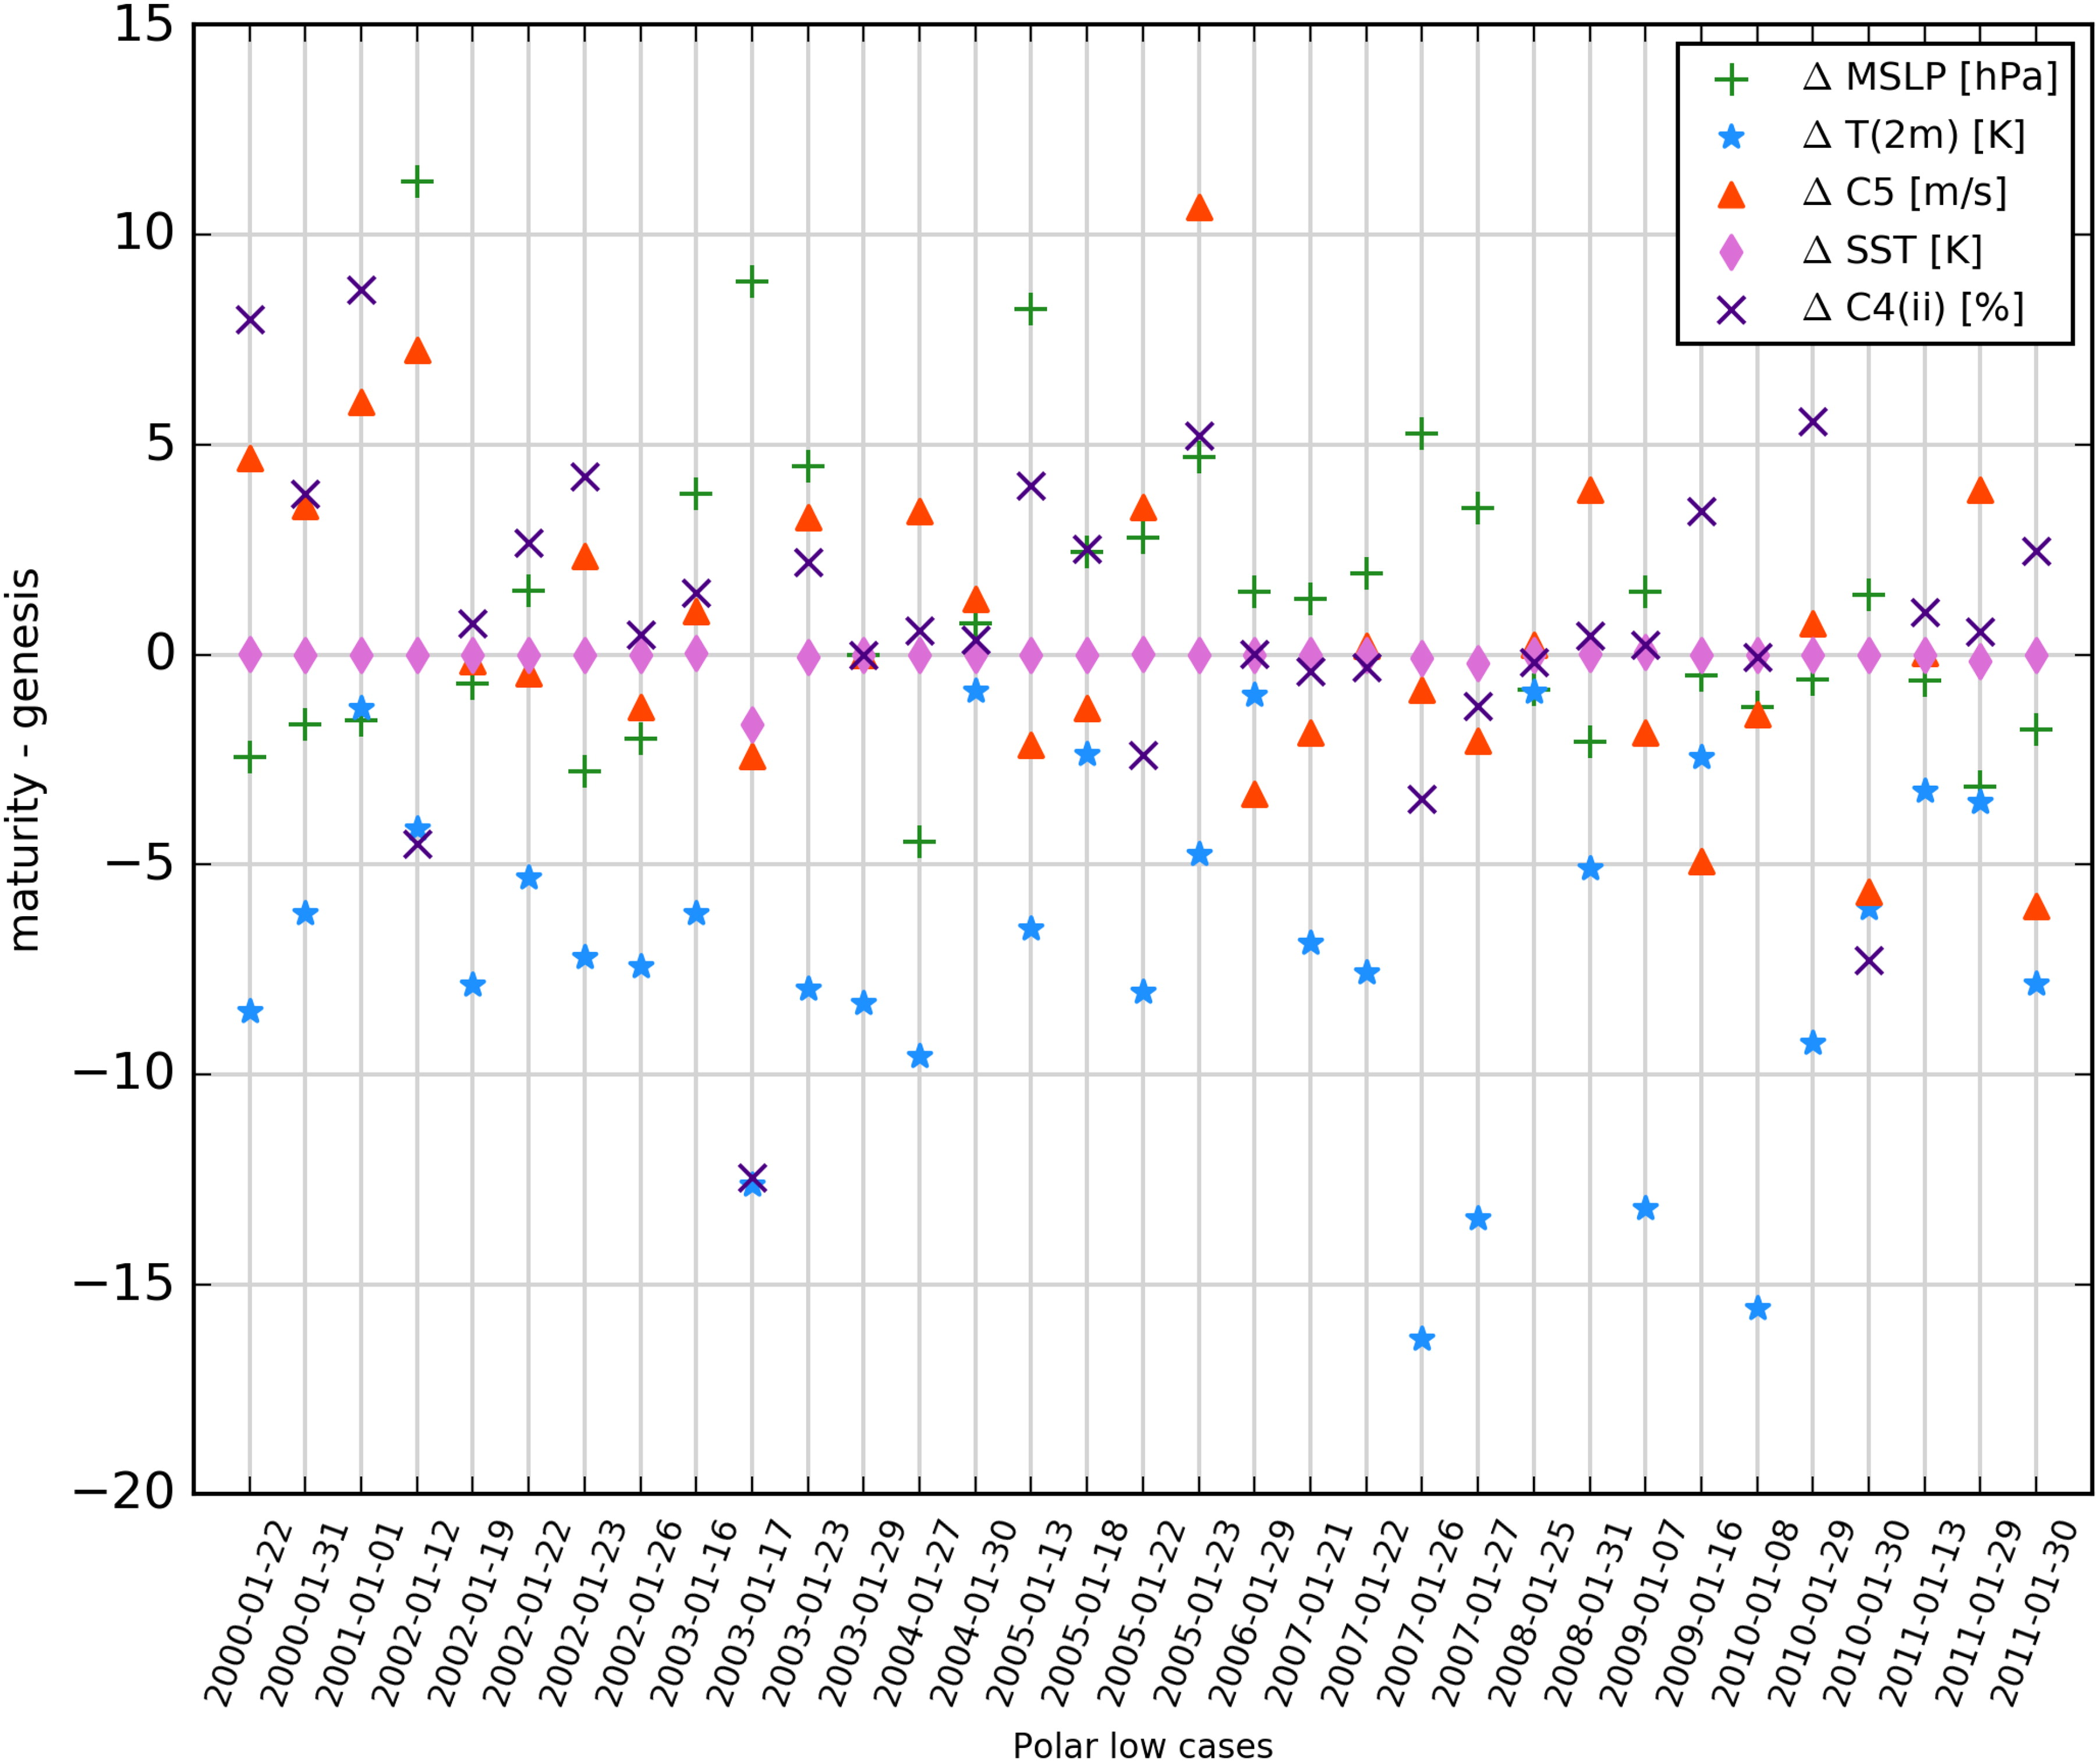
Fig. 7.
Difference of environmental conditions between the genesis and the maturity stage. Shown are: MSLP difference (green pluses), temperature at 2 m (blue stars), near-surface wind speed (C5), SST, and RH in the layer between 850 and 950 hPa, C4(ii) (indigo crosses).
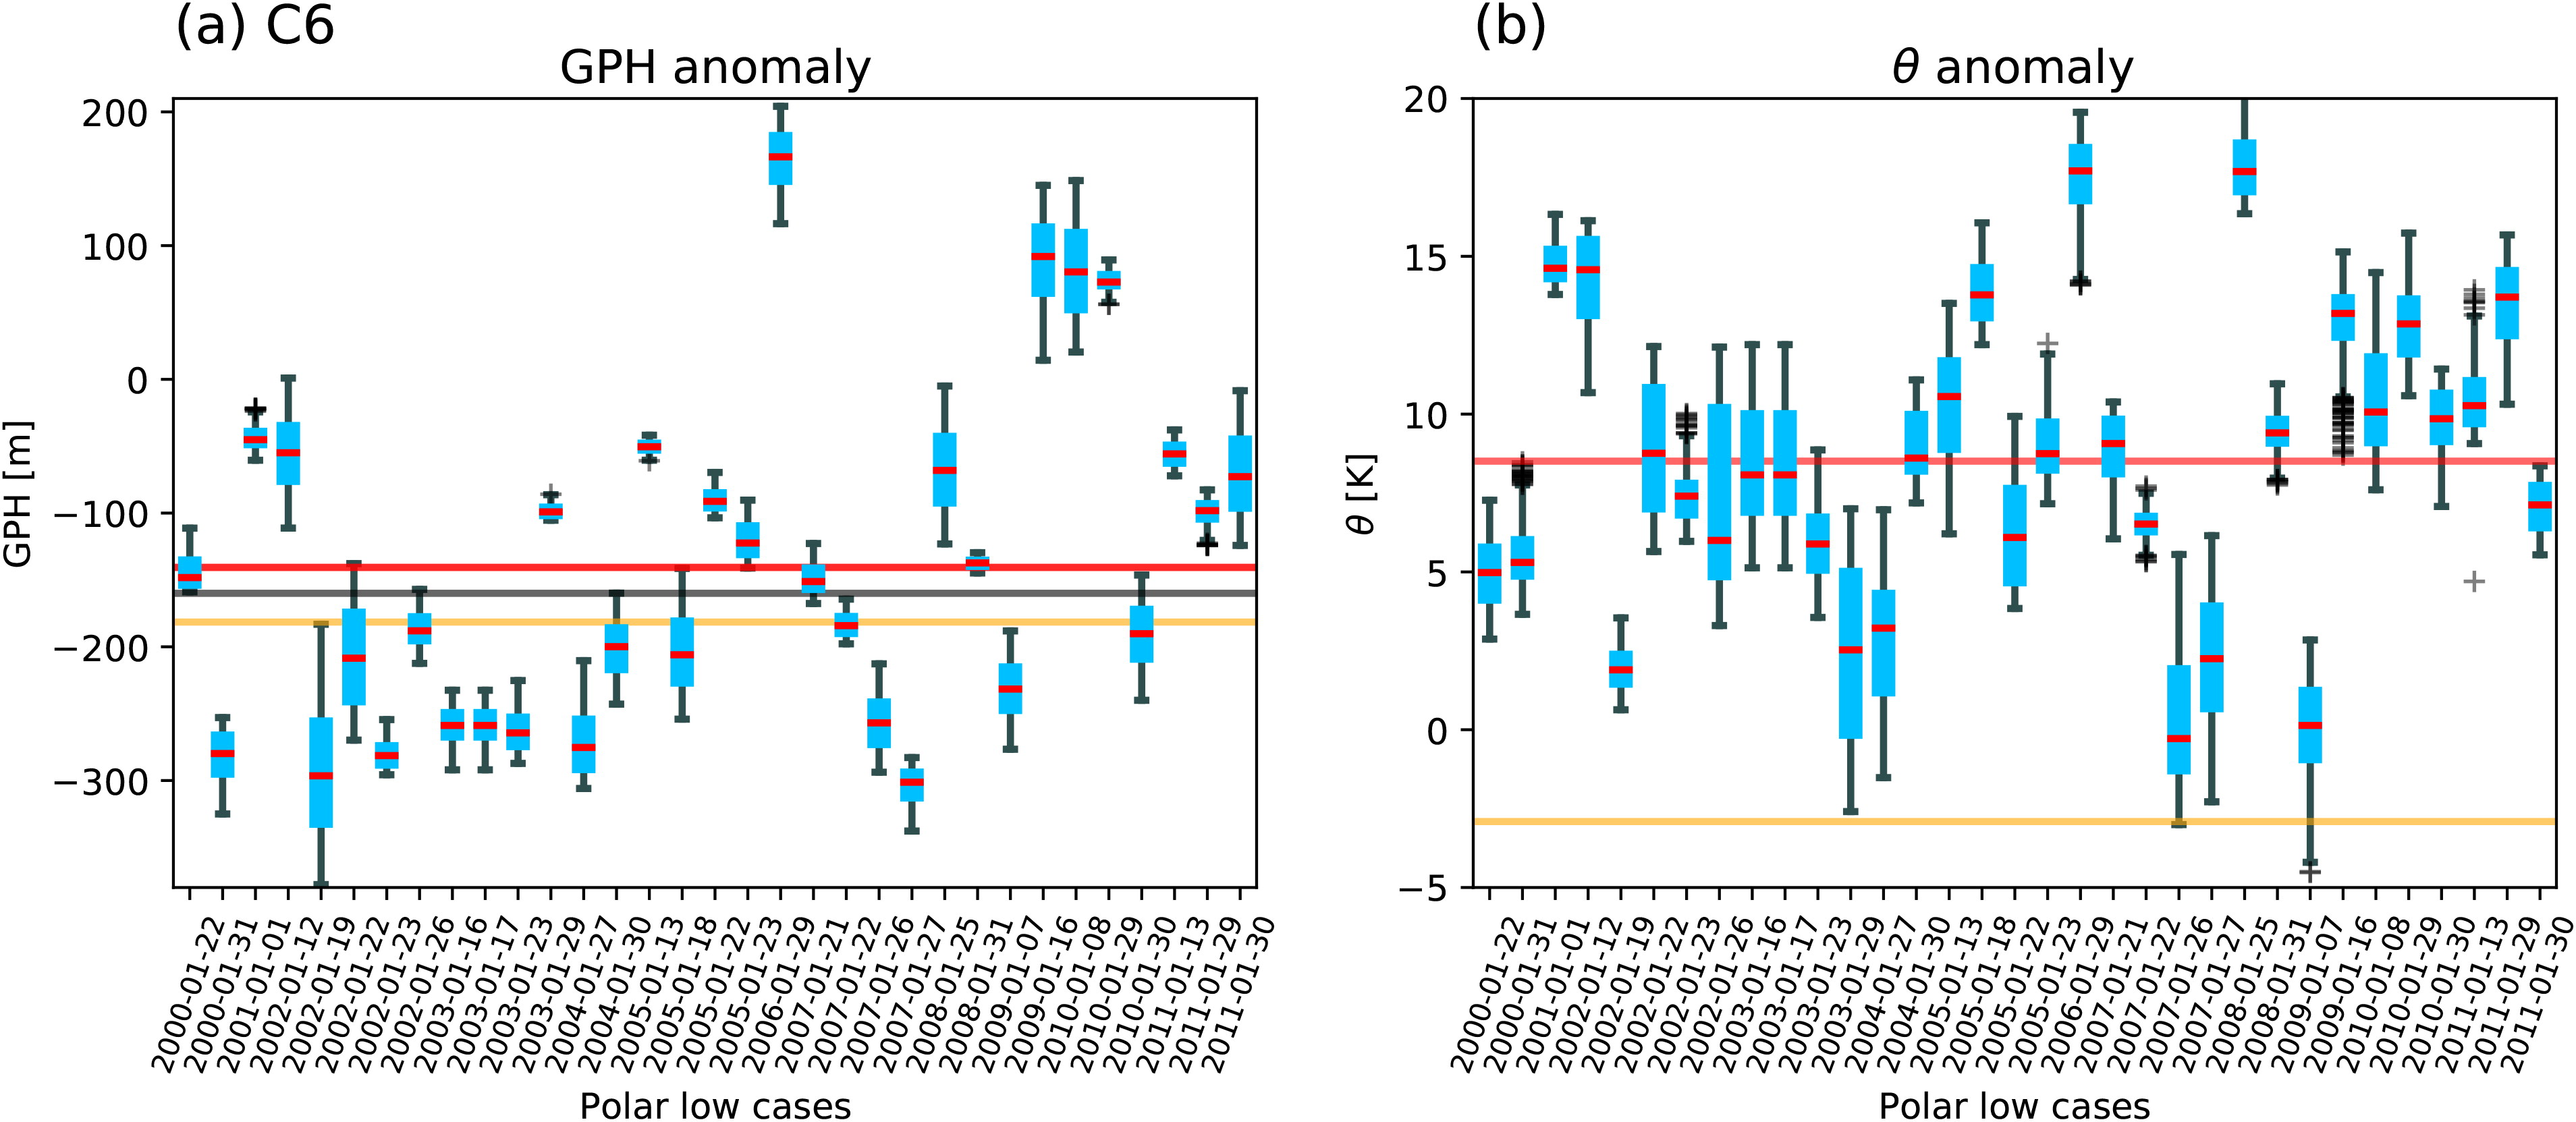
Fig. 8.
Box plots for ASRv2 grid points within a 200 km radius around the genesis point for each of the January cases between 2000 and 2011. Anomaly of the GPH at the 500 hPa level (a) and potential temperature at the 850 hPa level (b). Lines correspond to those in Fig. 3. Blue boxes indicate interquartile range (IQR) and black whiskers the 1.5IQR. Individual outliers are presented as the black crosses.
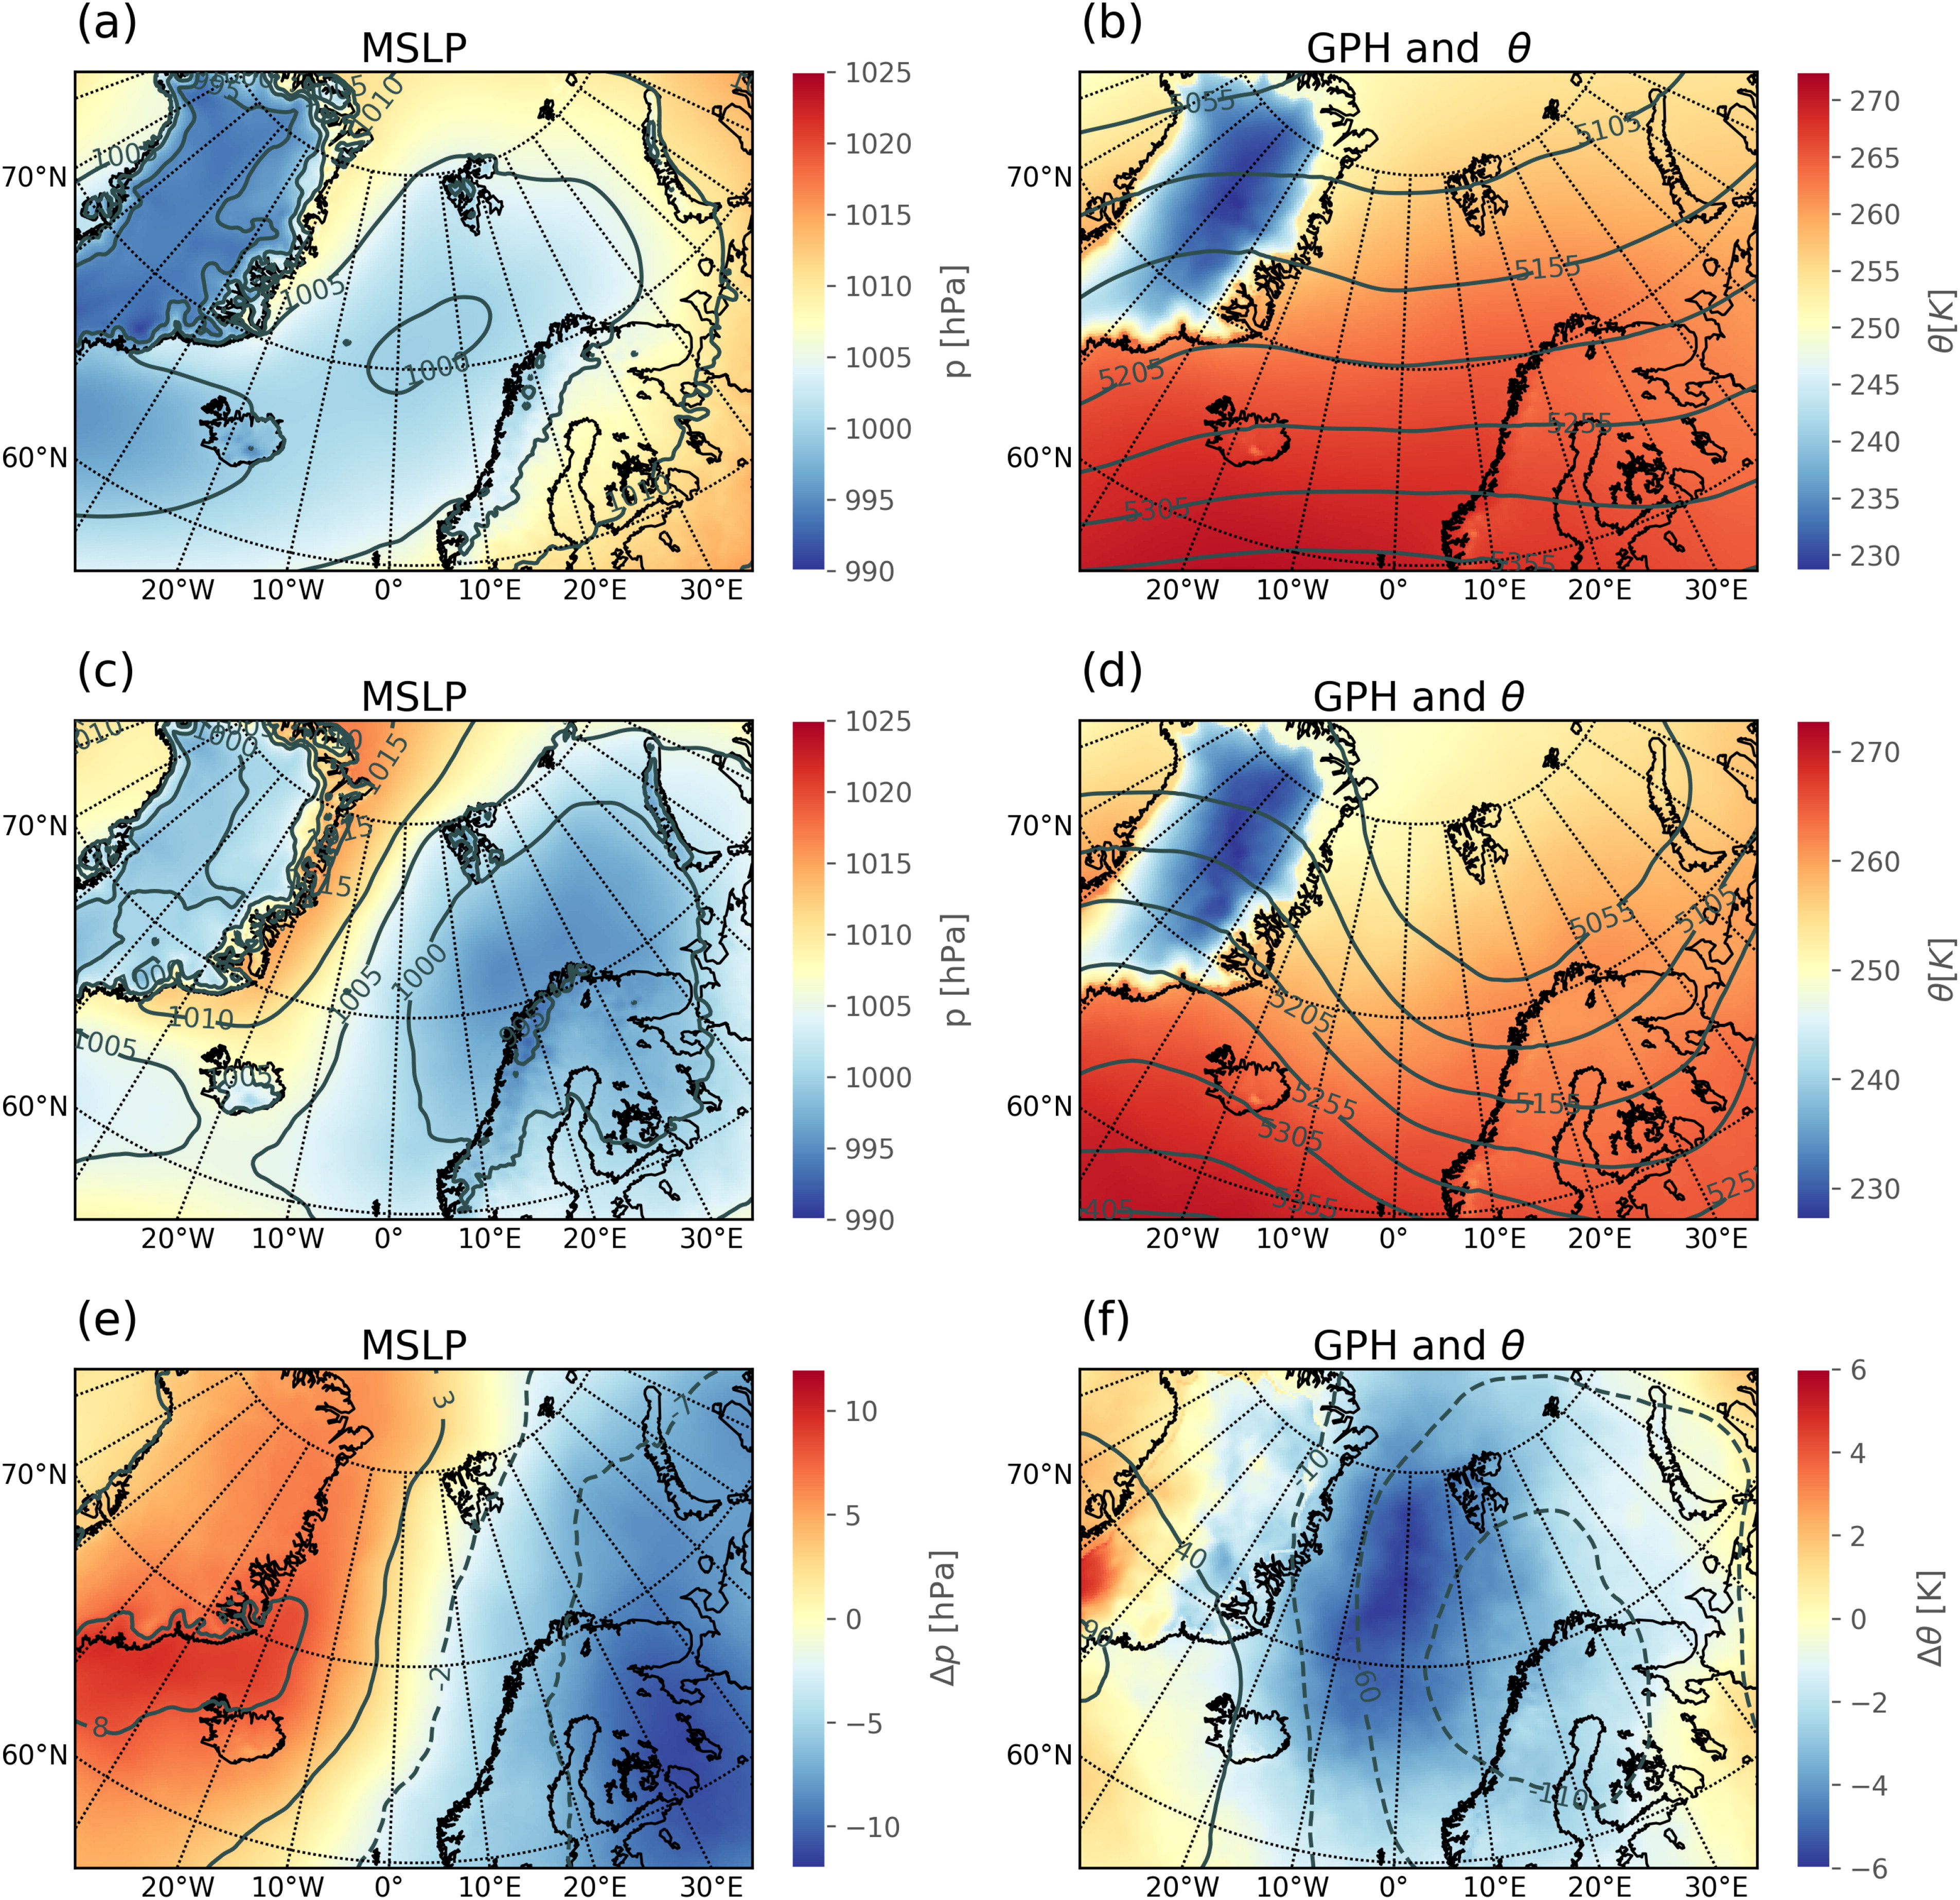
Fig. 9.
Climatology of: (a) all 372 January days for MSLP (colour shading and grey-labeled counters, every 5 hPa) and (b) GPH at 500 hPa (grey-labeled contours, every 50 gpm) and potential temperature at 850 hPa (colour shading); (middle) As in the first row but for PL dates; (bottom) anomalies for both, MSLP (grey-labeled contours, every 5 hPa) (e) and GPH at the 500 hPa level (grey-labeled contours, every 50 gpm) and potential temperature (colour shading) (f).