
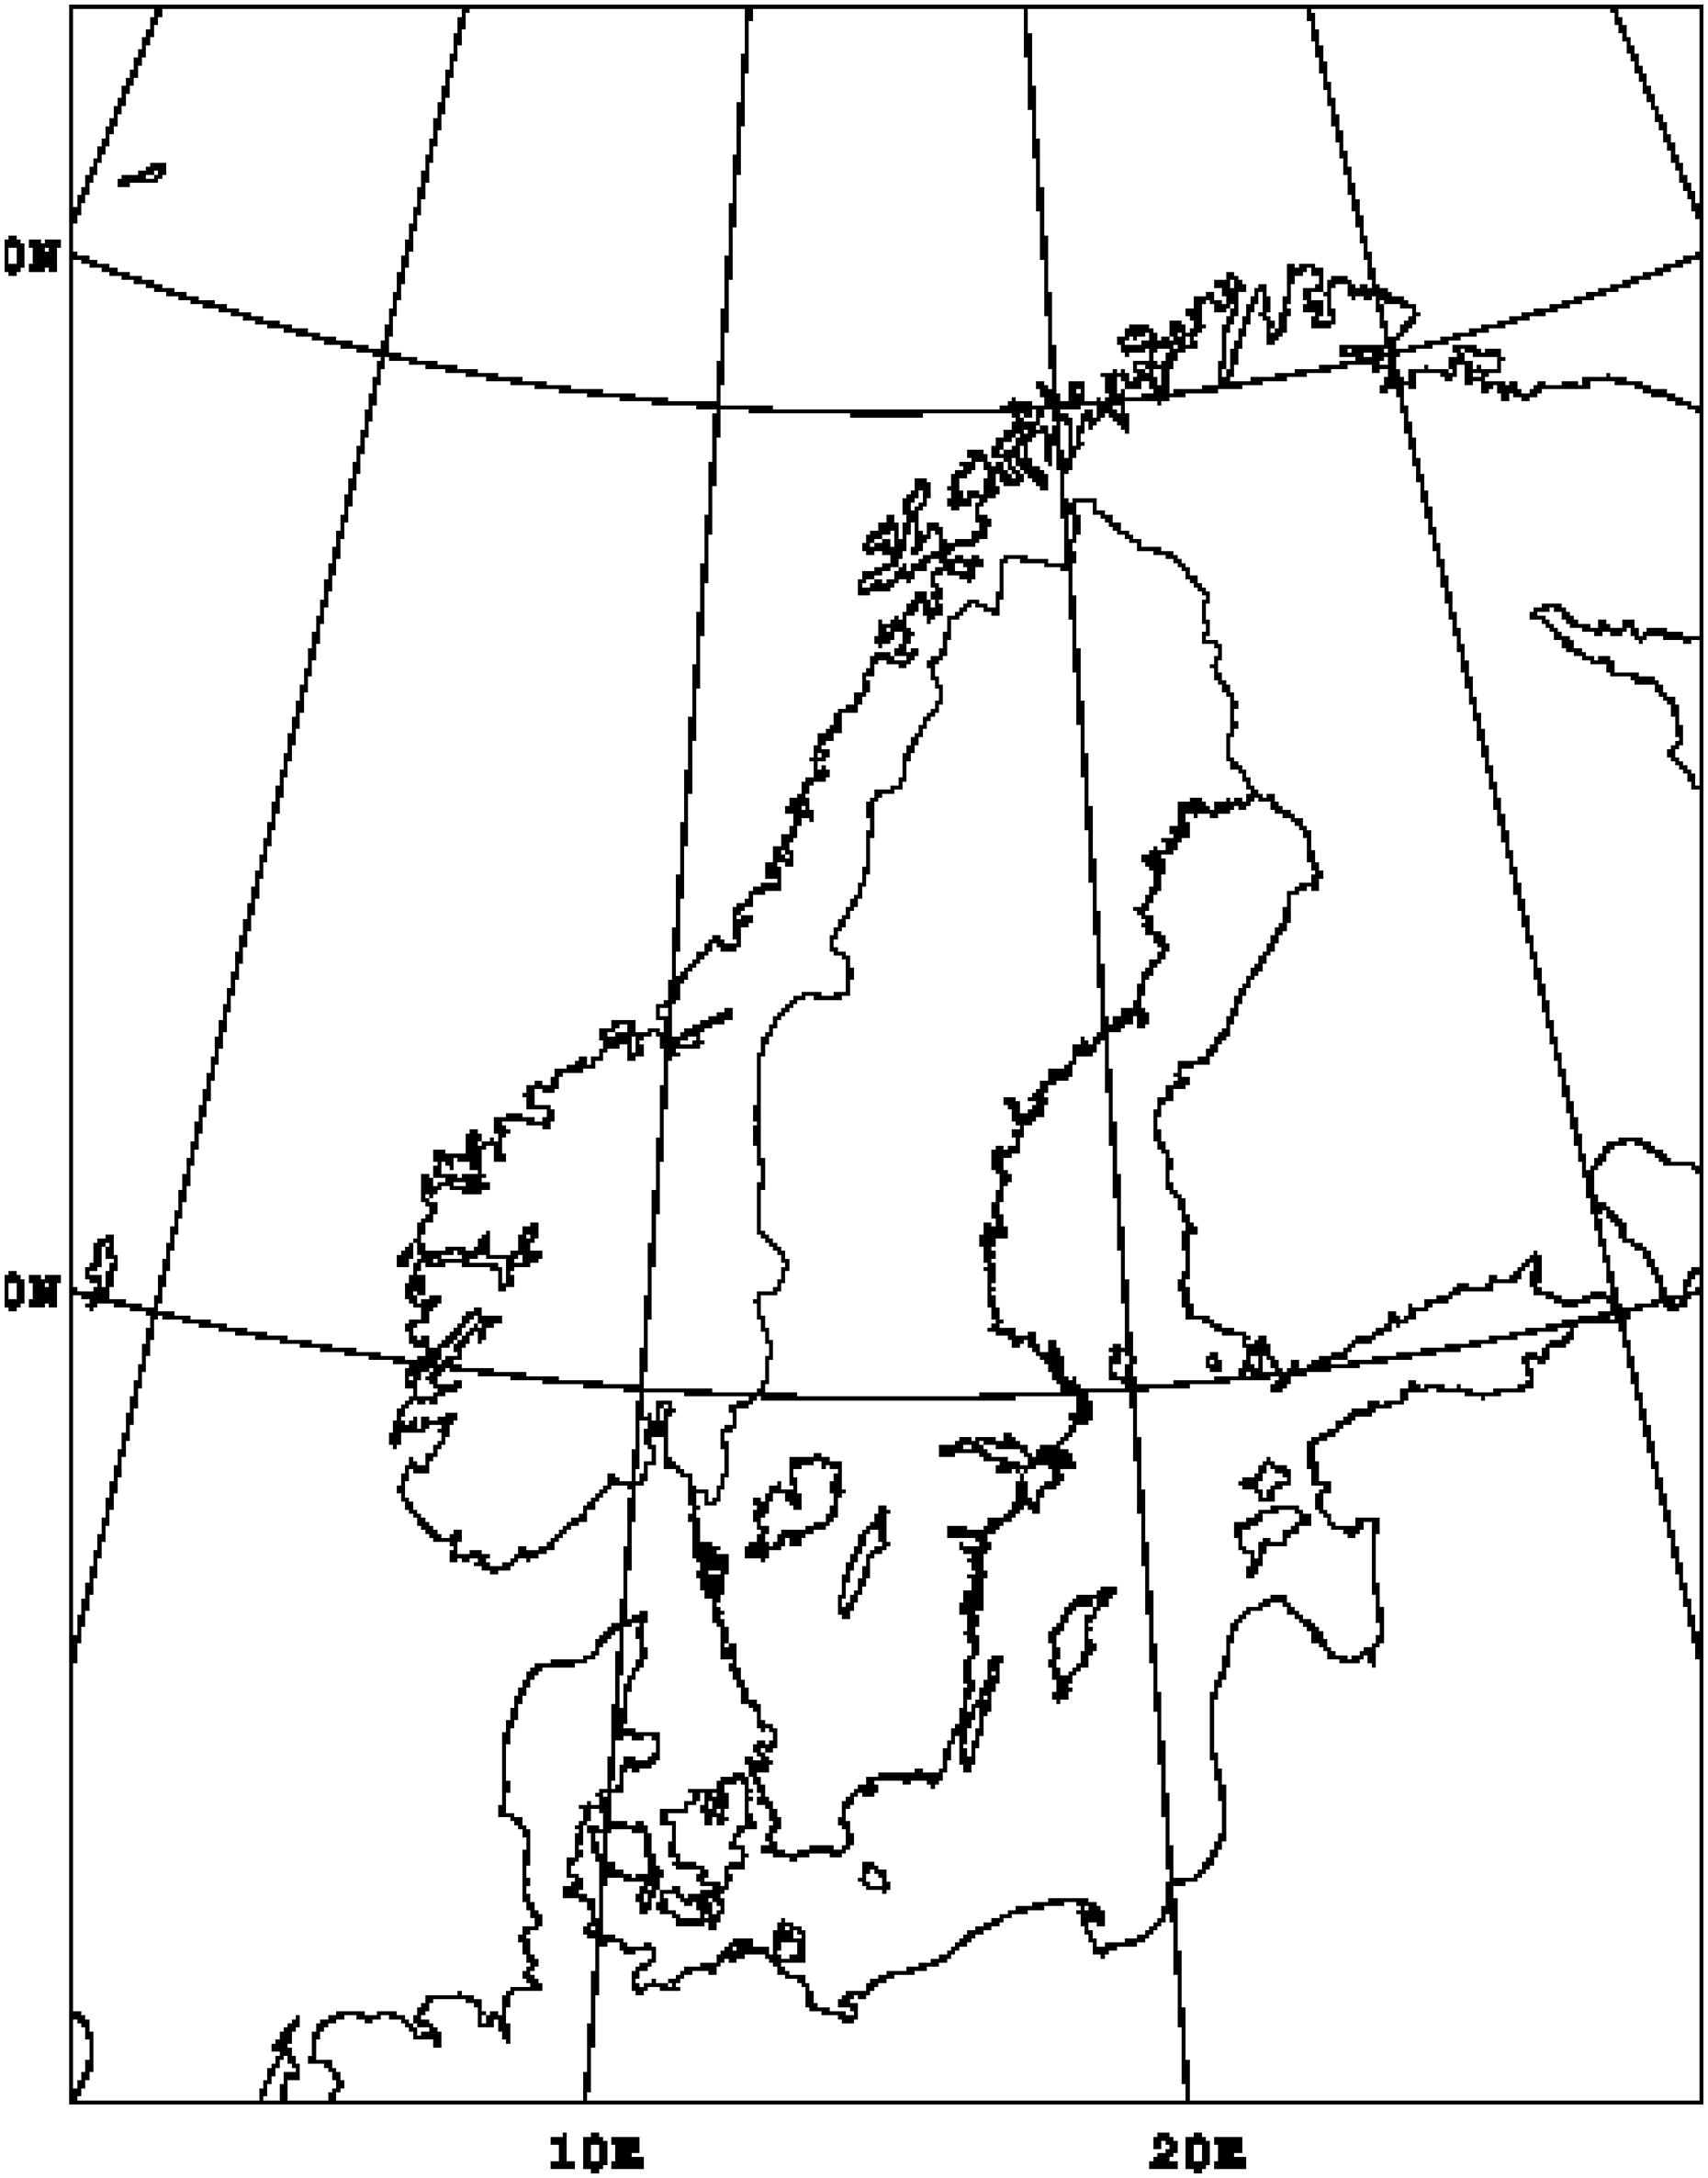
Fig. 1.
Model domain for the HARMONIE ensemble experiments (739 × 949 horizontal grid points with a 2.5 km grid resolution).
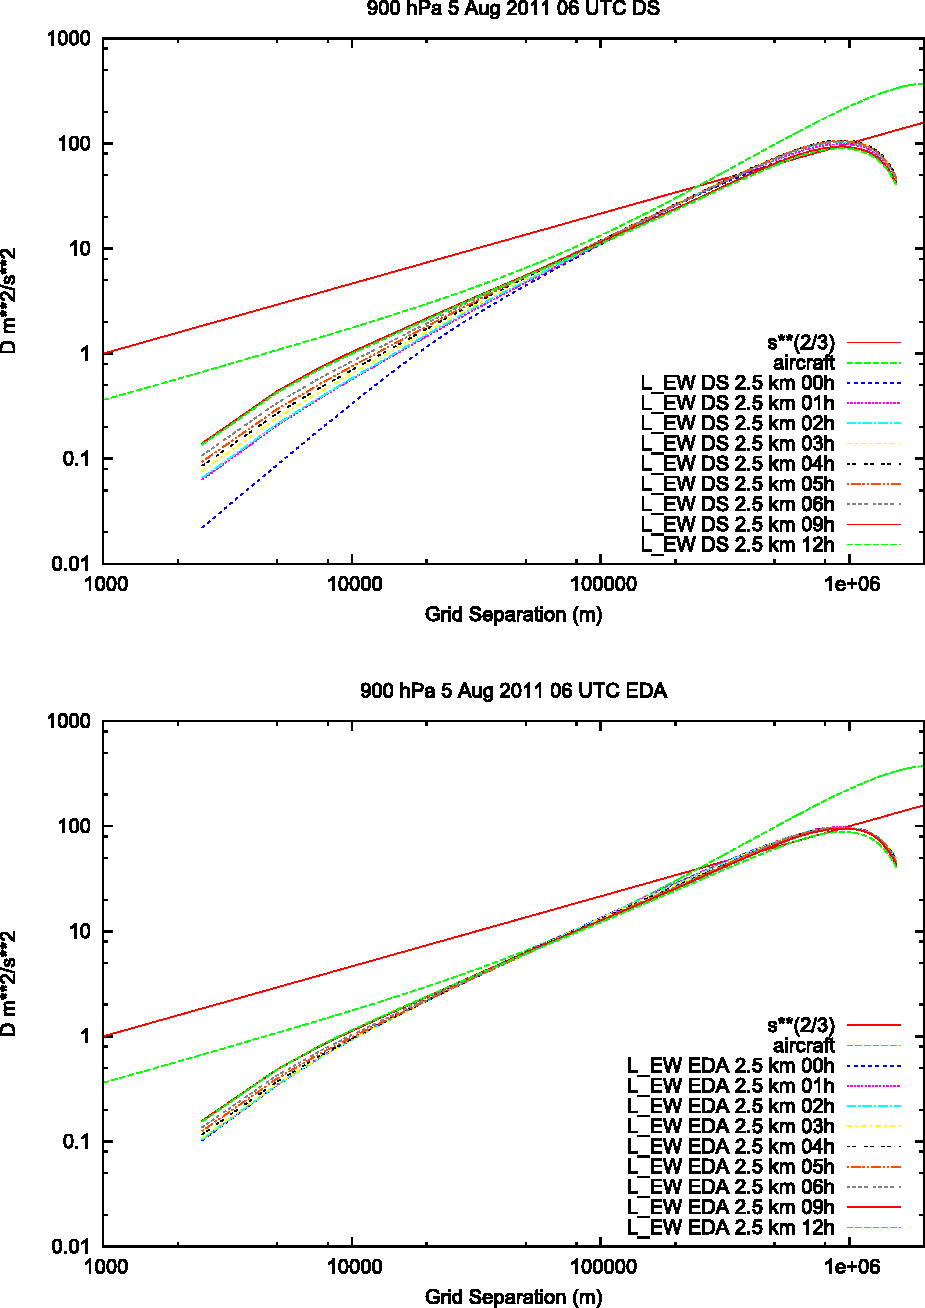
Fig. 2.
Structure functions for the longitudinal component of the wind in the east-weast direction. Horizontal domain average at model level 47 ( 900 hPa) for 5 August 2011 06 UTC. Separate curves for forecast lengths +0 h, +1 h, +2 h, +3 h, +4 h, +5 h, +6 h, +9 h and +12 h. Downscaling (top) and EDA (bottom).
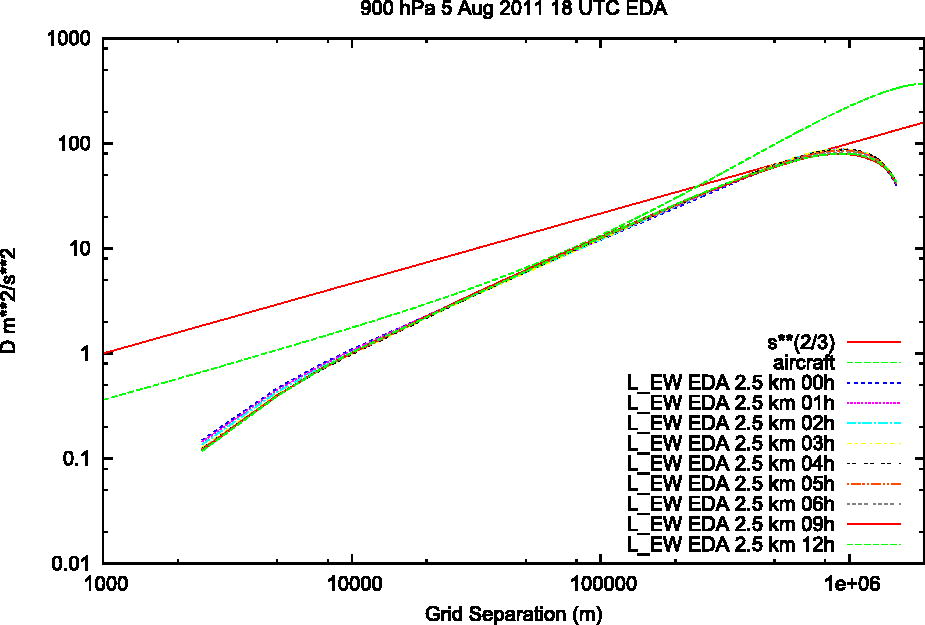
Fig. 3.
Structure functions for the longitudinal component of the wind in the east-west direction. Horizontal domain average at model level 47 ( 900 hPa) for 5 August 2011 18 UTC. Separate curves for forecast lengths +0 h, +1 h, +2 h, +3 h, +4 h, +5 h, +6 h, +9 h and +12 h. The EDA experiment.
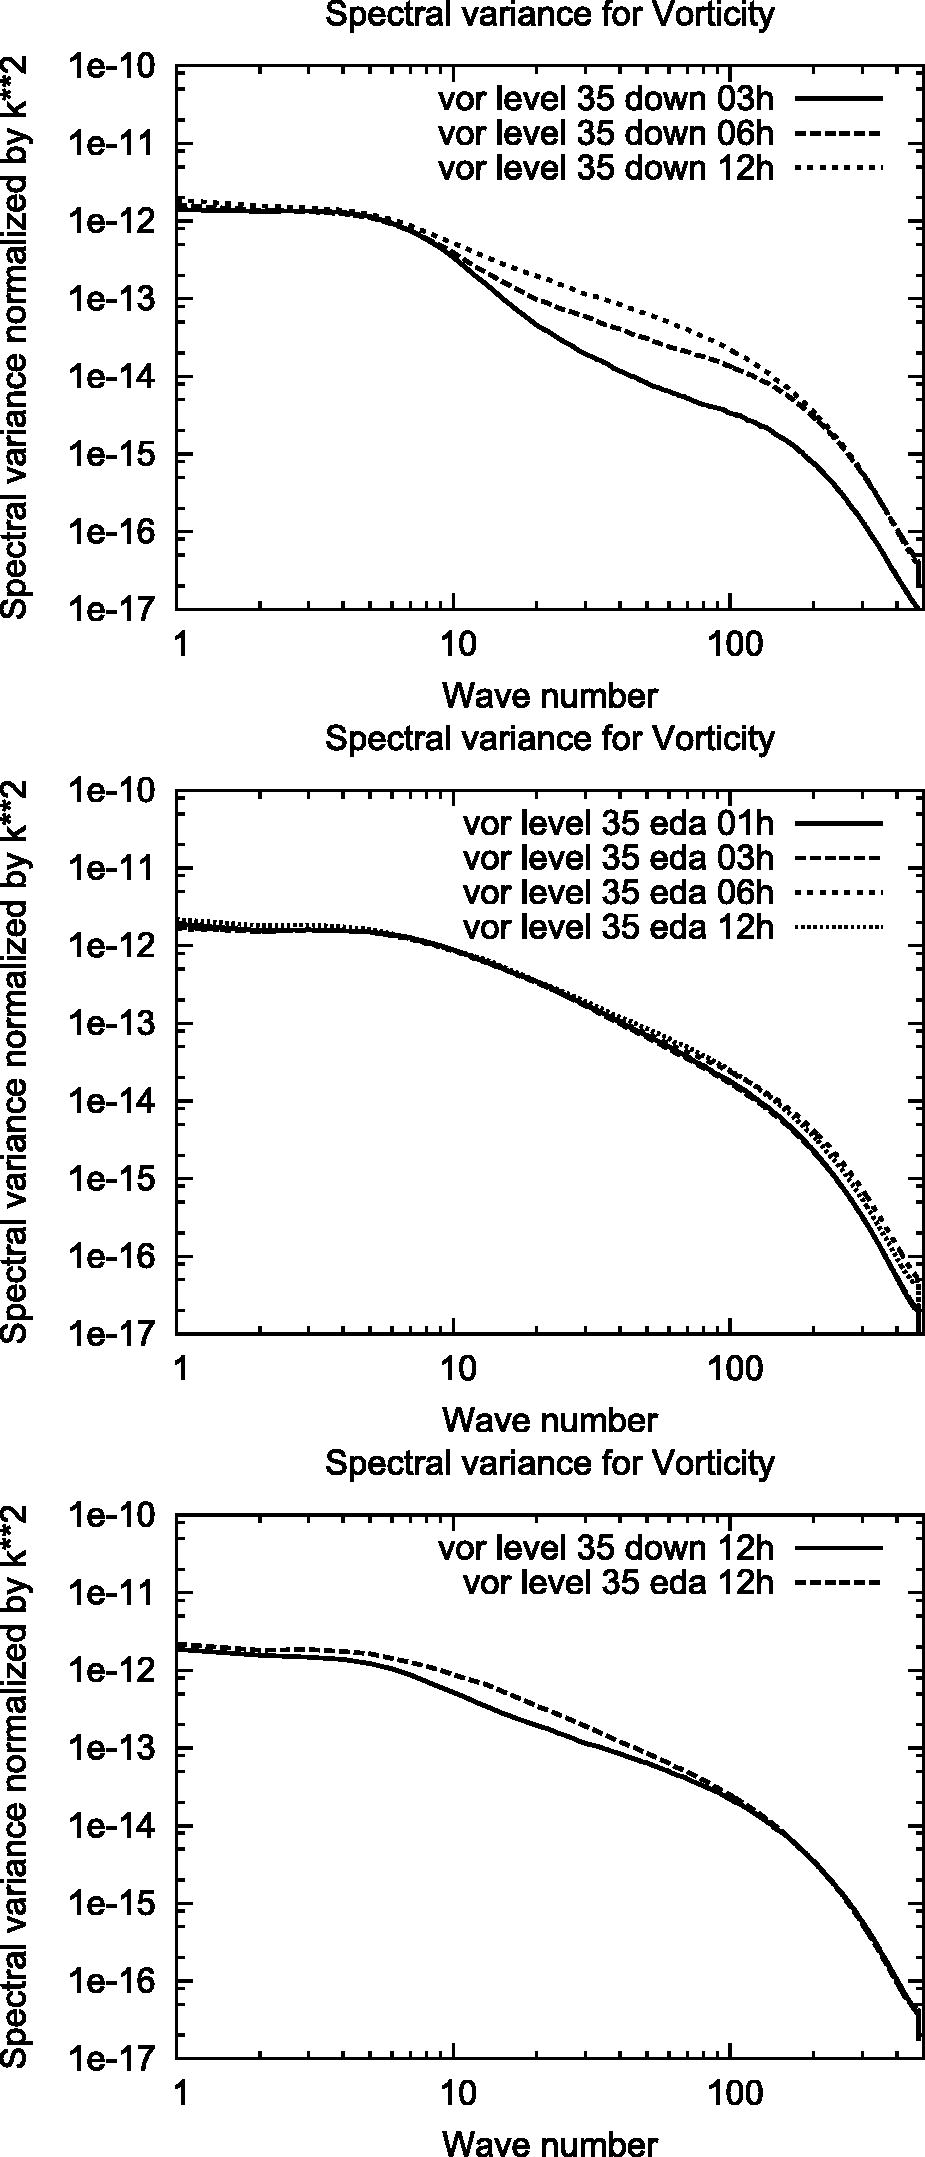
Fig. 4.
Horizontal spectral variance densities of +1 h, +3 h, +6 h and +12 h vorticity background error as estimated by the ensemble downscaling (top) and the Ensemble Data Assimilation (EDA, middle) techniques. Model level 35. Spectral variance densities of +12 h vorticity background error as estimated by the downscaling and EDA techniques (bottom). The spectral variance densities have been normalized with k*2, where k* is the one-dimensional wave number.
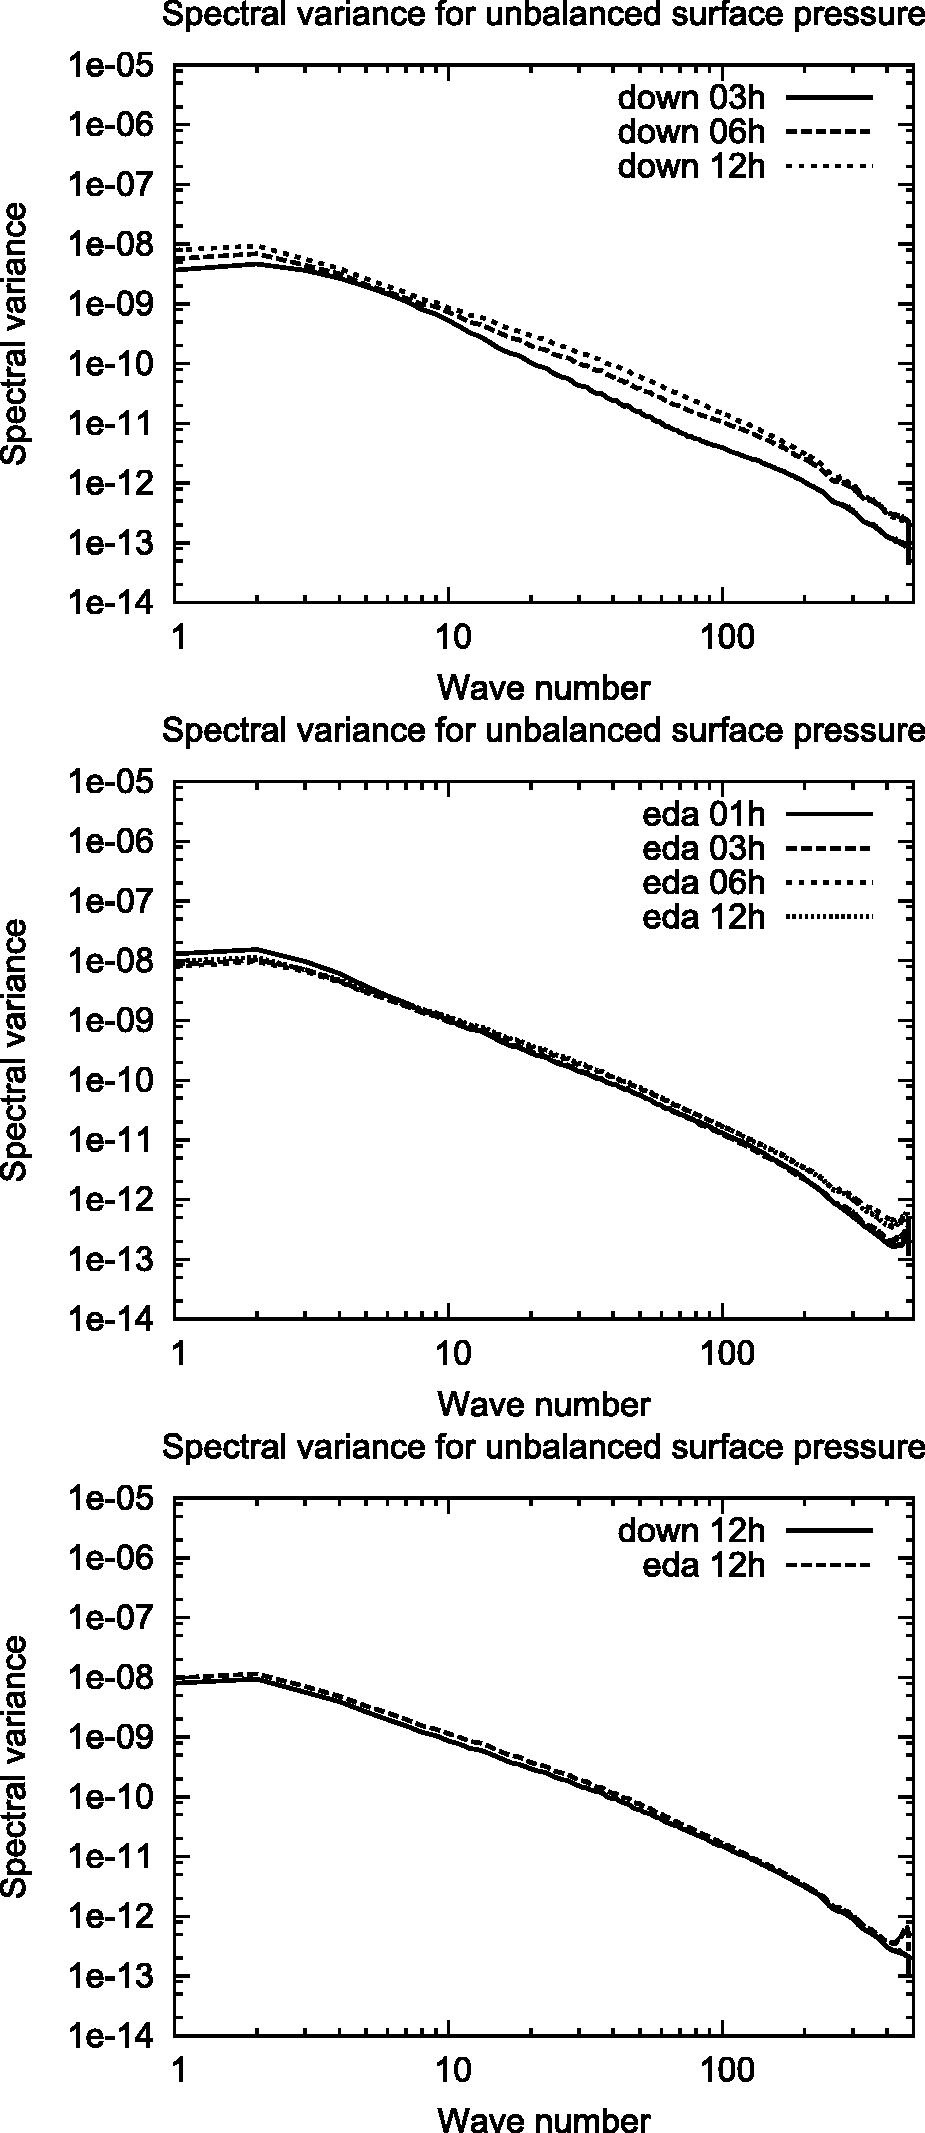
Fig. 5.
Spectral variance densities of +1 h, +3 h, +6 h and +12 h unbalanced surface pressure background error as estimated by the ensemble downscaling (top) and the Ensemble Data Assimilation (EDA, middle) techniques. Model level 35. Spectral variance densities of +12 h unbalanced surface pressure background error as estimated by the downscaling and EDA techniques (bottom).
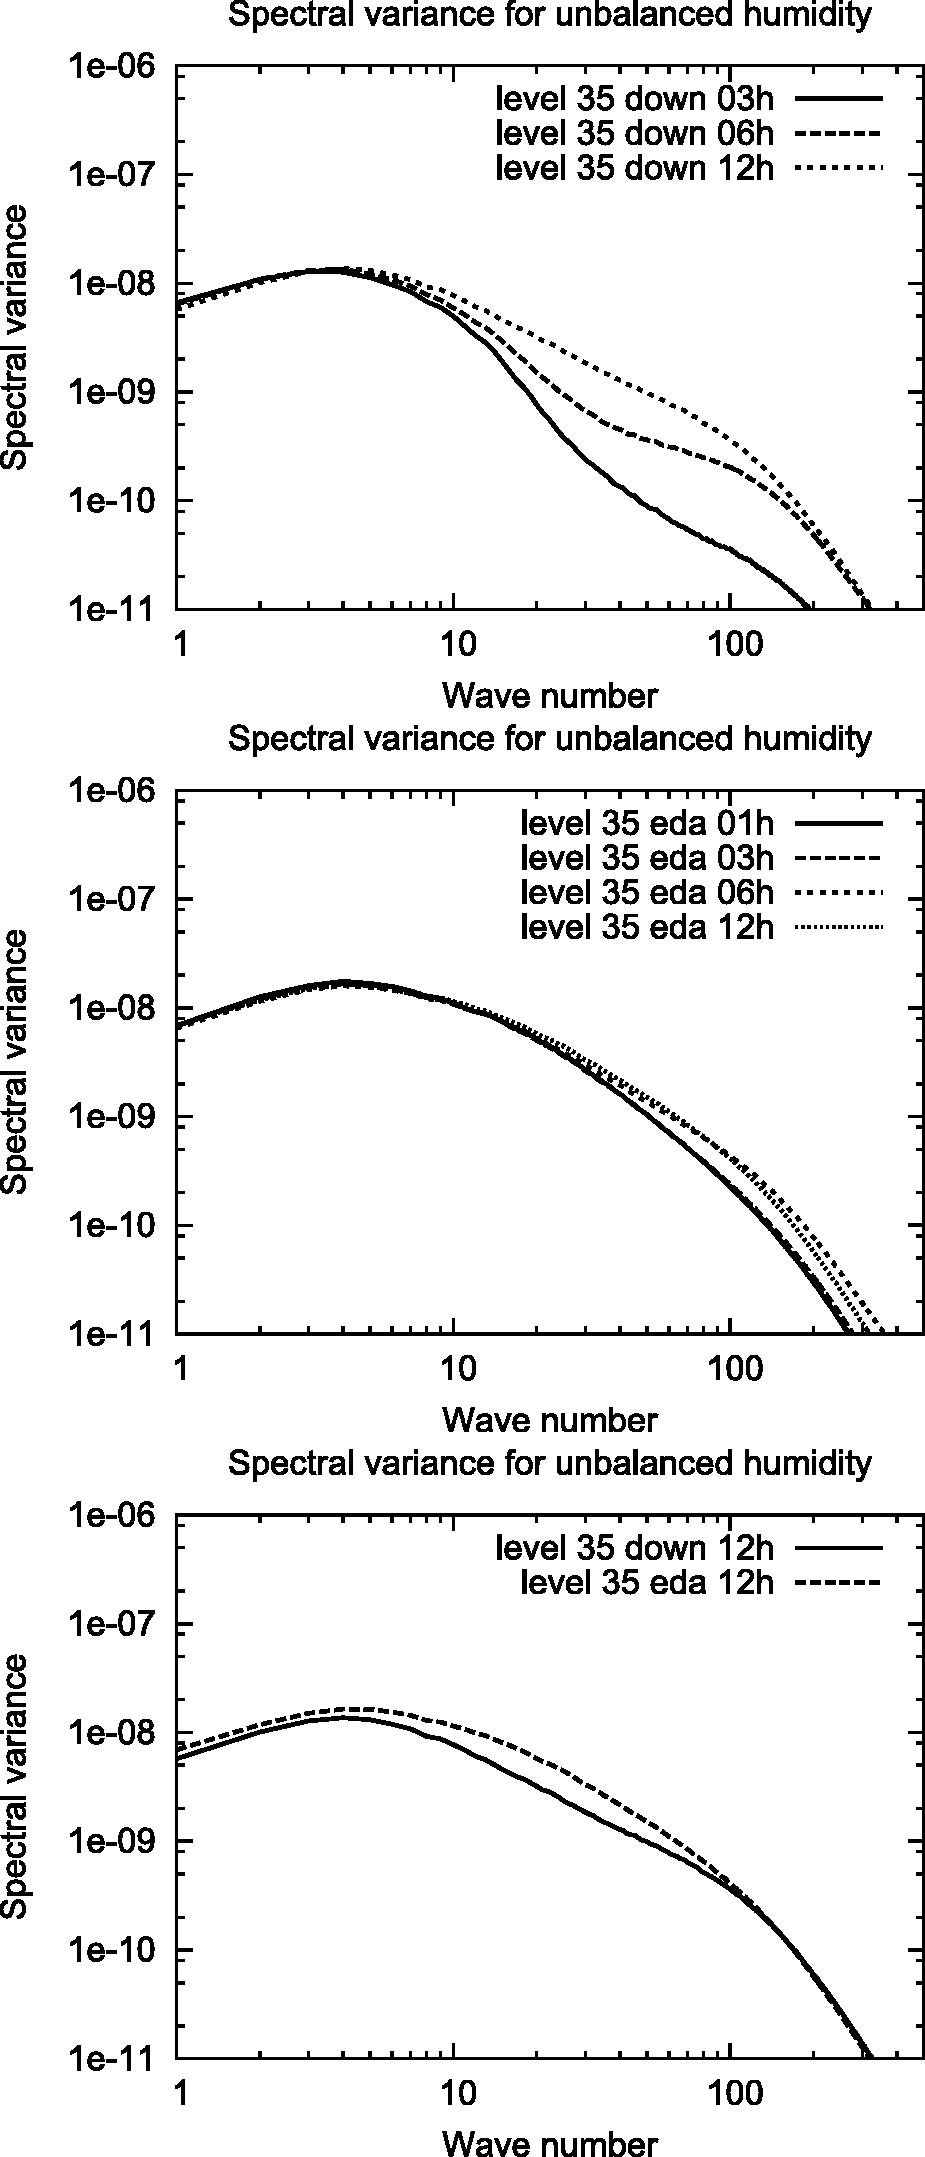
Fig. 6.
Spectral variance densities of +1 h, +3 h, +6 h and +12 h unbalanced humidity background error as estimated by the ensemble downscaling (top) and the Ensemble Data Assimilation (EDA, middle) techniques. Model level 35. Spectral variance densities of +12 h unbalanced humidity background error as estimated by the downscaling and EDA techniques (bottom).
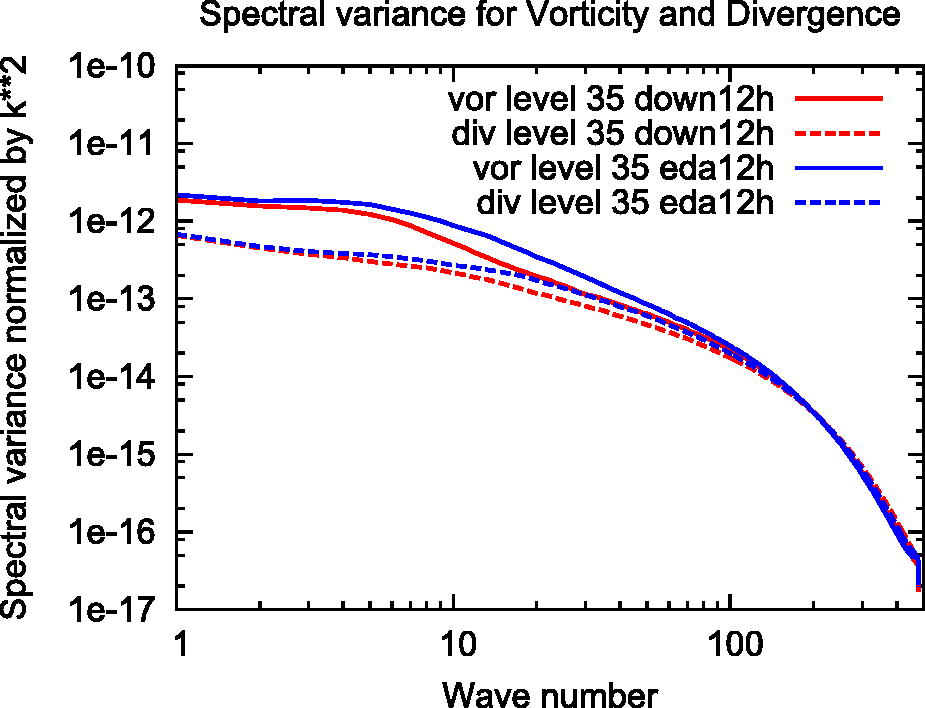
Fig. 7.
Spectral variance densities of +12 h vorticity and unbalanced divergence background errors as estimated by the ensemble downscaling and the Ensemble Data Assimilation (EDA) techniques. Model level 35. The spectral variance densities have been normalized with k*2, where k* is the one-dimensional wave number.
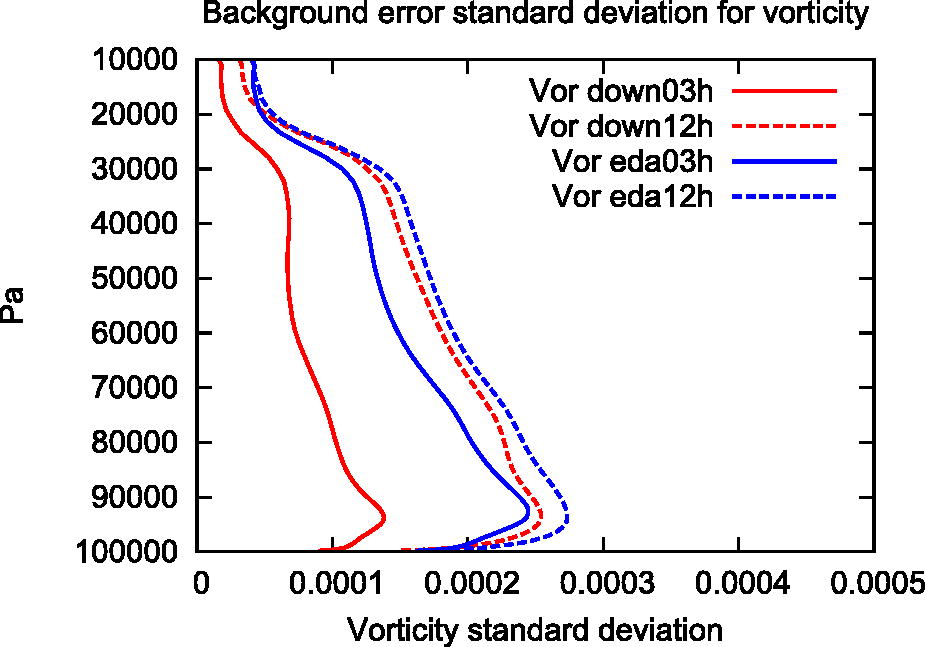
Fig. 8.
Background error standard deviations for vorticity, +3 h and +12 h, downscaling and EDA.
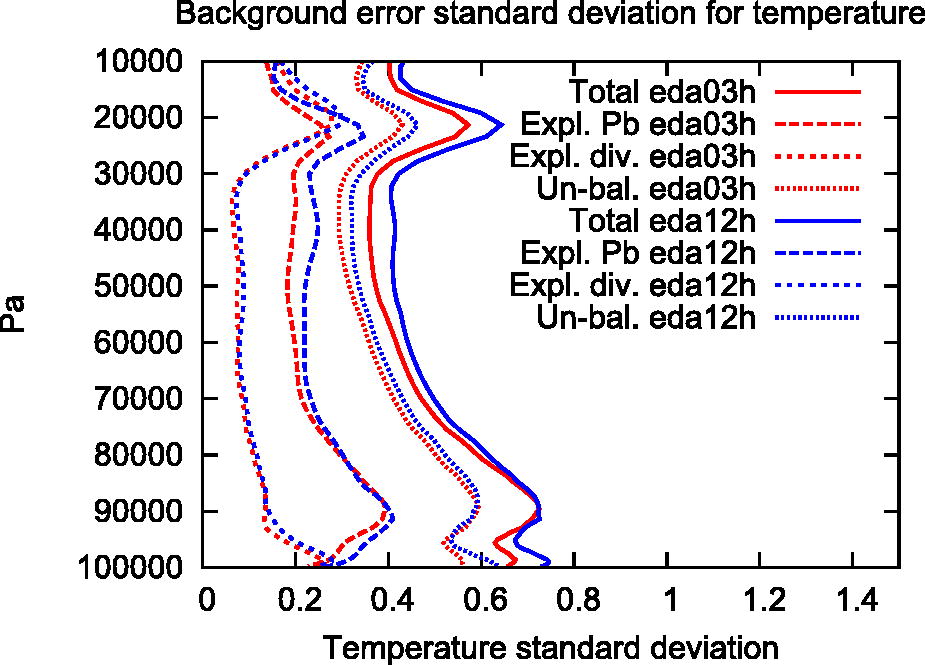
Fig. 9.
Background error standard deviations for temperature, +3 h and +12 h, EDA; The component balanced with vorticity (via linearized geopotential Pb), the component balanced with unbalanced divergence, the unbalanced component and total standard deviation.
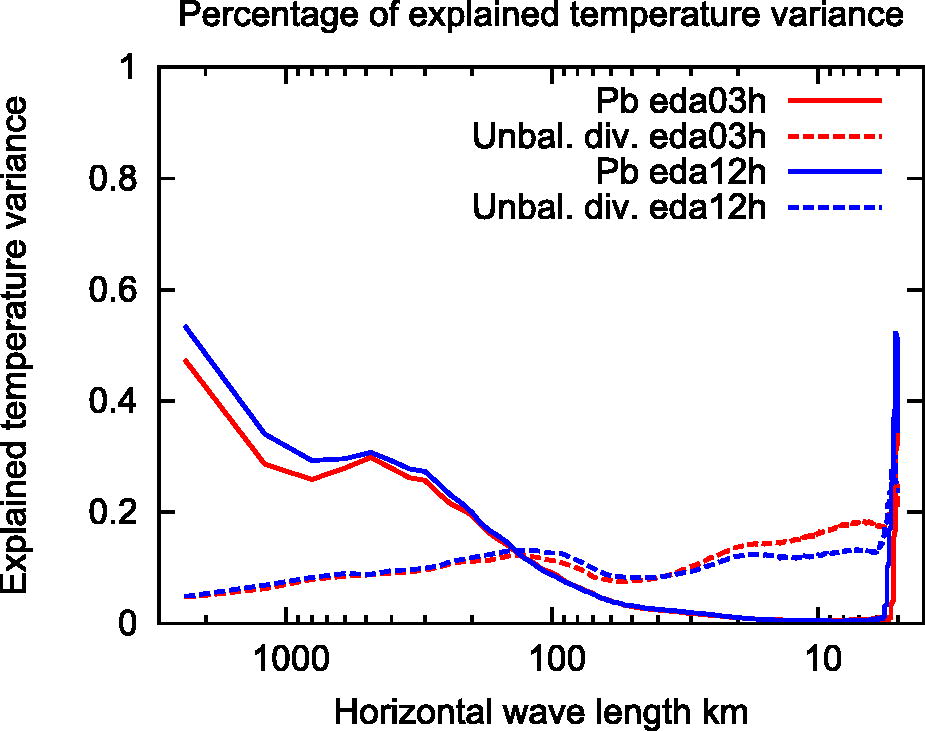
Fig. 10.
Percentages of temperature background error variances explained by vorticity and unbalanced divergence as a function of horizontal wave number. EDA +3 h and EDA +12 h.
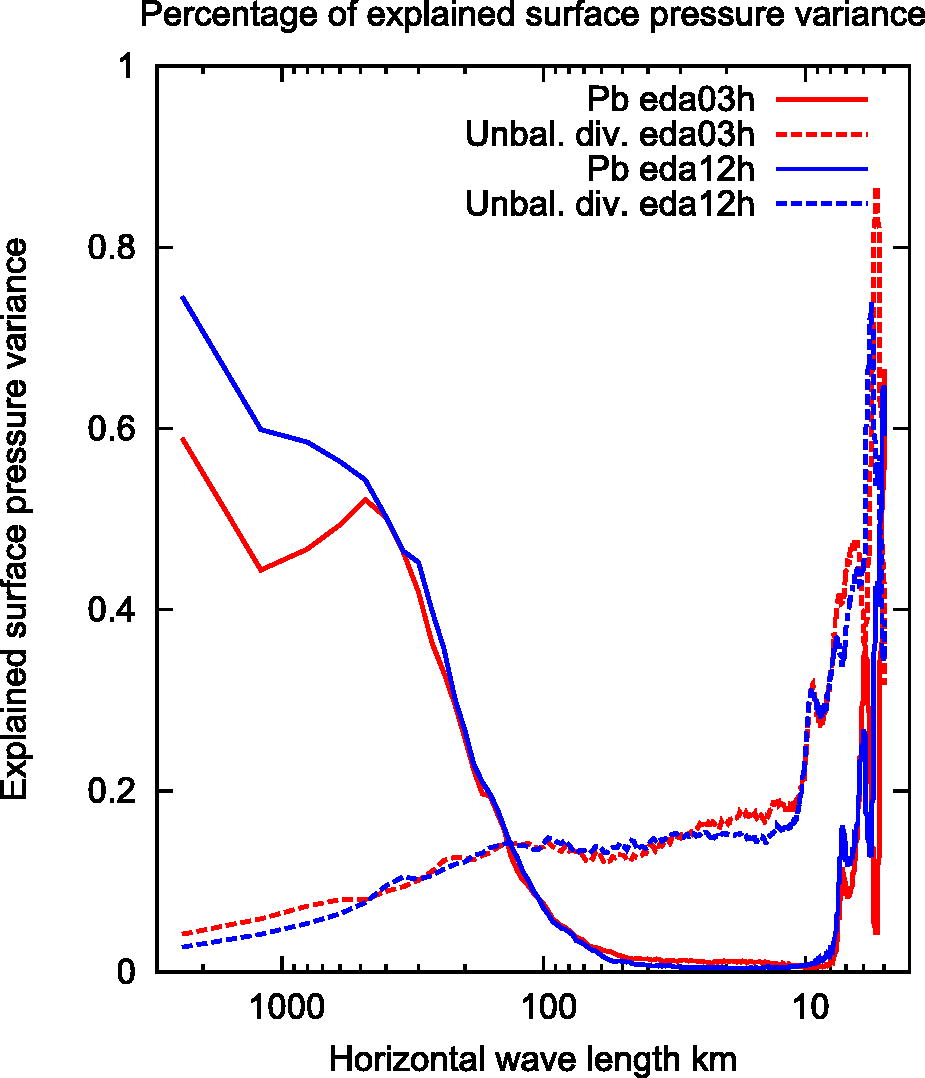
Fig. 11.
Percentages of surface pressure background error variances explained by vorticity and unbalanced divergence as a function of horizontal wave number. EDA +3 h and EDA +12 h.
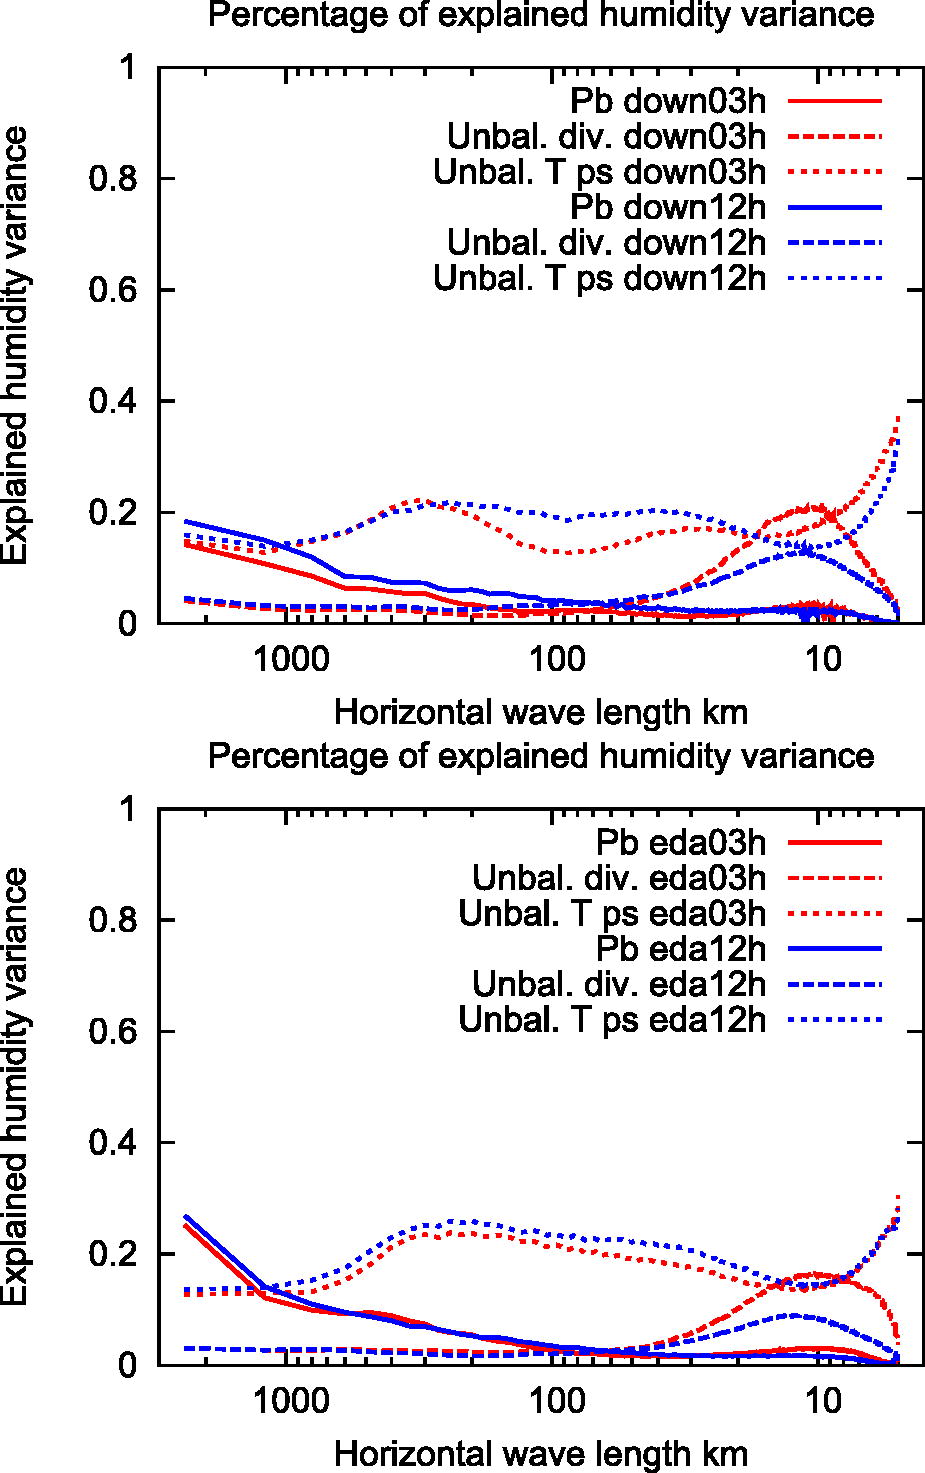
Fig. 12.
Percentages of humidity background error variances explained by vorticity, unbalanced divergence and unbalanced temperature and surface pressure as a function of horizontal wave number. Downscaling +3 h, +12 h (top), EDA +3 h, +12 h (bottom).
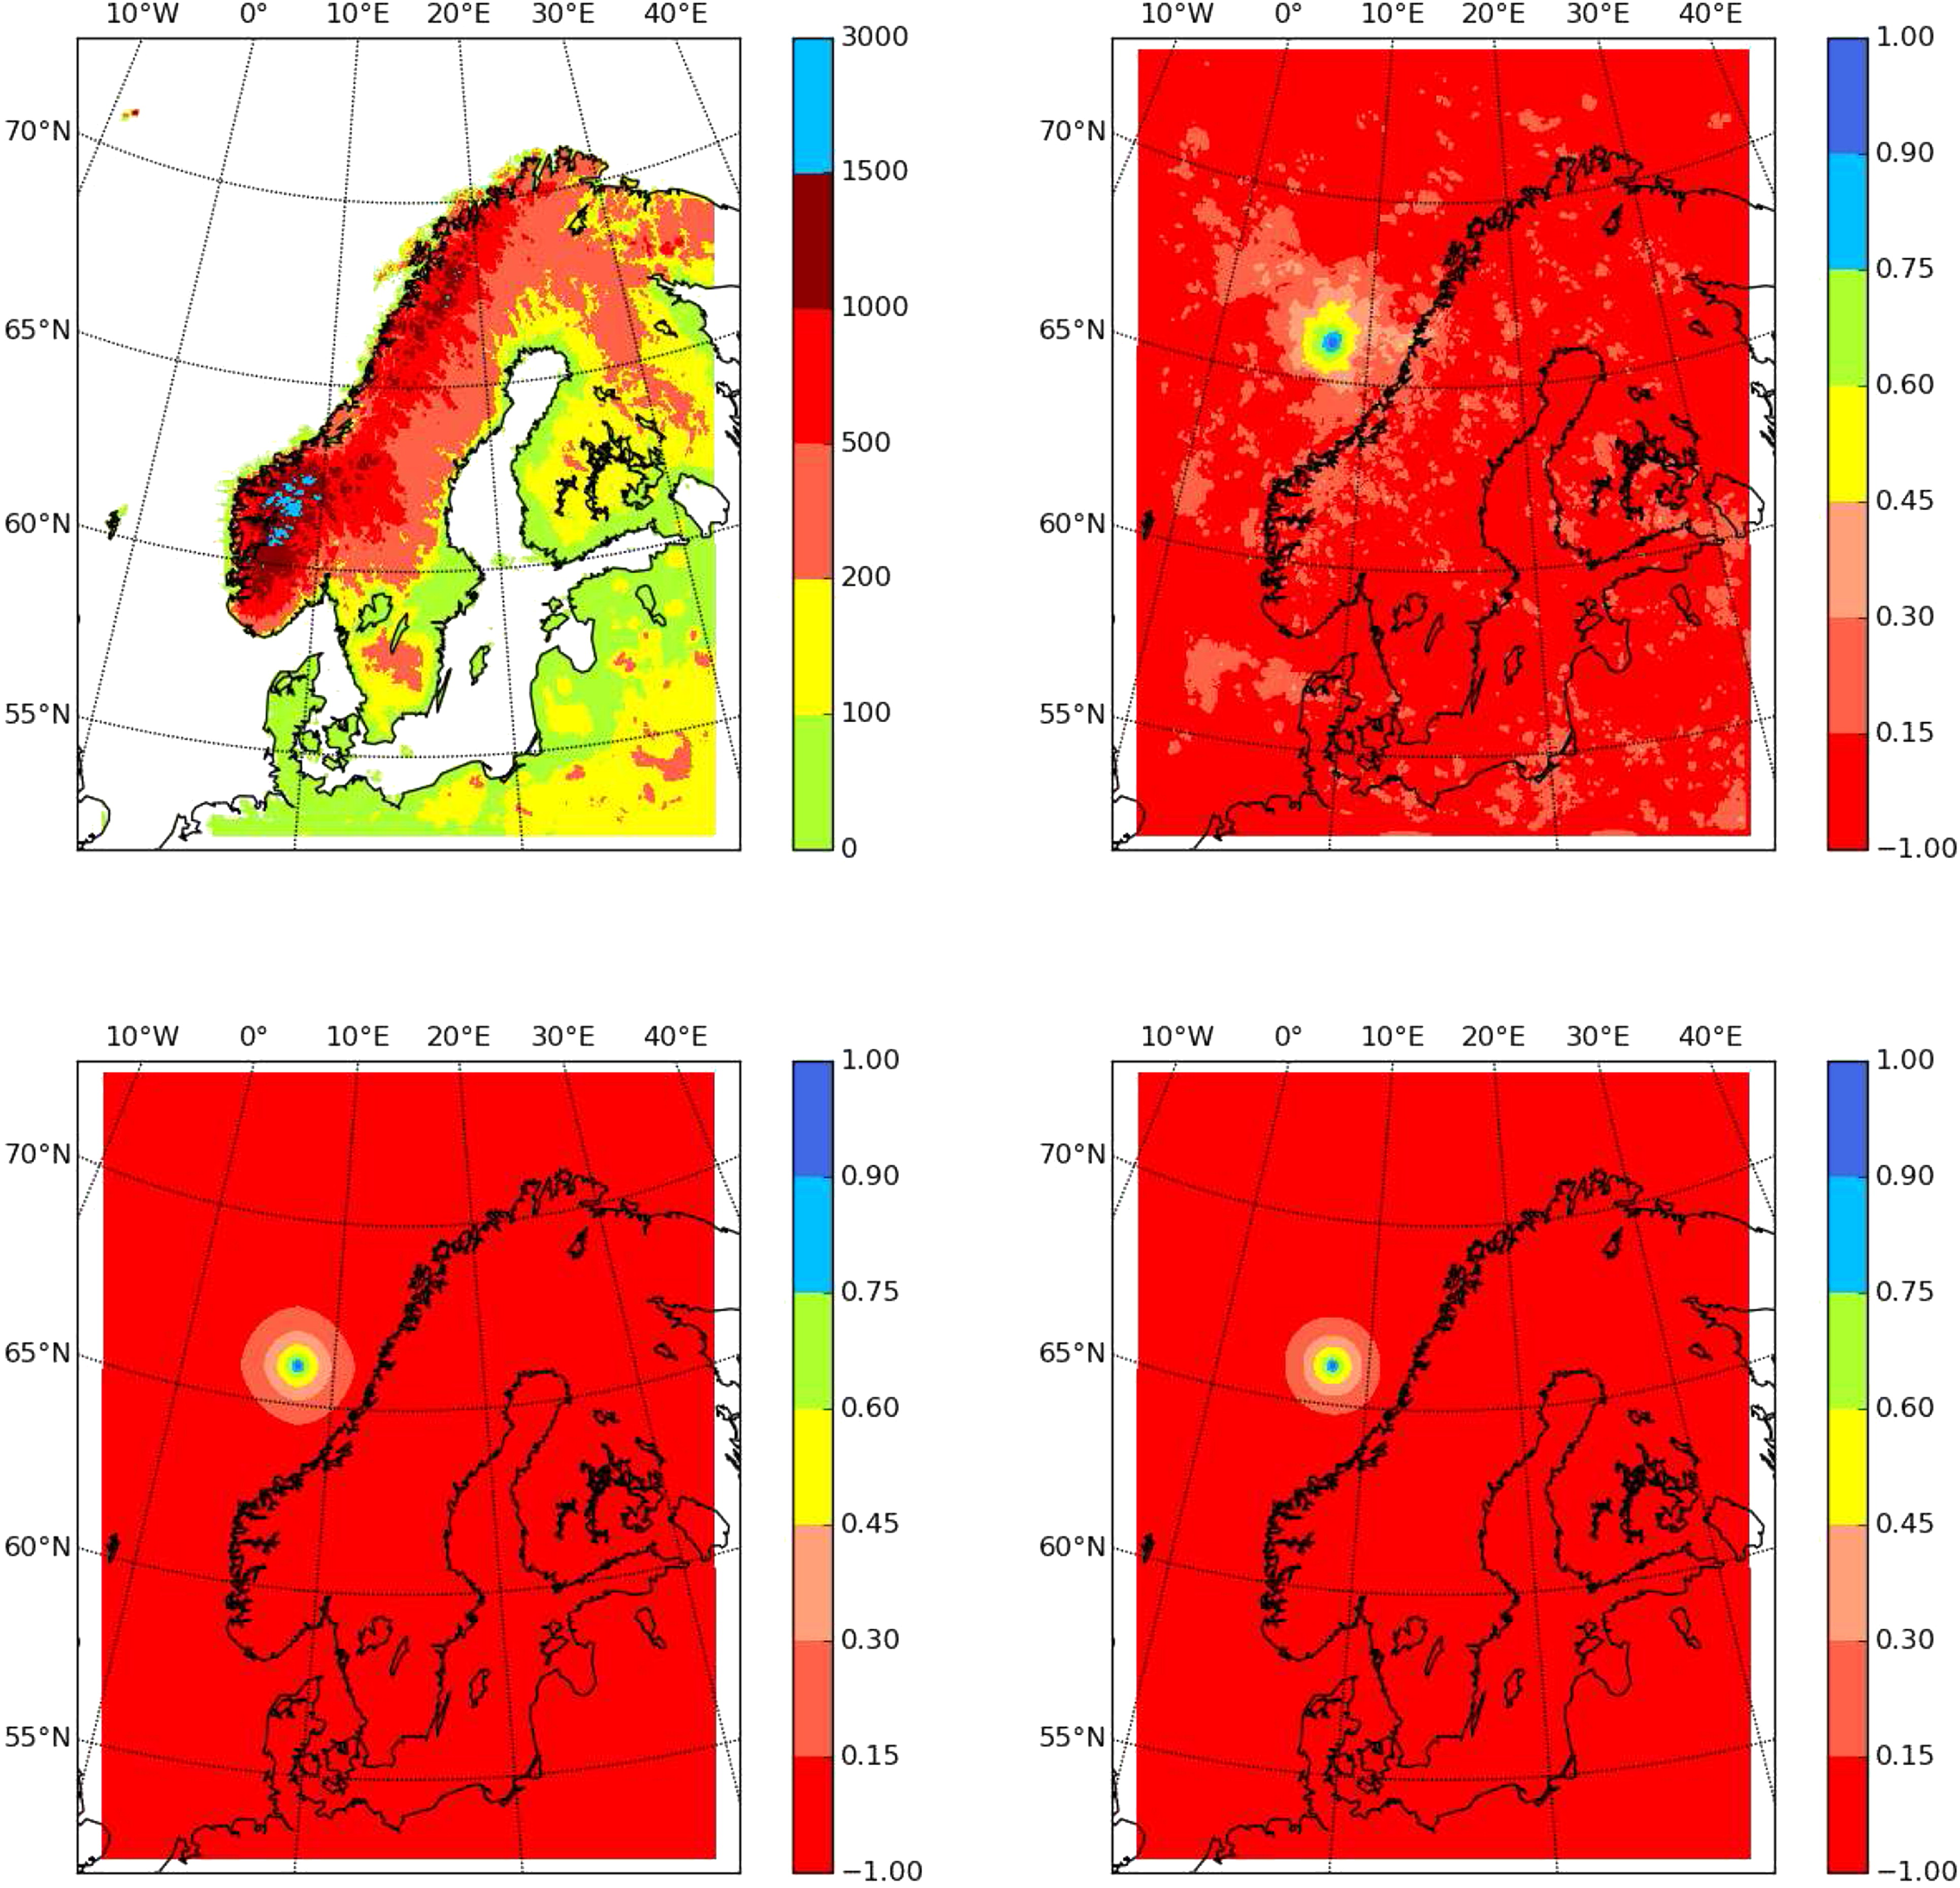
Fig. 13.
Orography (upper left). Horizontal correlations for temperature at model level 35 ( 500 hPa) with reference to the grid point (x,y)=(235,595), averages over ensemble members and time: no further assumptions (upper right), homogeneity assumption (lower left), homogeneity and isotropy assumptions (lower right).
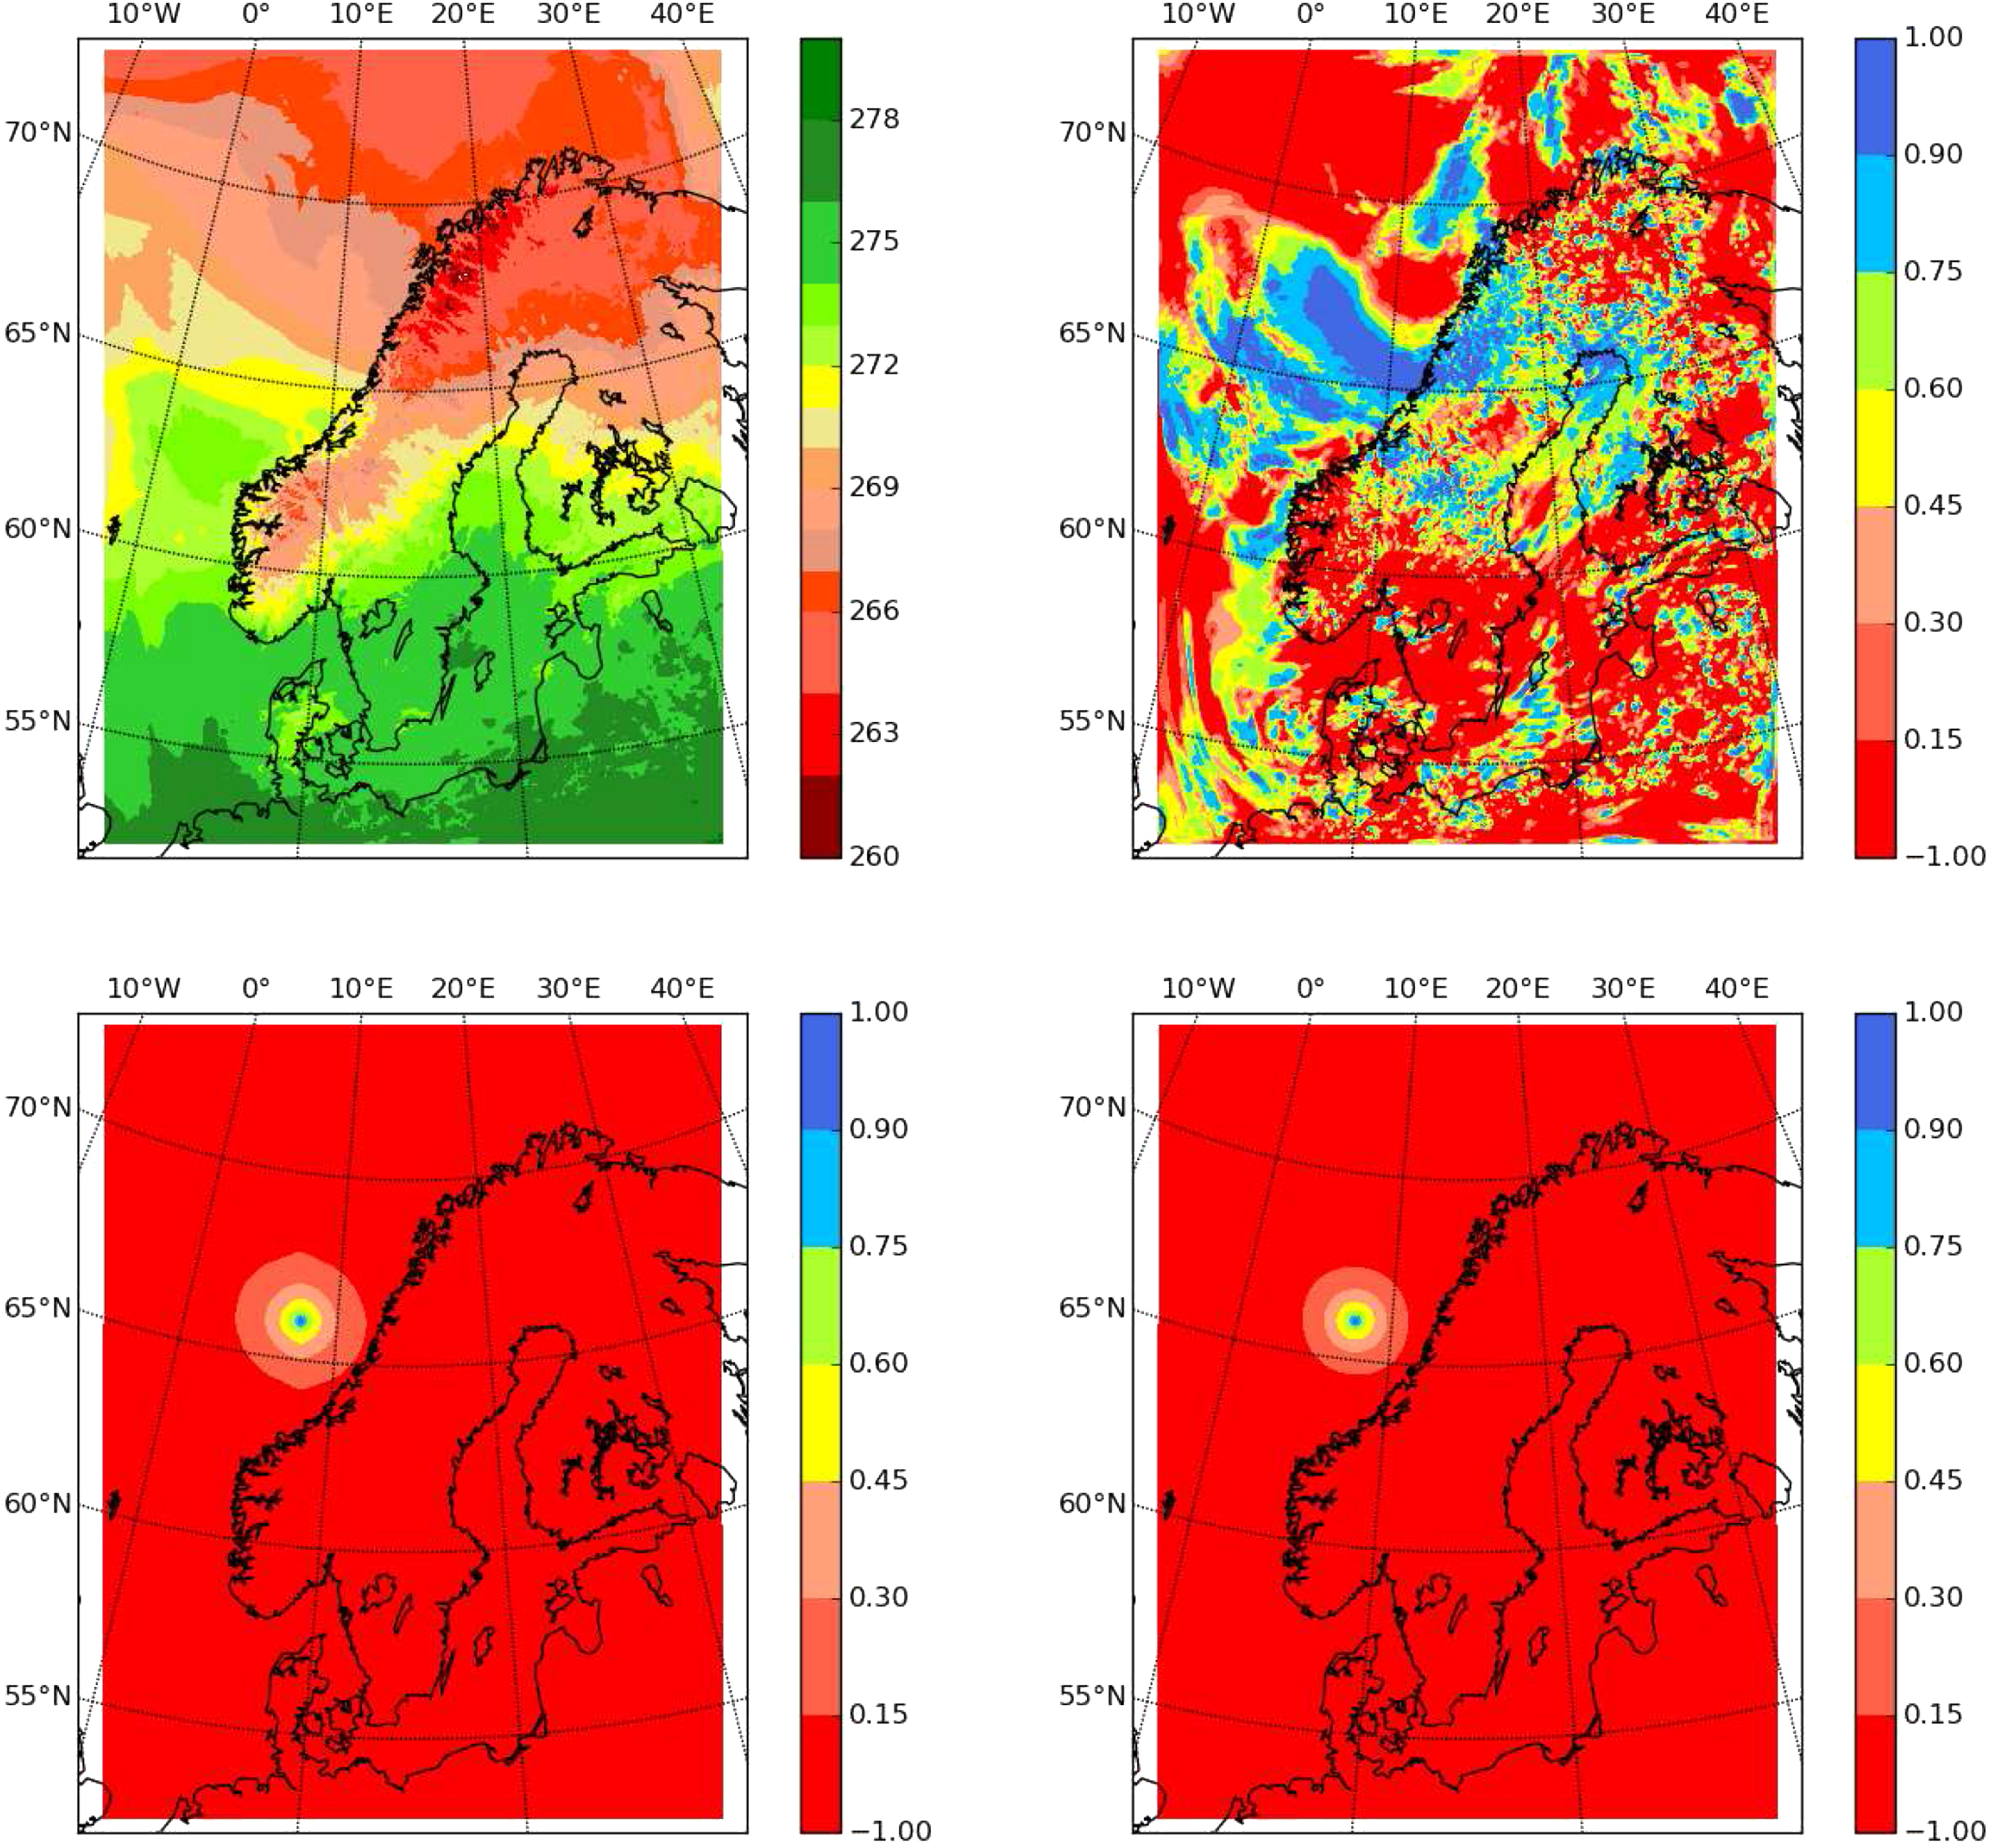
Fig. 14.
Temperature at model level 35 ( 500 hPa) 12 August 2011 + 12 h, ensemble member 1. Horizontal correlations for temperature with reference in the grid point (66N,08E), averages over ensemble members: no further assumptions (upper right), homogeneity assumption (lower left), homogeneity and isotropy assumptions (lower right).
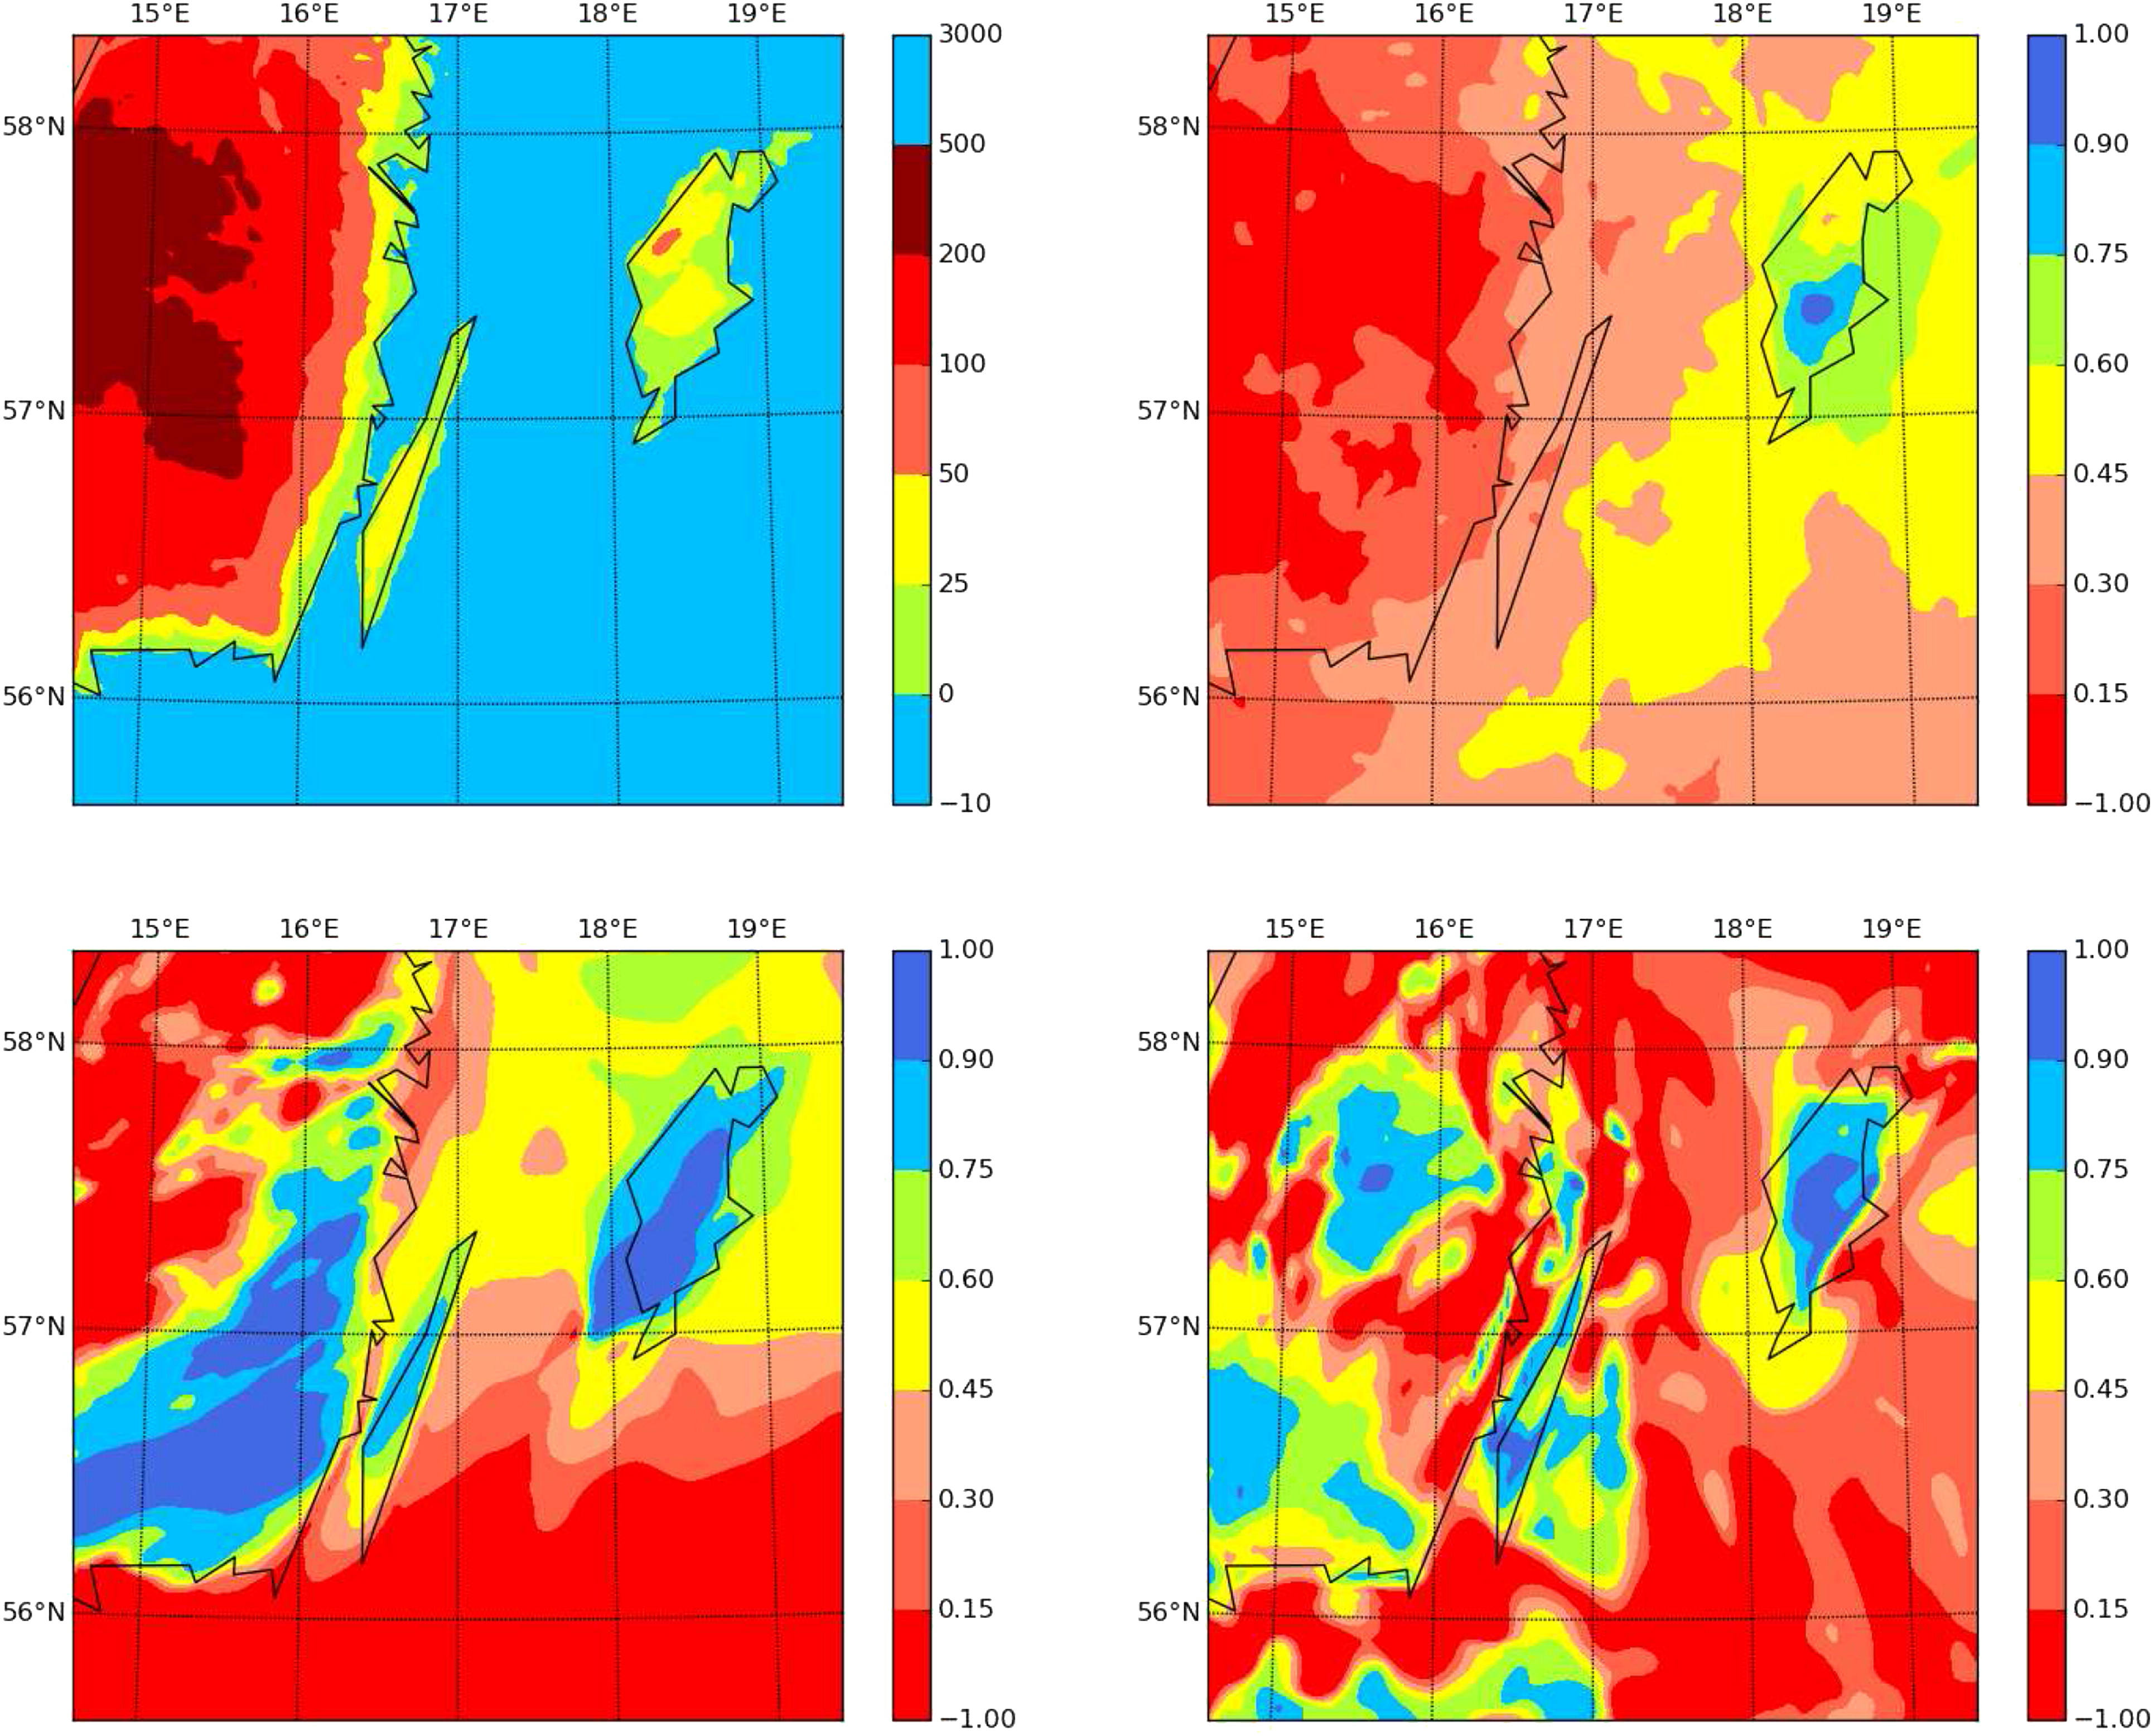
Fig. 15.
Orography of a sub-domain over the Western Baltic Sea including the east coast of mainland Sweden and the Islands of Öland and Gotland. Horizontal correlations for temperature at model level 62 (a few hundred meters above the ground) with a reference point over central Gotland. Time averaged correlations for August 2011 (upper right) and averages over ensemble members only for 12 August 2011 06UTC +12 h (lower left) and 21 August 2011 06UTC +12 h (lower right).
Table 1.
Summary of the conducted experiments and their abbreviations. M denotes number of 1 D wave-components in the analysis increment, denotes grid-size of the analysis increment and Ls denotes the length of the shortest resolved wave component of the analysis increment.
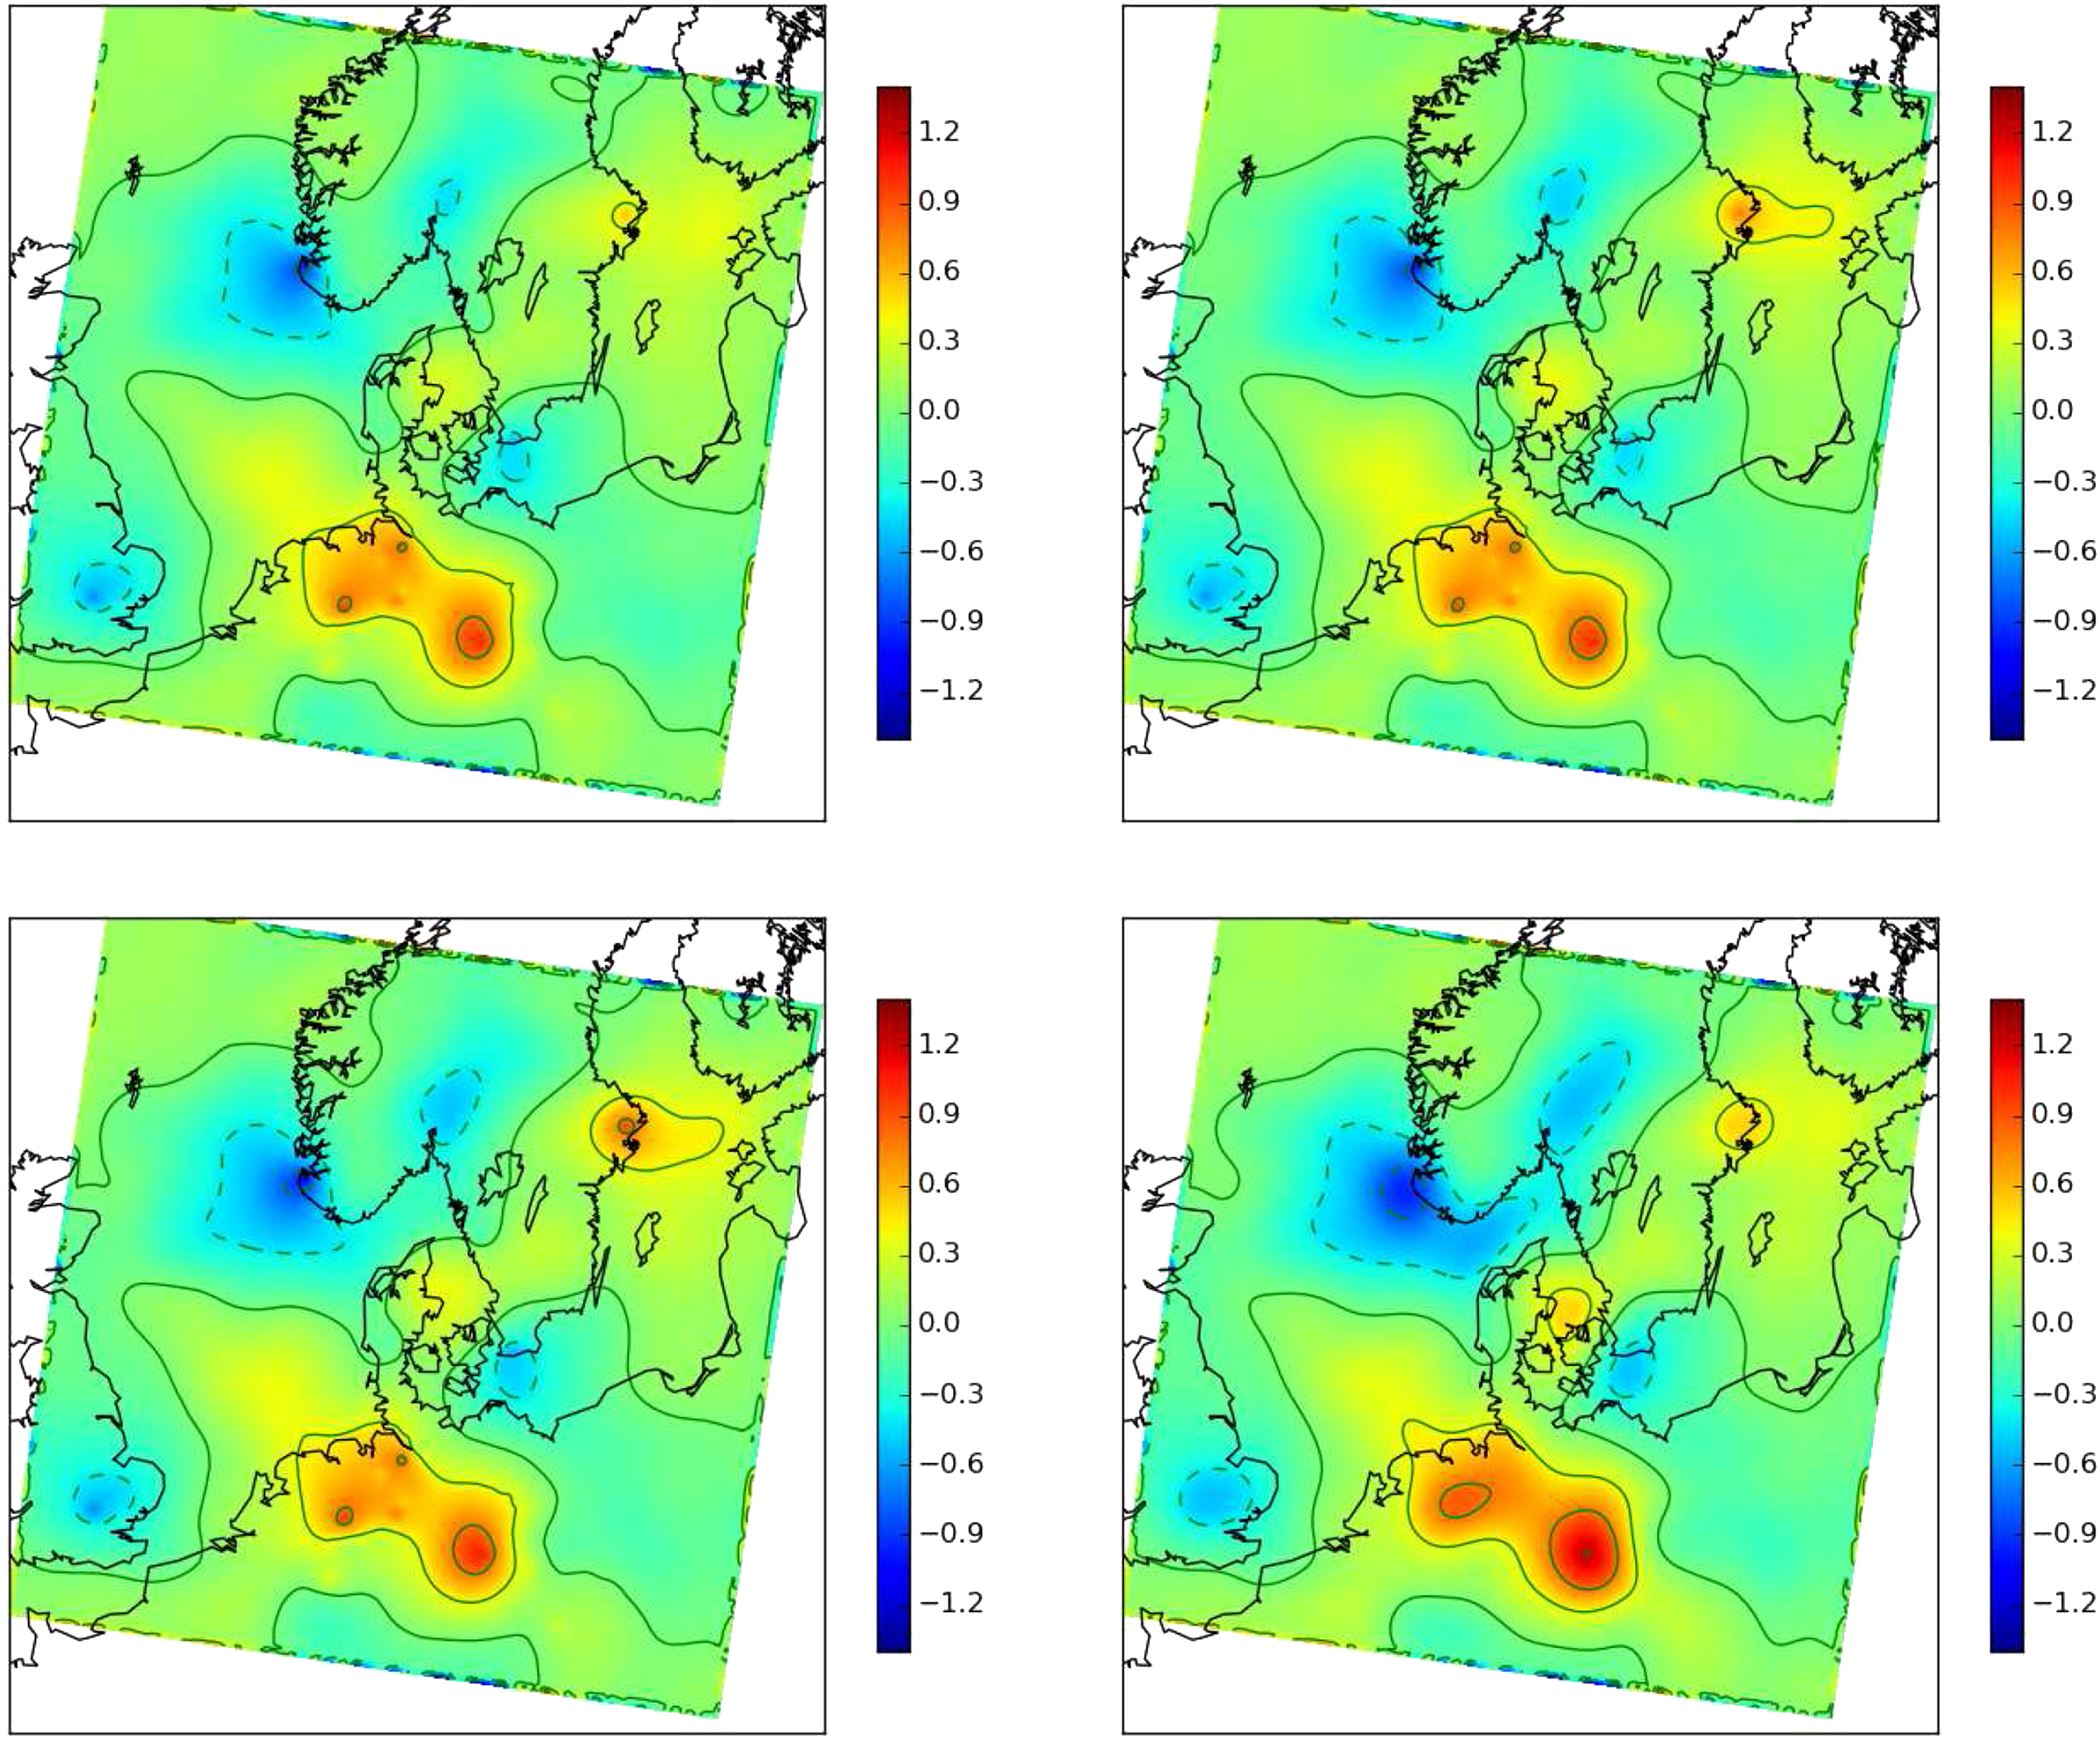
Fig. 16.
Temperature analysis increment at model level 47 obtained from the original (upper left) and from the restricted data assimilation schemes: cntr100 (upper right), cntr50 (lower left) and cntr10 (lower right). The analysis increment is valid on the 2 July 2016 06 UTC.
Table 2.
Three weeks average of Bias and RMSE scores for surface pressure forecasts from cntr and cntr100 (top), cntr50 and cntr10 (bottom) experiments as a function of forecast lead time. Red colour denotes scores that are improved by restricting the analysis increment to a low horizontal resolution.
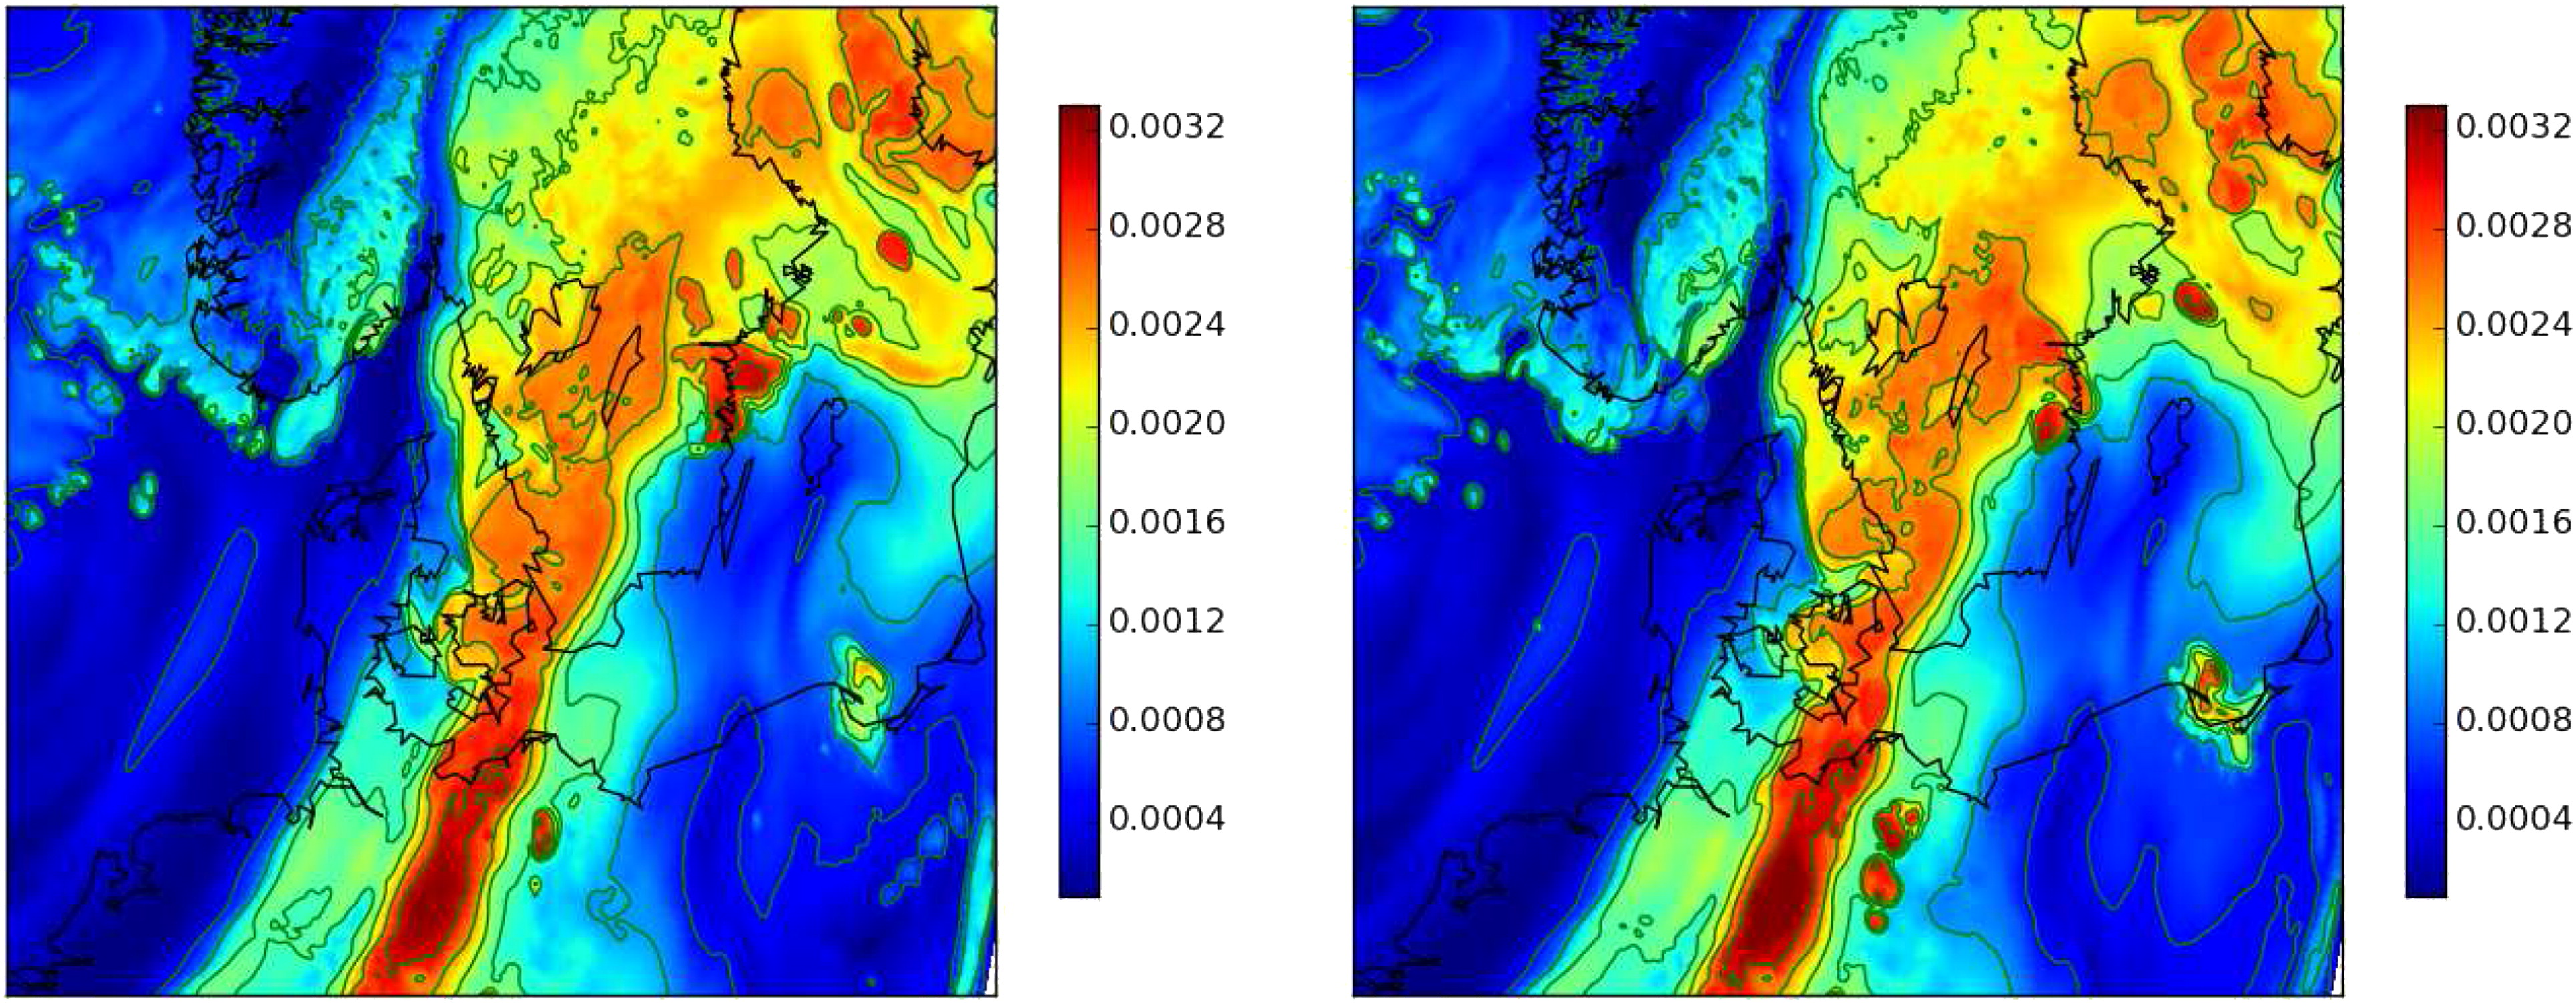
Fig. 17.
The analysis of the specific humidity at model level 25 obtained from original (left plot) and from the restricted cntr10 (right plot) variational minimization schemes. The analysis is valid on the 2 July 2016 06UTC.
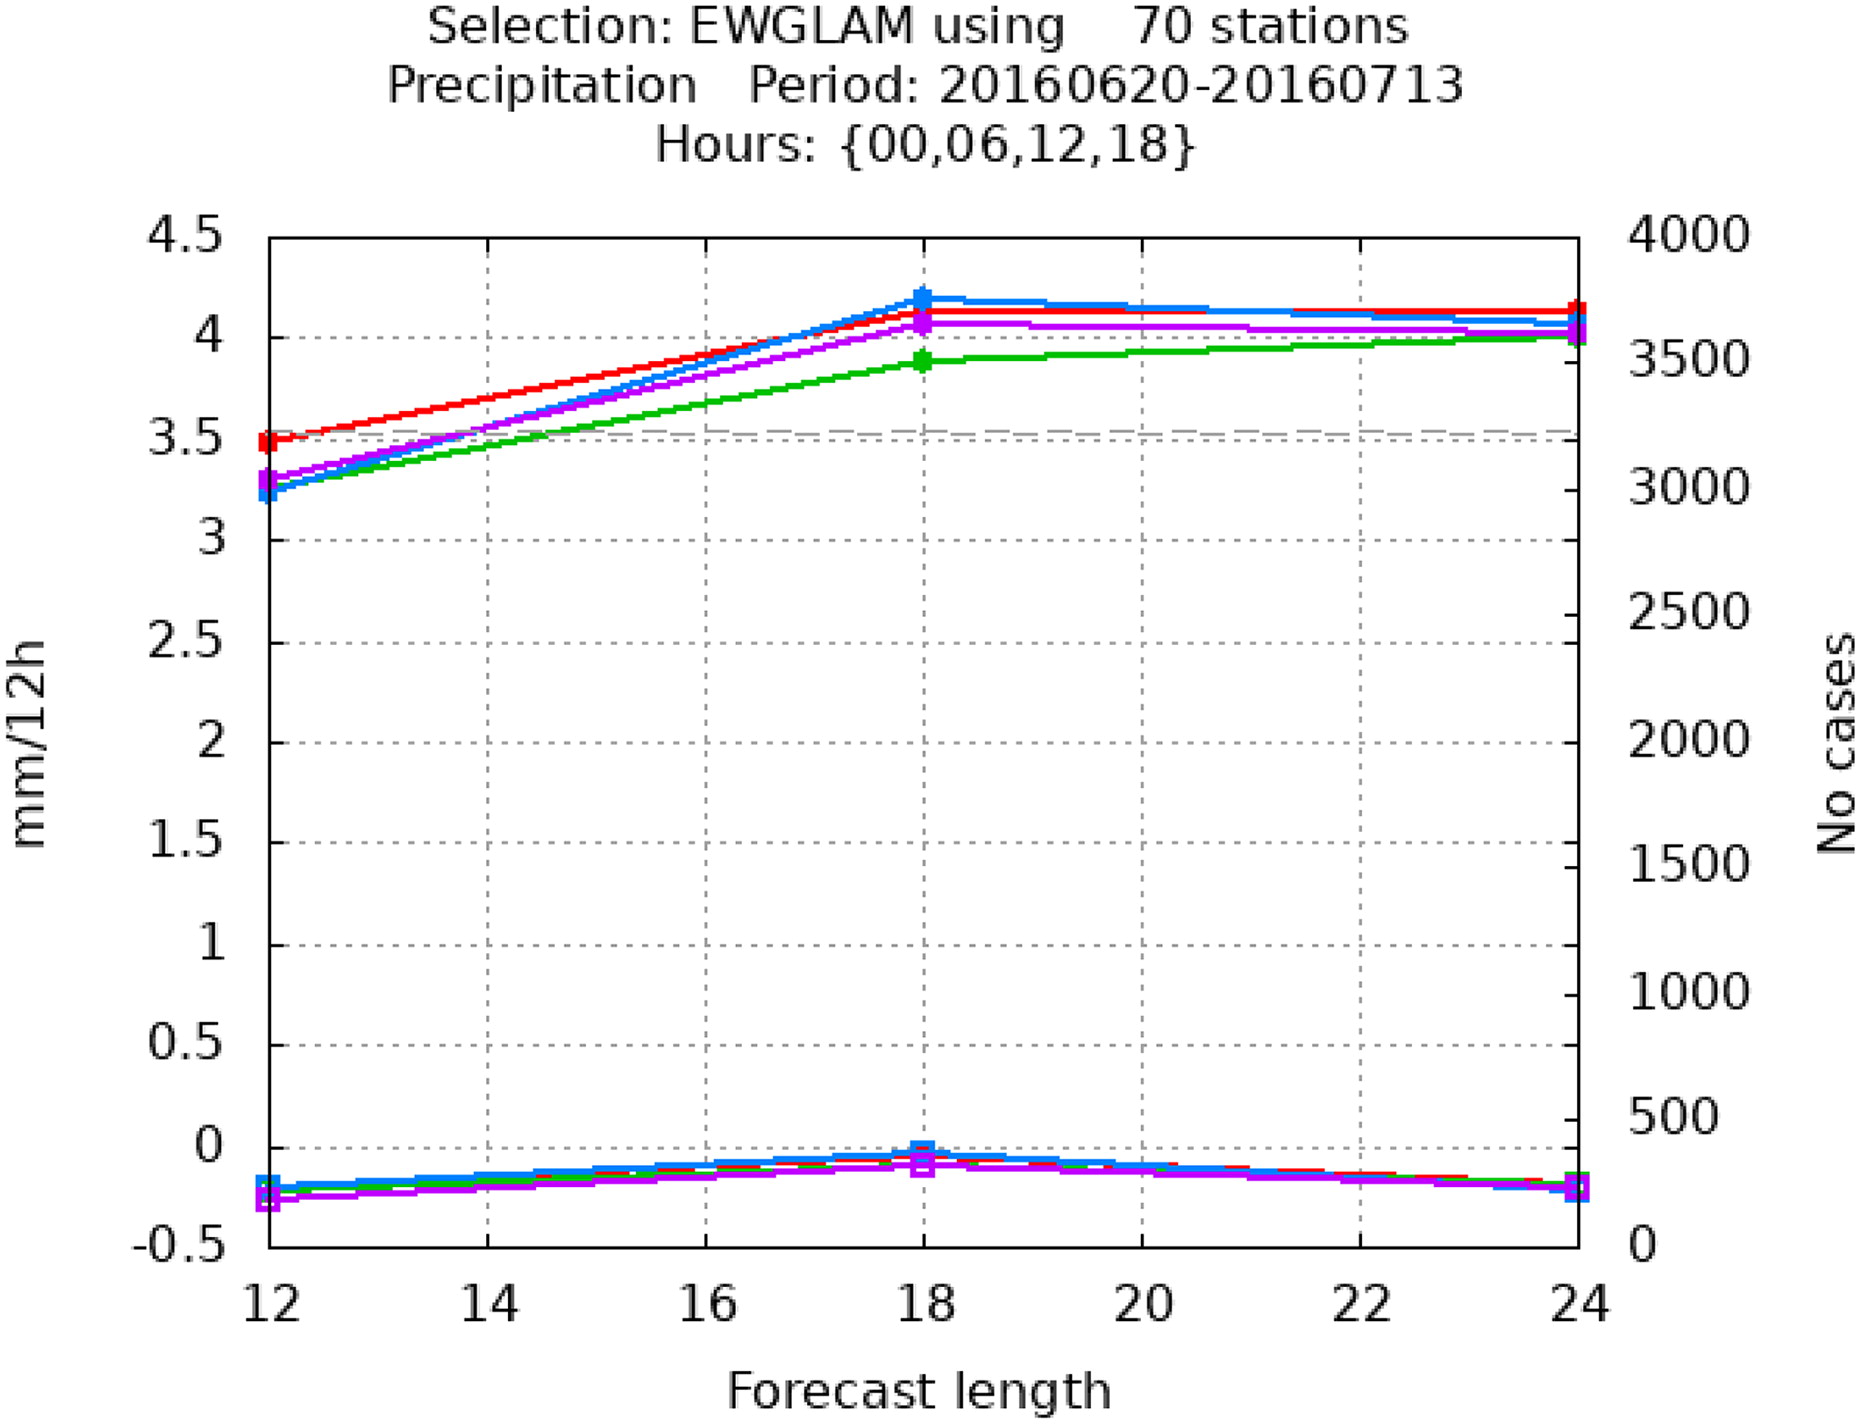
Fig. 18.
Time and domain averaged Bias and RMSE scores of 12 h accumulated precipitation for cntr (red), cntr100 (green), cntr50 (blue) and cntr10 (magenta) experiments as a function of forecast lead time. The dashed line shows the number of cases used in verification.
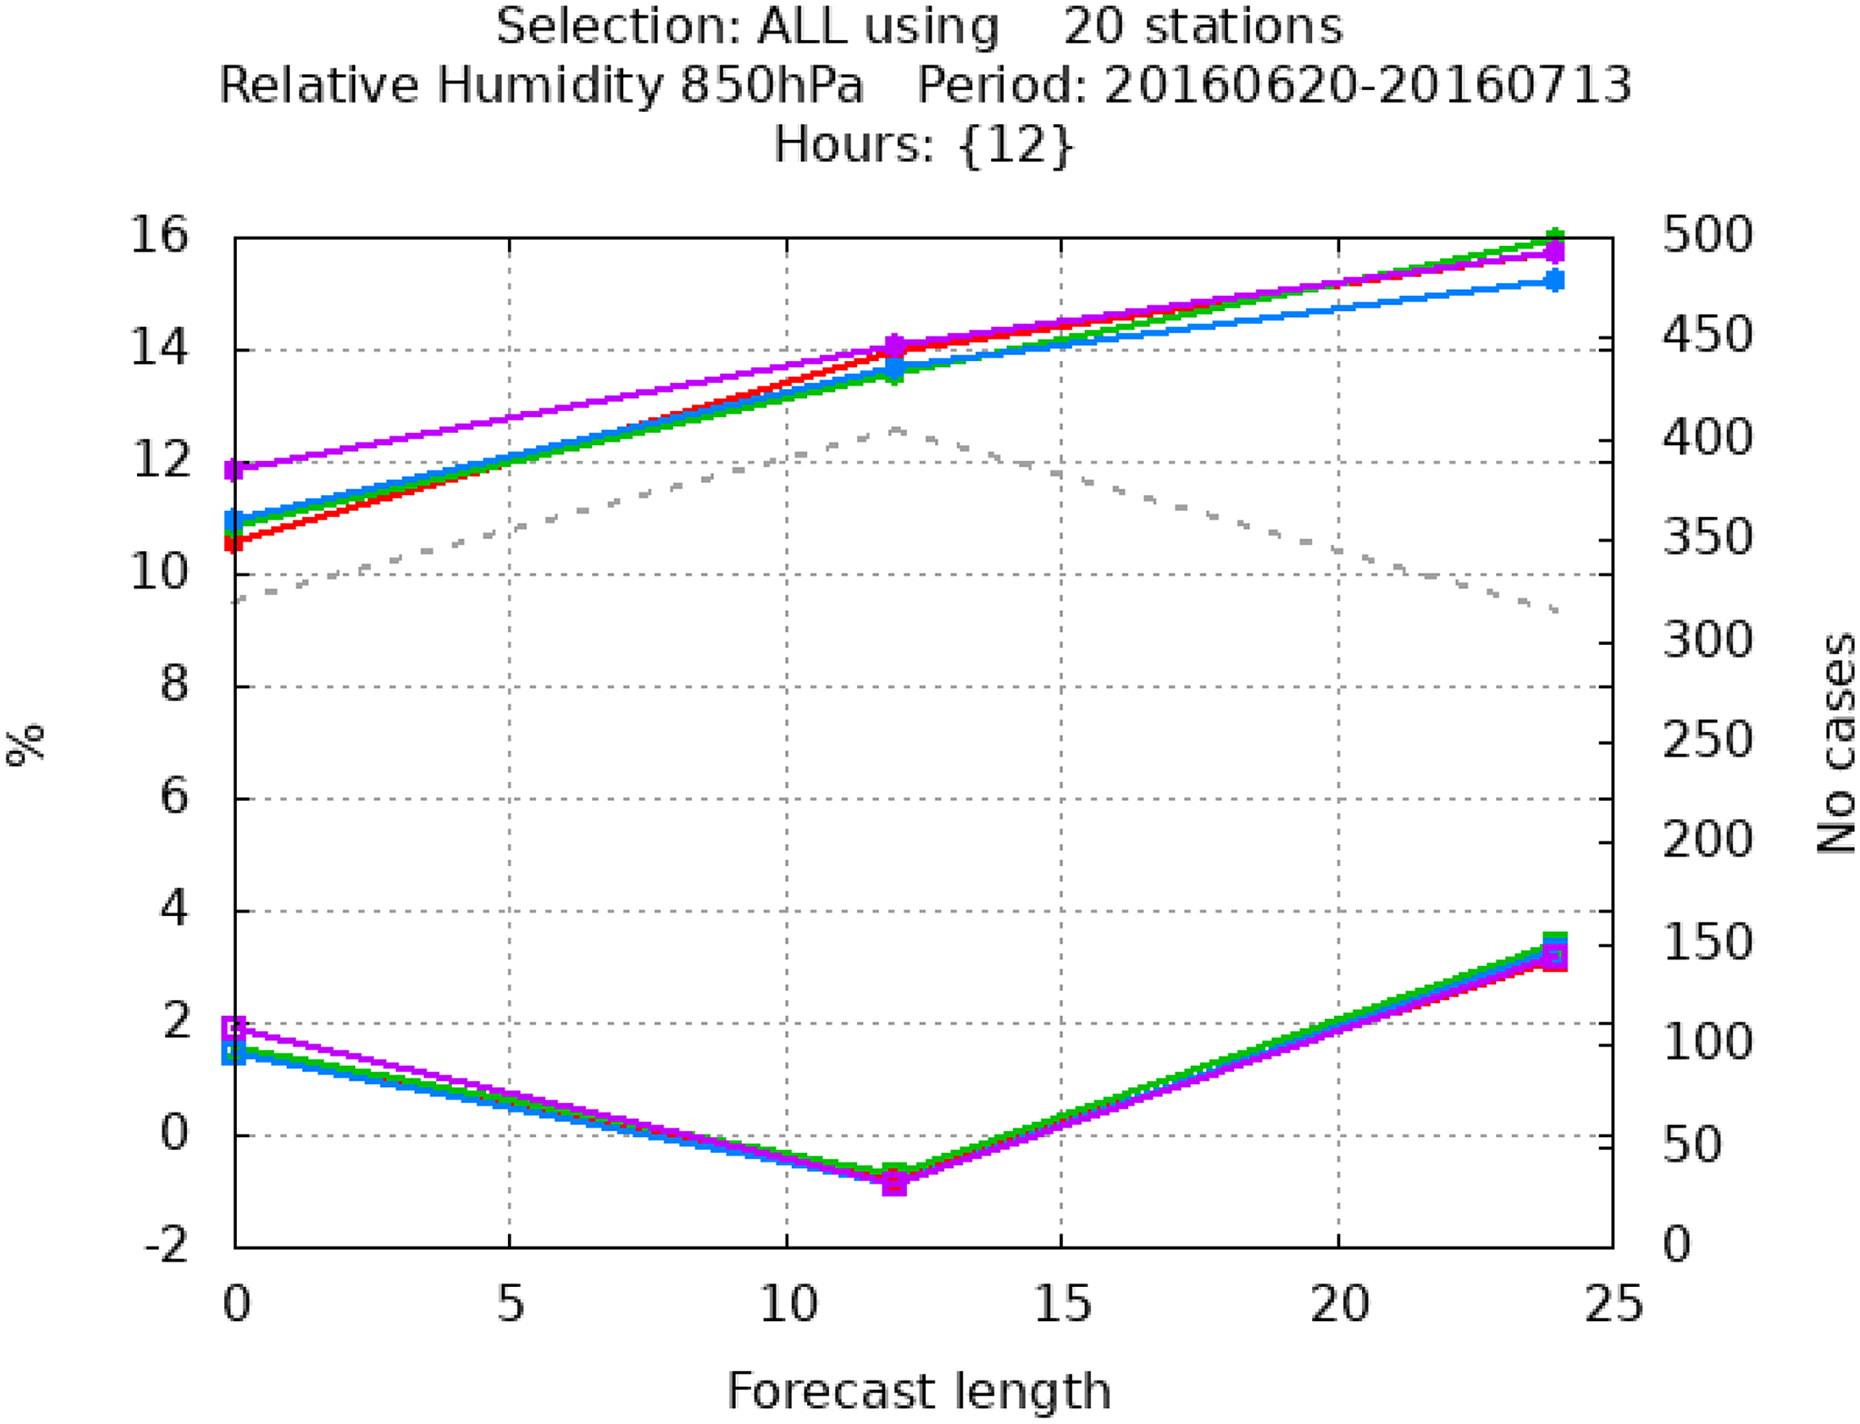
Fig. 19.
Time and domain averaged Bias and RMSE scores of RH at 850 hPa level for cntr (red), cntr100 (green), cntr50 (blue) and cntr10 (magenta) experiments as a function of forecast lead time. The dashed line shows the number of cases used in verification.
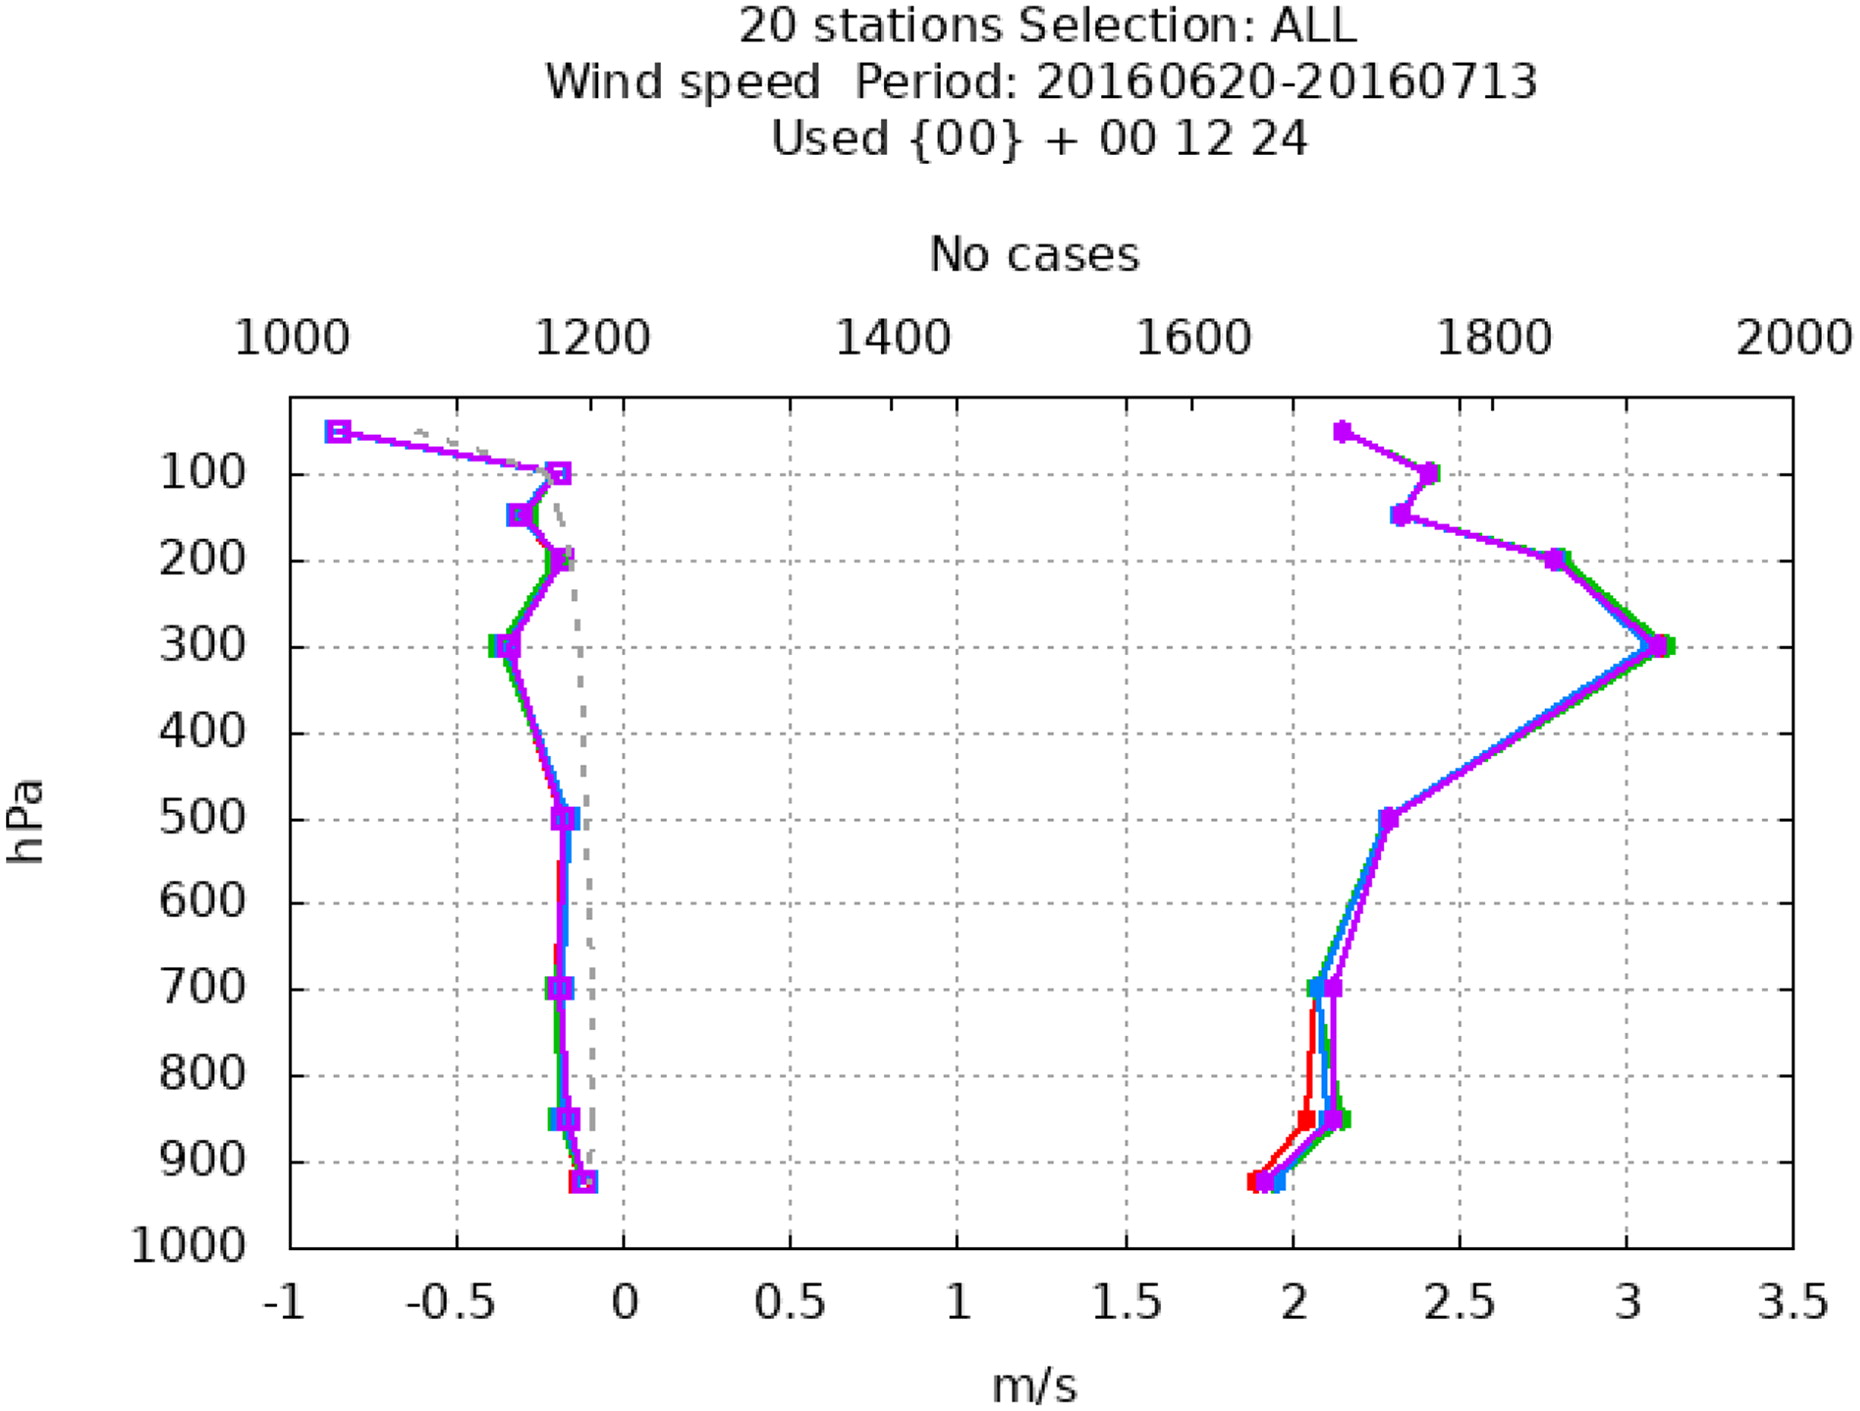
Fig. 20.
Wind field verification scores (valid at 00 UTC): Bias and RMSE scores of wind speed; cntr (red) cntr100 (green), cntr50 (blue) and cntr10 (magenta) experiments; scores are averaged over time, domain and forecast lead time. The dashed line shows the number of cases used in verification.
Table 3.
Summary of the conducted statistical balance experiments and their abbreviations. “+” sign denotes what balance operators are included in the background error covariance model for each of experiments. See eqn. (4) for an explanation of the different balance operators (H, M, N, P, Q, R, S).
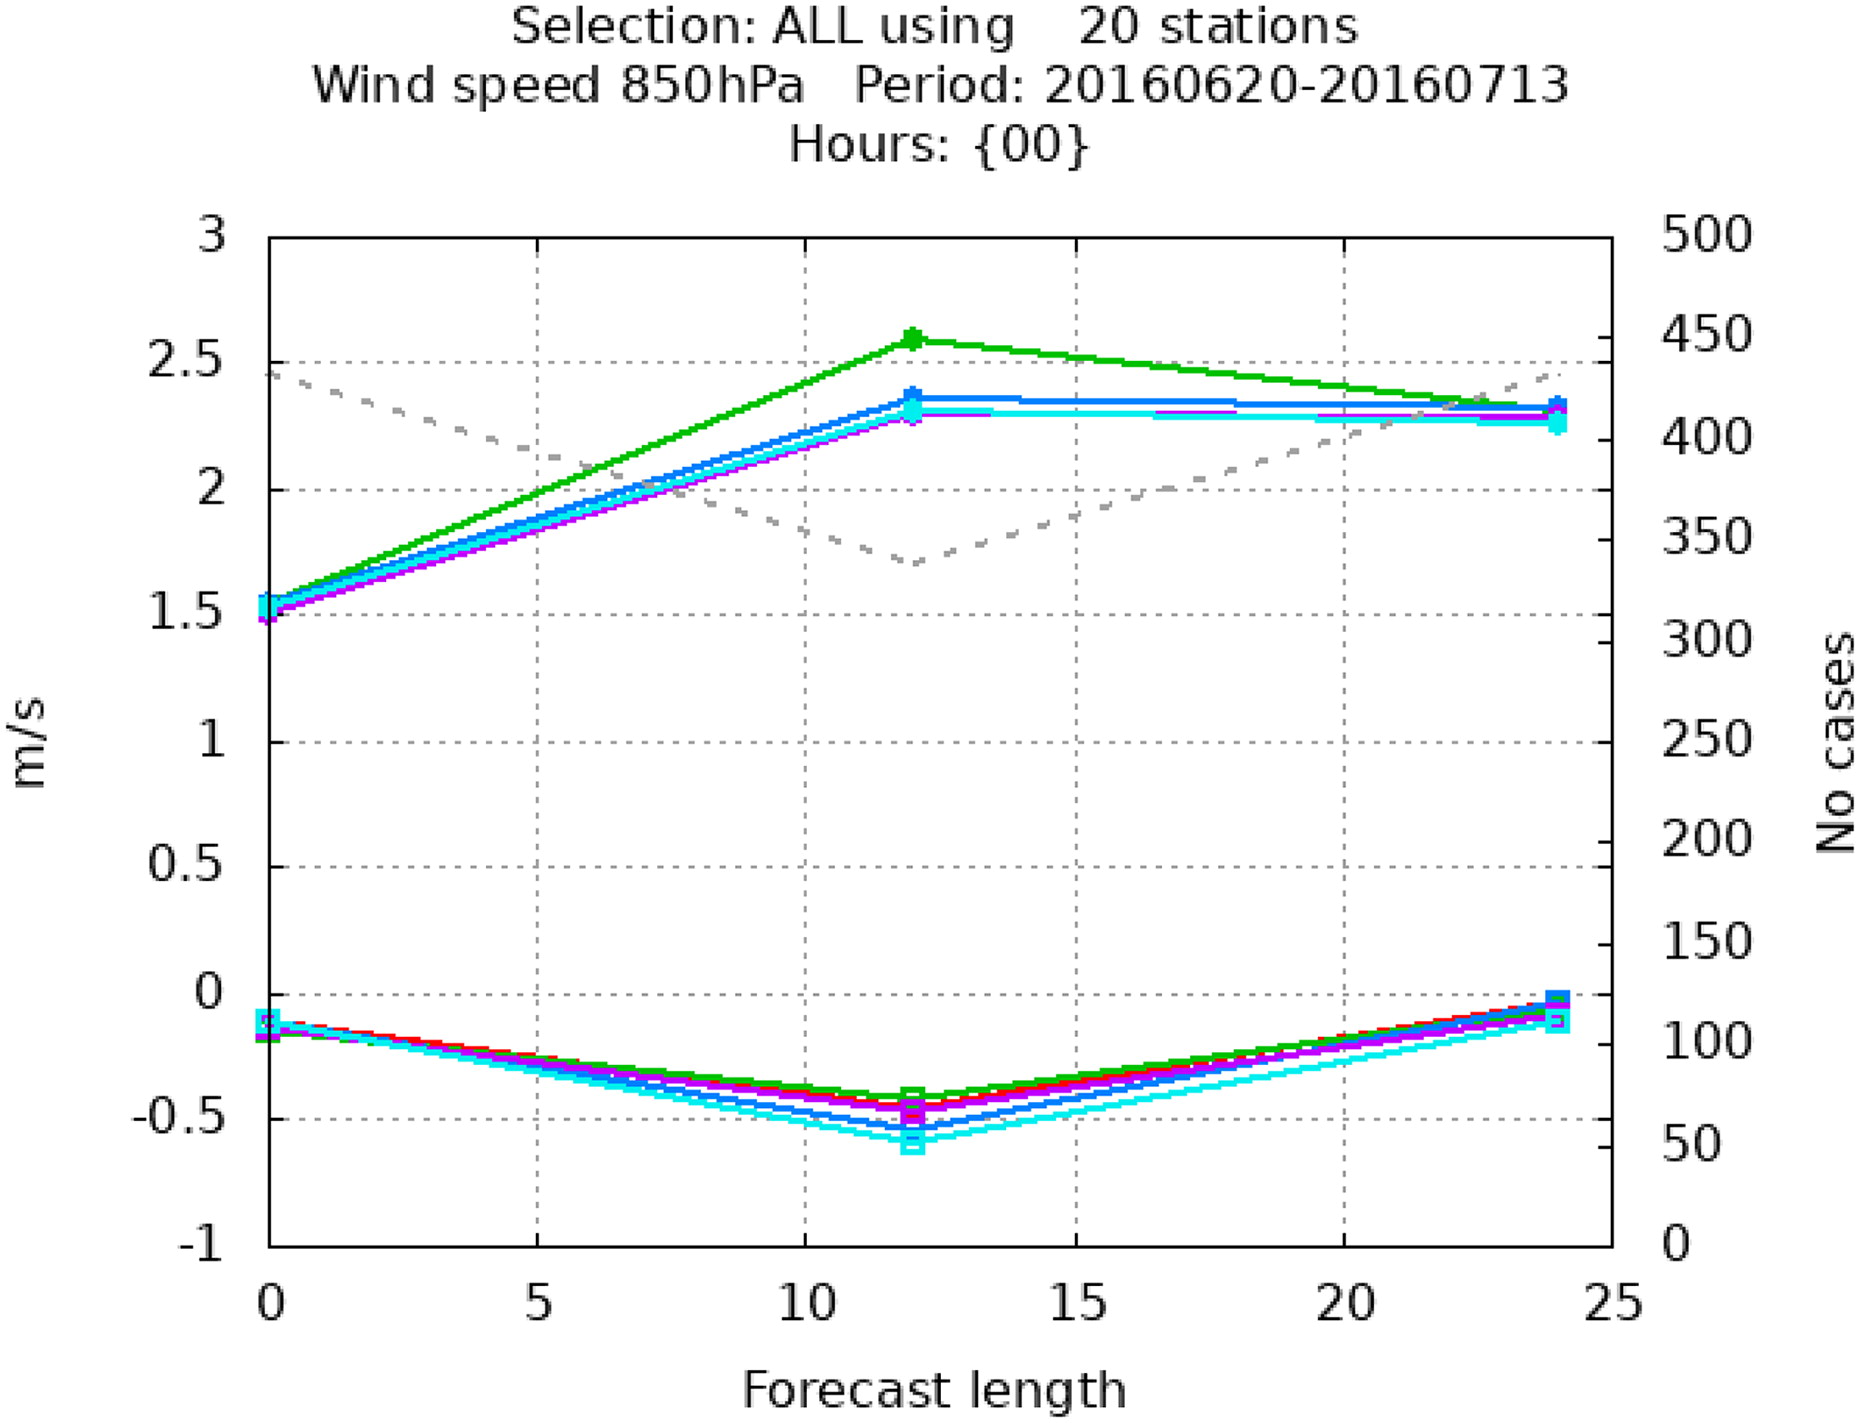
Fig. 21.
Time and domain averaged Bias and RMSE scores of wind speed at the 850 hPa level for the cntr (red), cntr100 (green), noS (blue) and noPRS (magenta) and noNPQRS (cyan) experiments as a function of forecast lead time. The dashed line shows the number of cases used in verification.
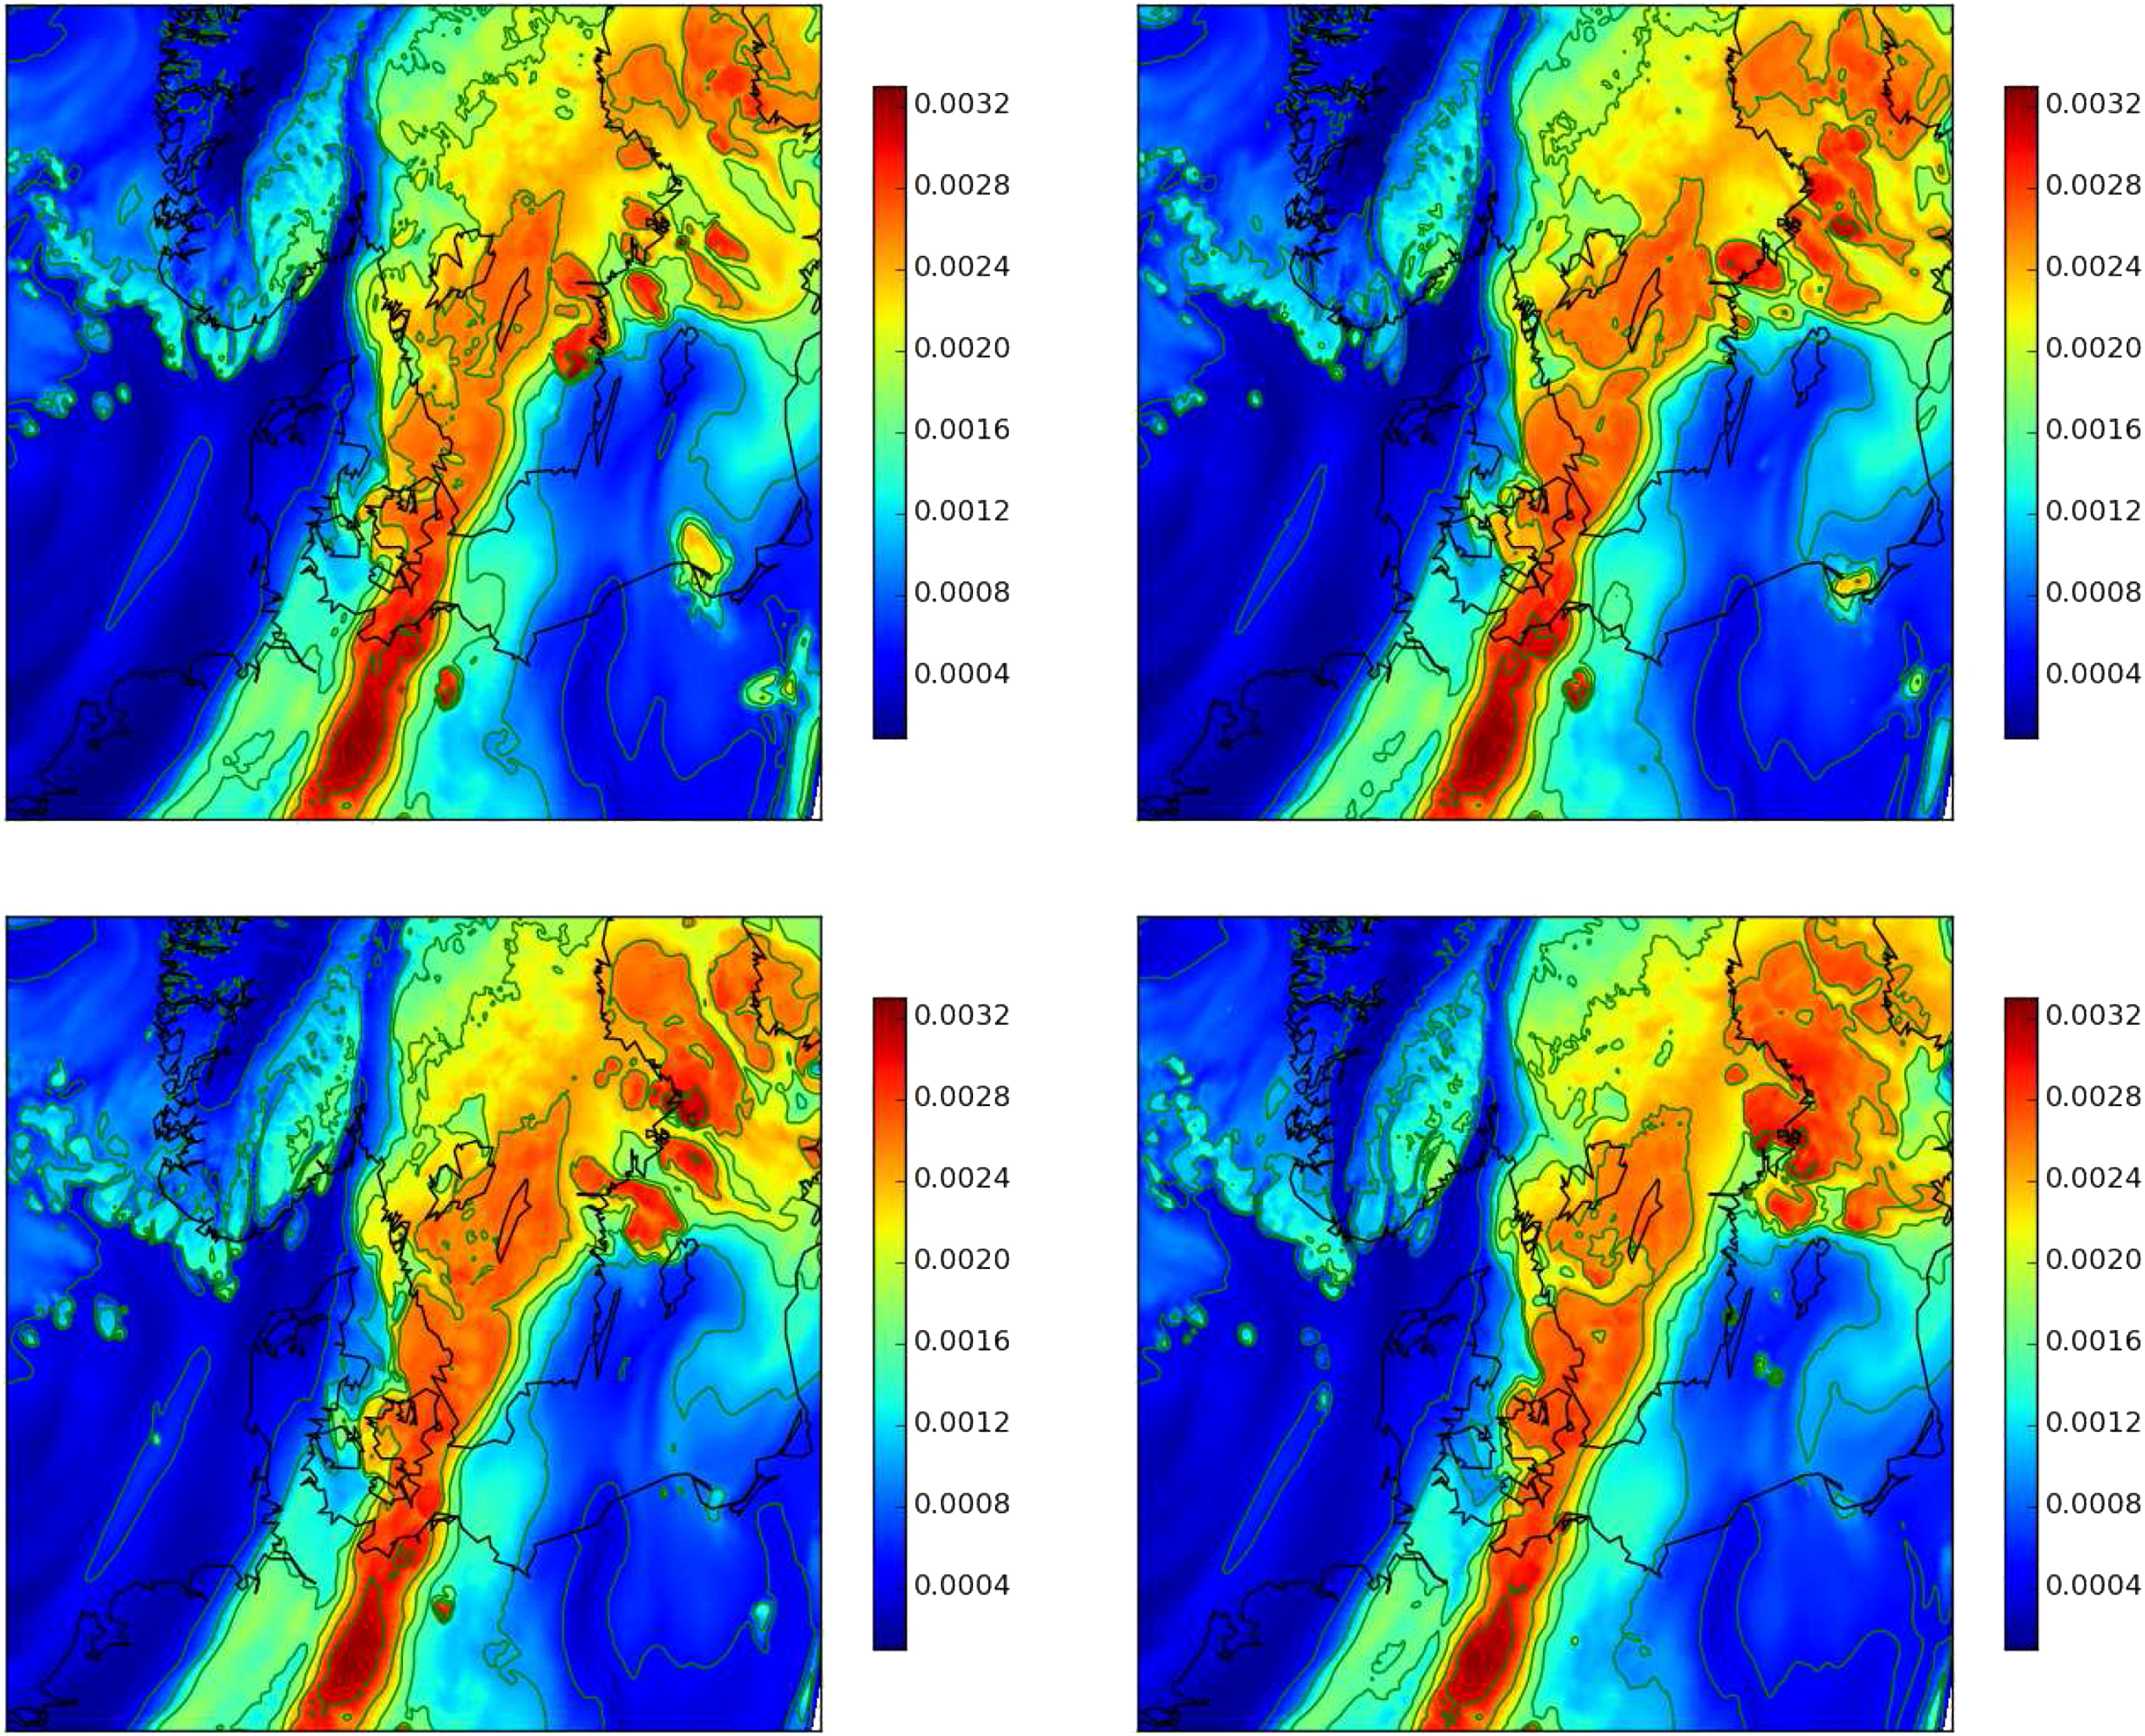
Fig. 22.
Analysis of specific humidity on the model level 25 obtained from cntr100 (upper left) and from the experiments with progressively switched balance operators (upper right), (lower left) and (lower right). The analysis is valid on the 2 July 2016 06 UTC.
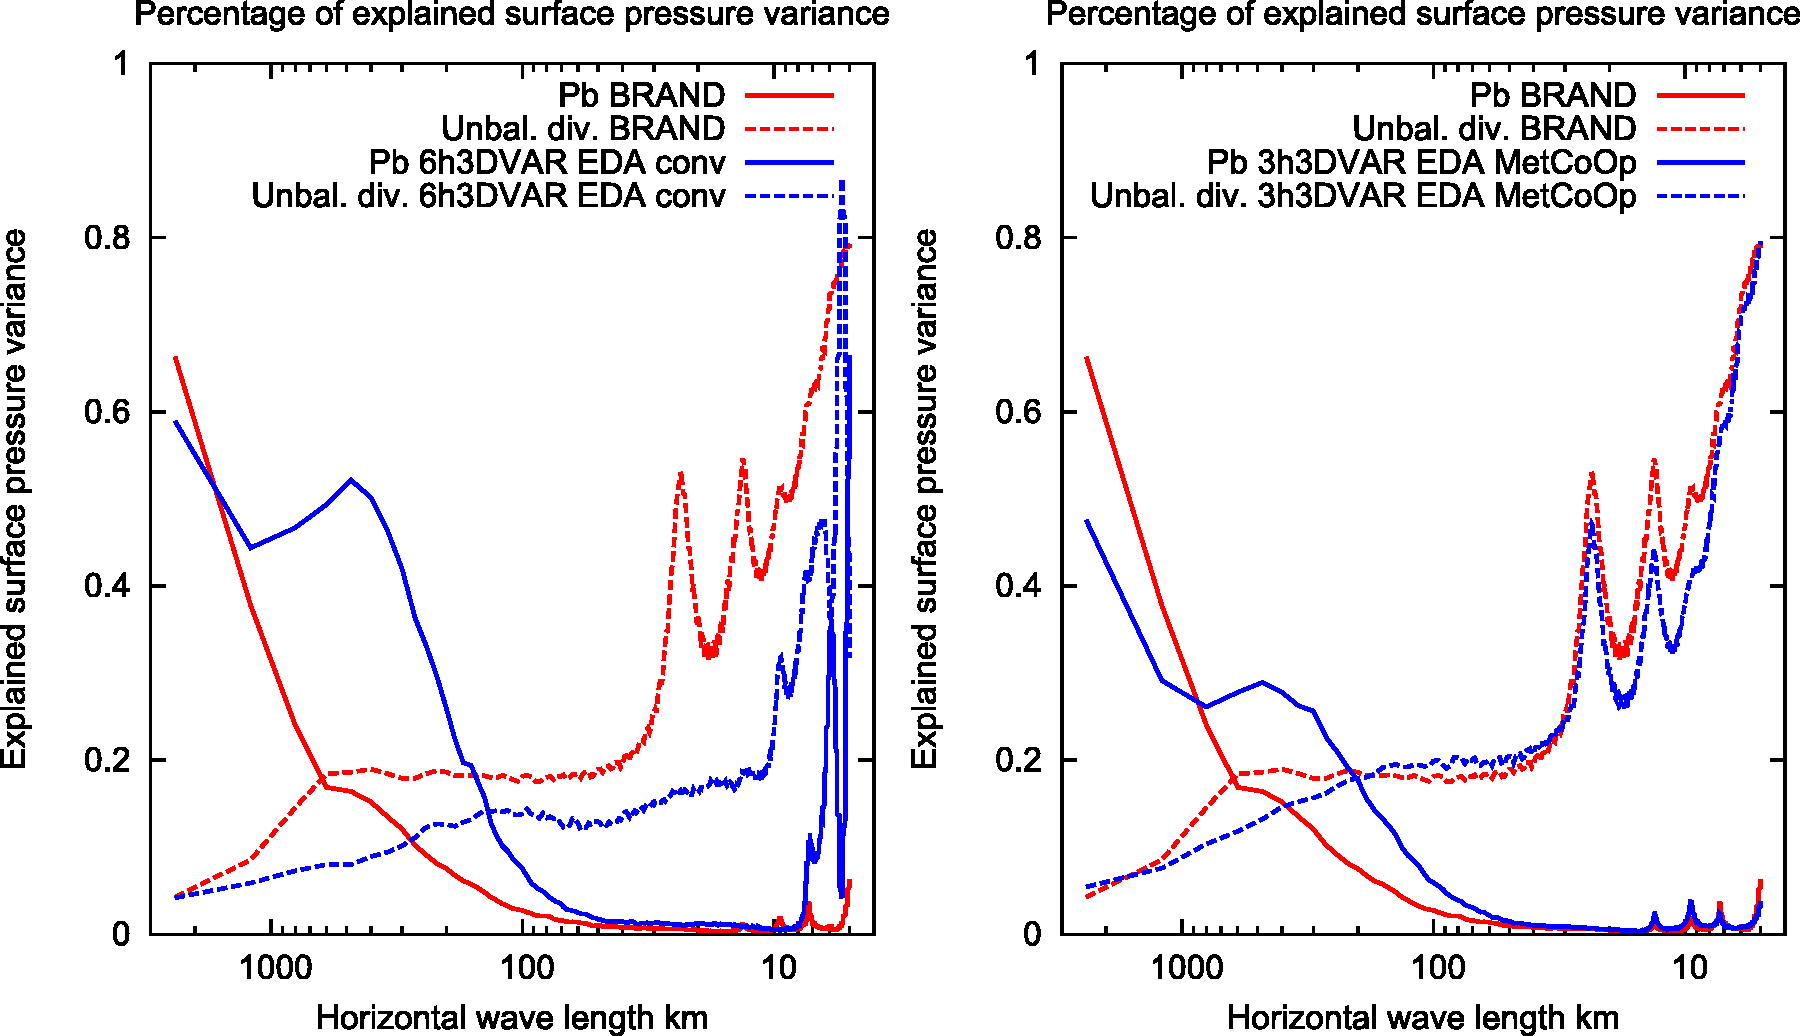
Fig. 23.
Percentage of surface pressure variance explained by vorticity and unbalanced divergence derived from the EDA (blue curves) and BRAND (red curves) ensemble sets. BRAND based structure functions are plotted against 6 h 3DVAR EDA CONV (left) and against 3 h 3DVAR EDA MetCoOP (right).