
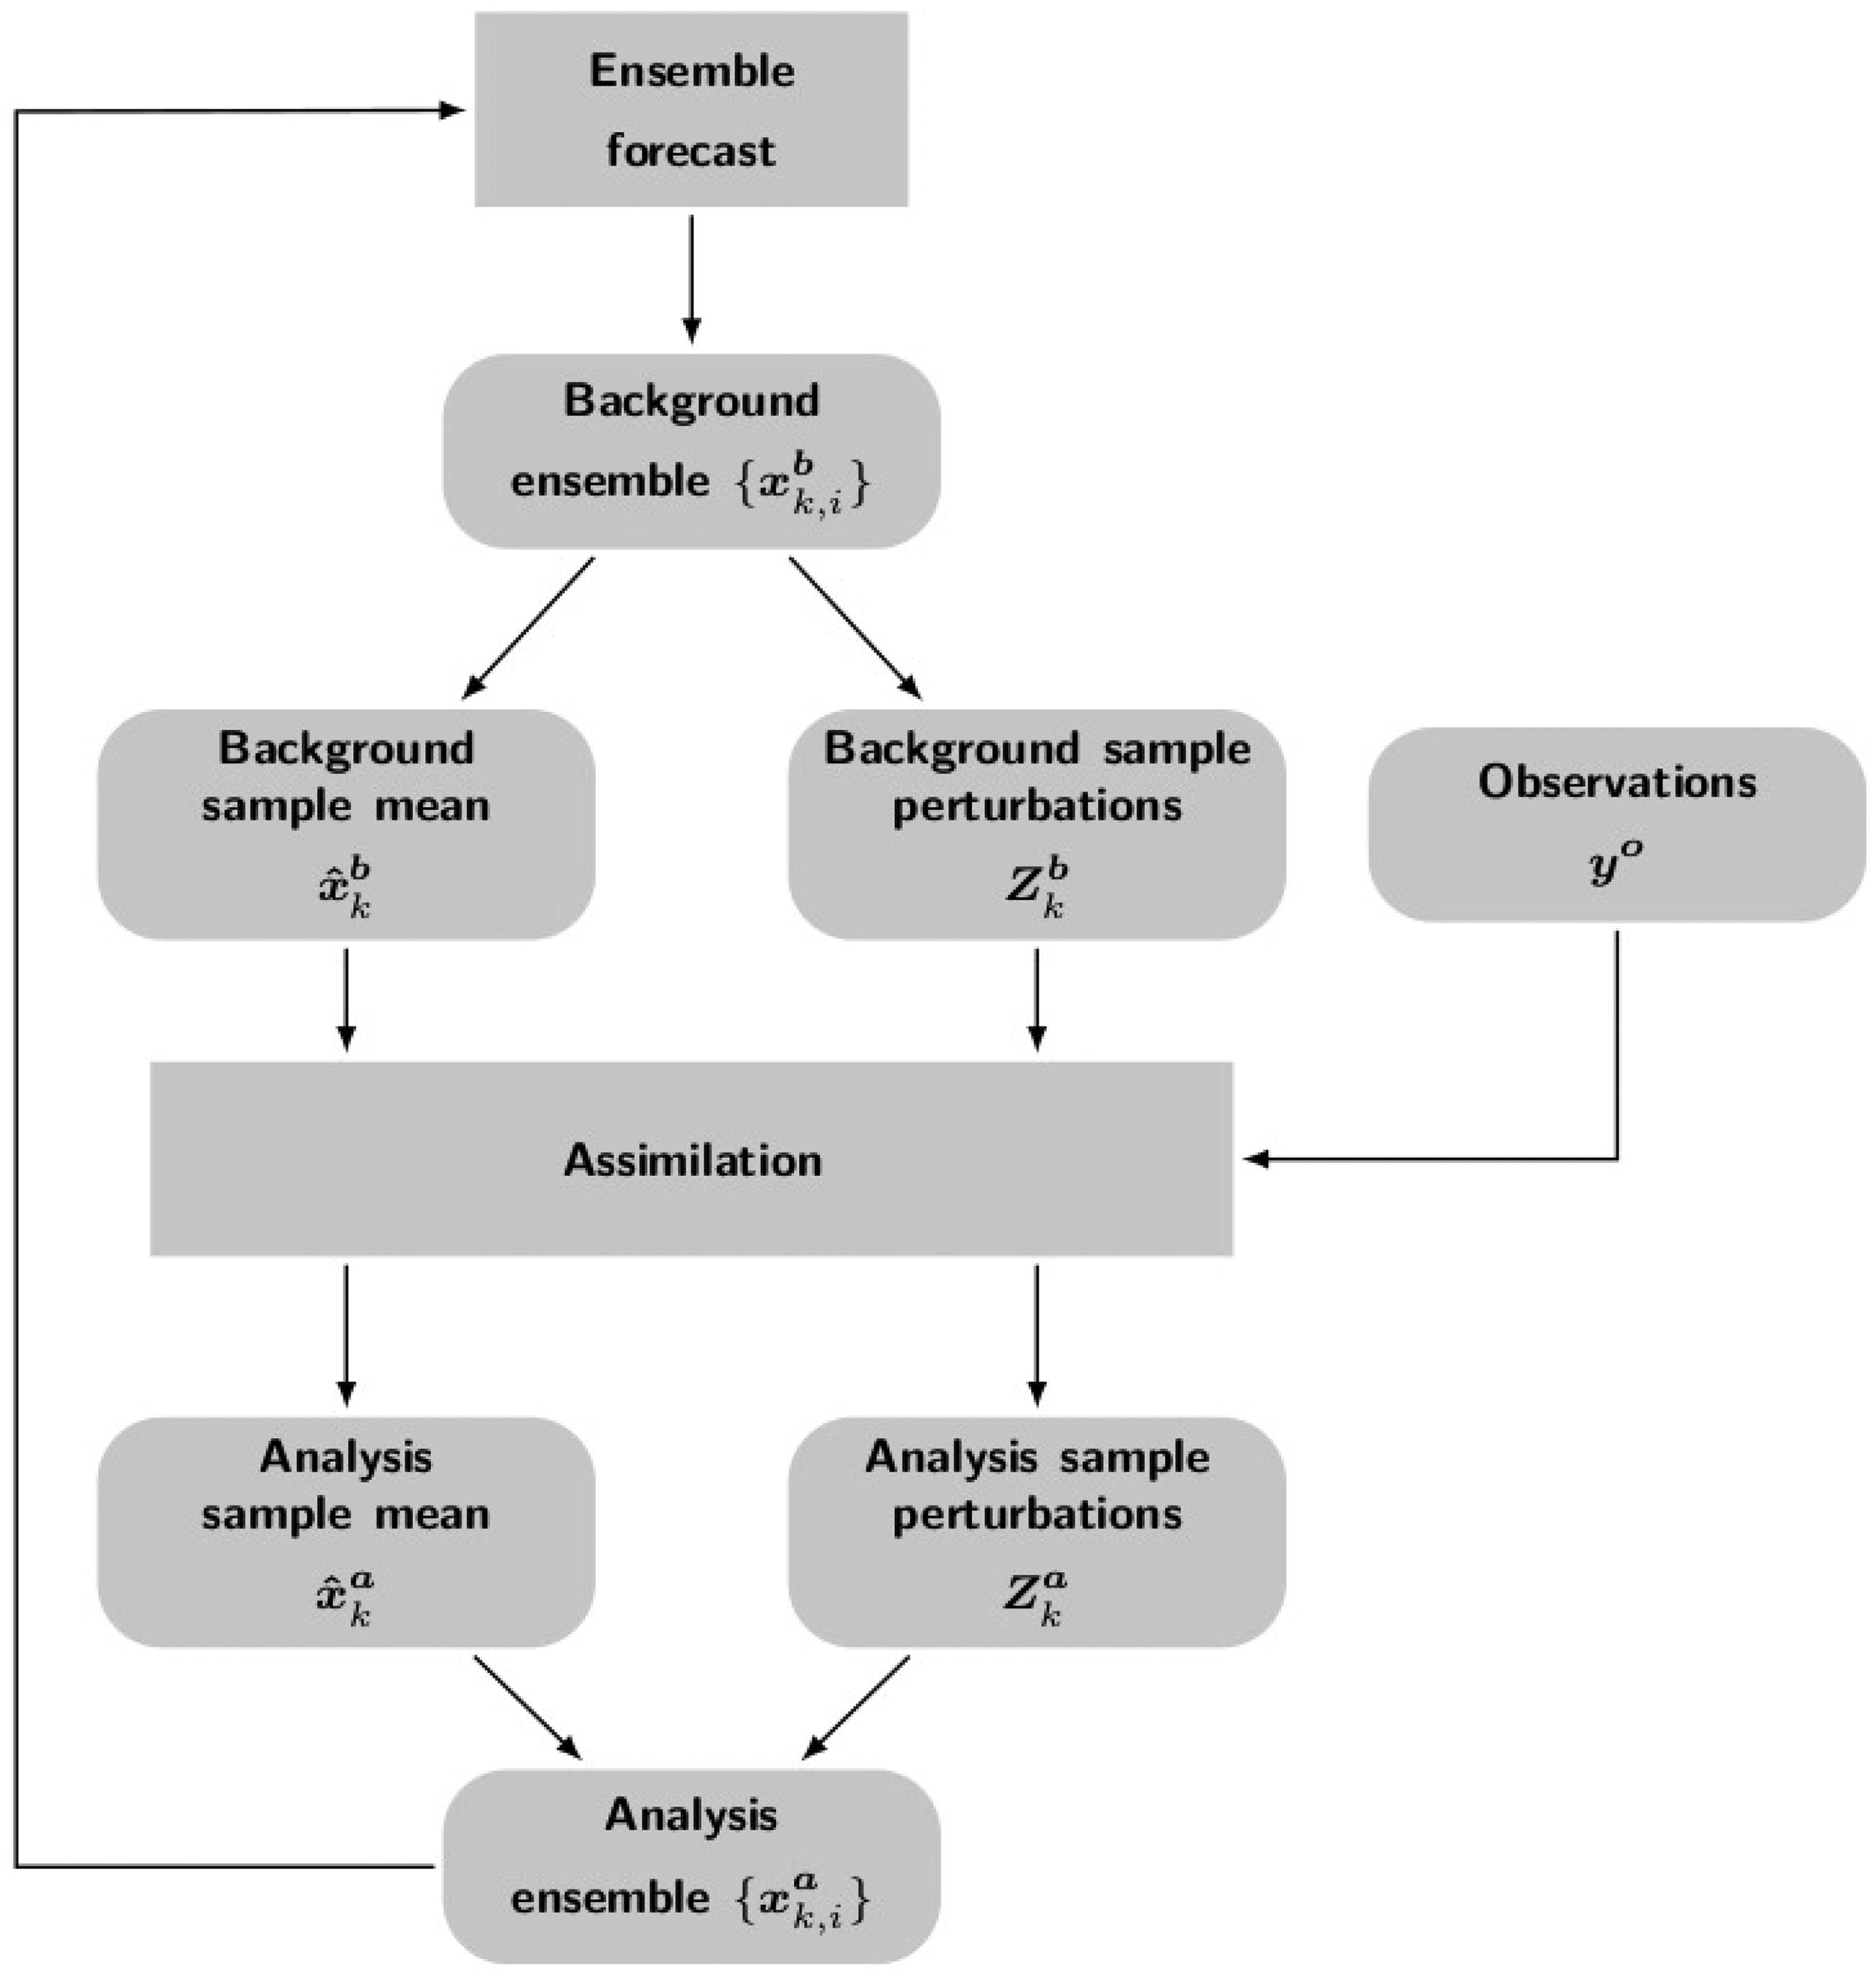
Fig. 1.
Flowchart illustrating the data assimilation cycle of the method for uncertainty estimation. Combined precipitation product and uncertainty estimate are obtained from the analysis ensemble mean and spread, respectively.
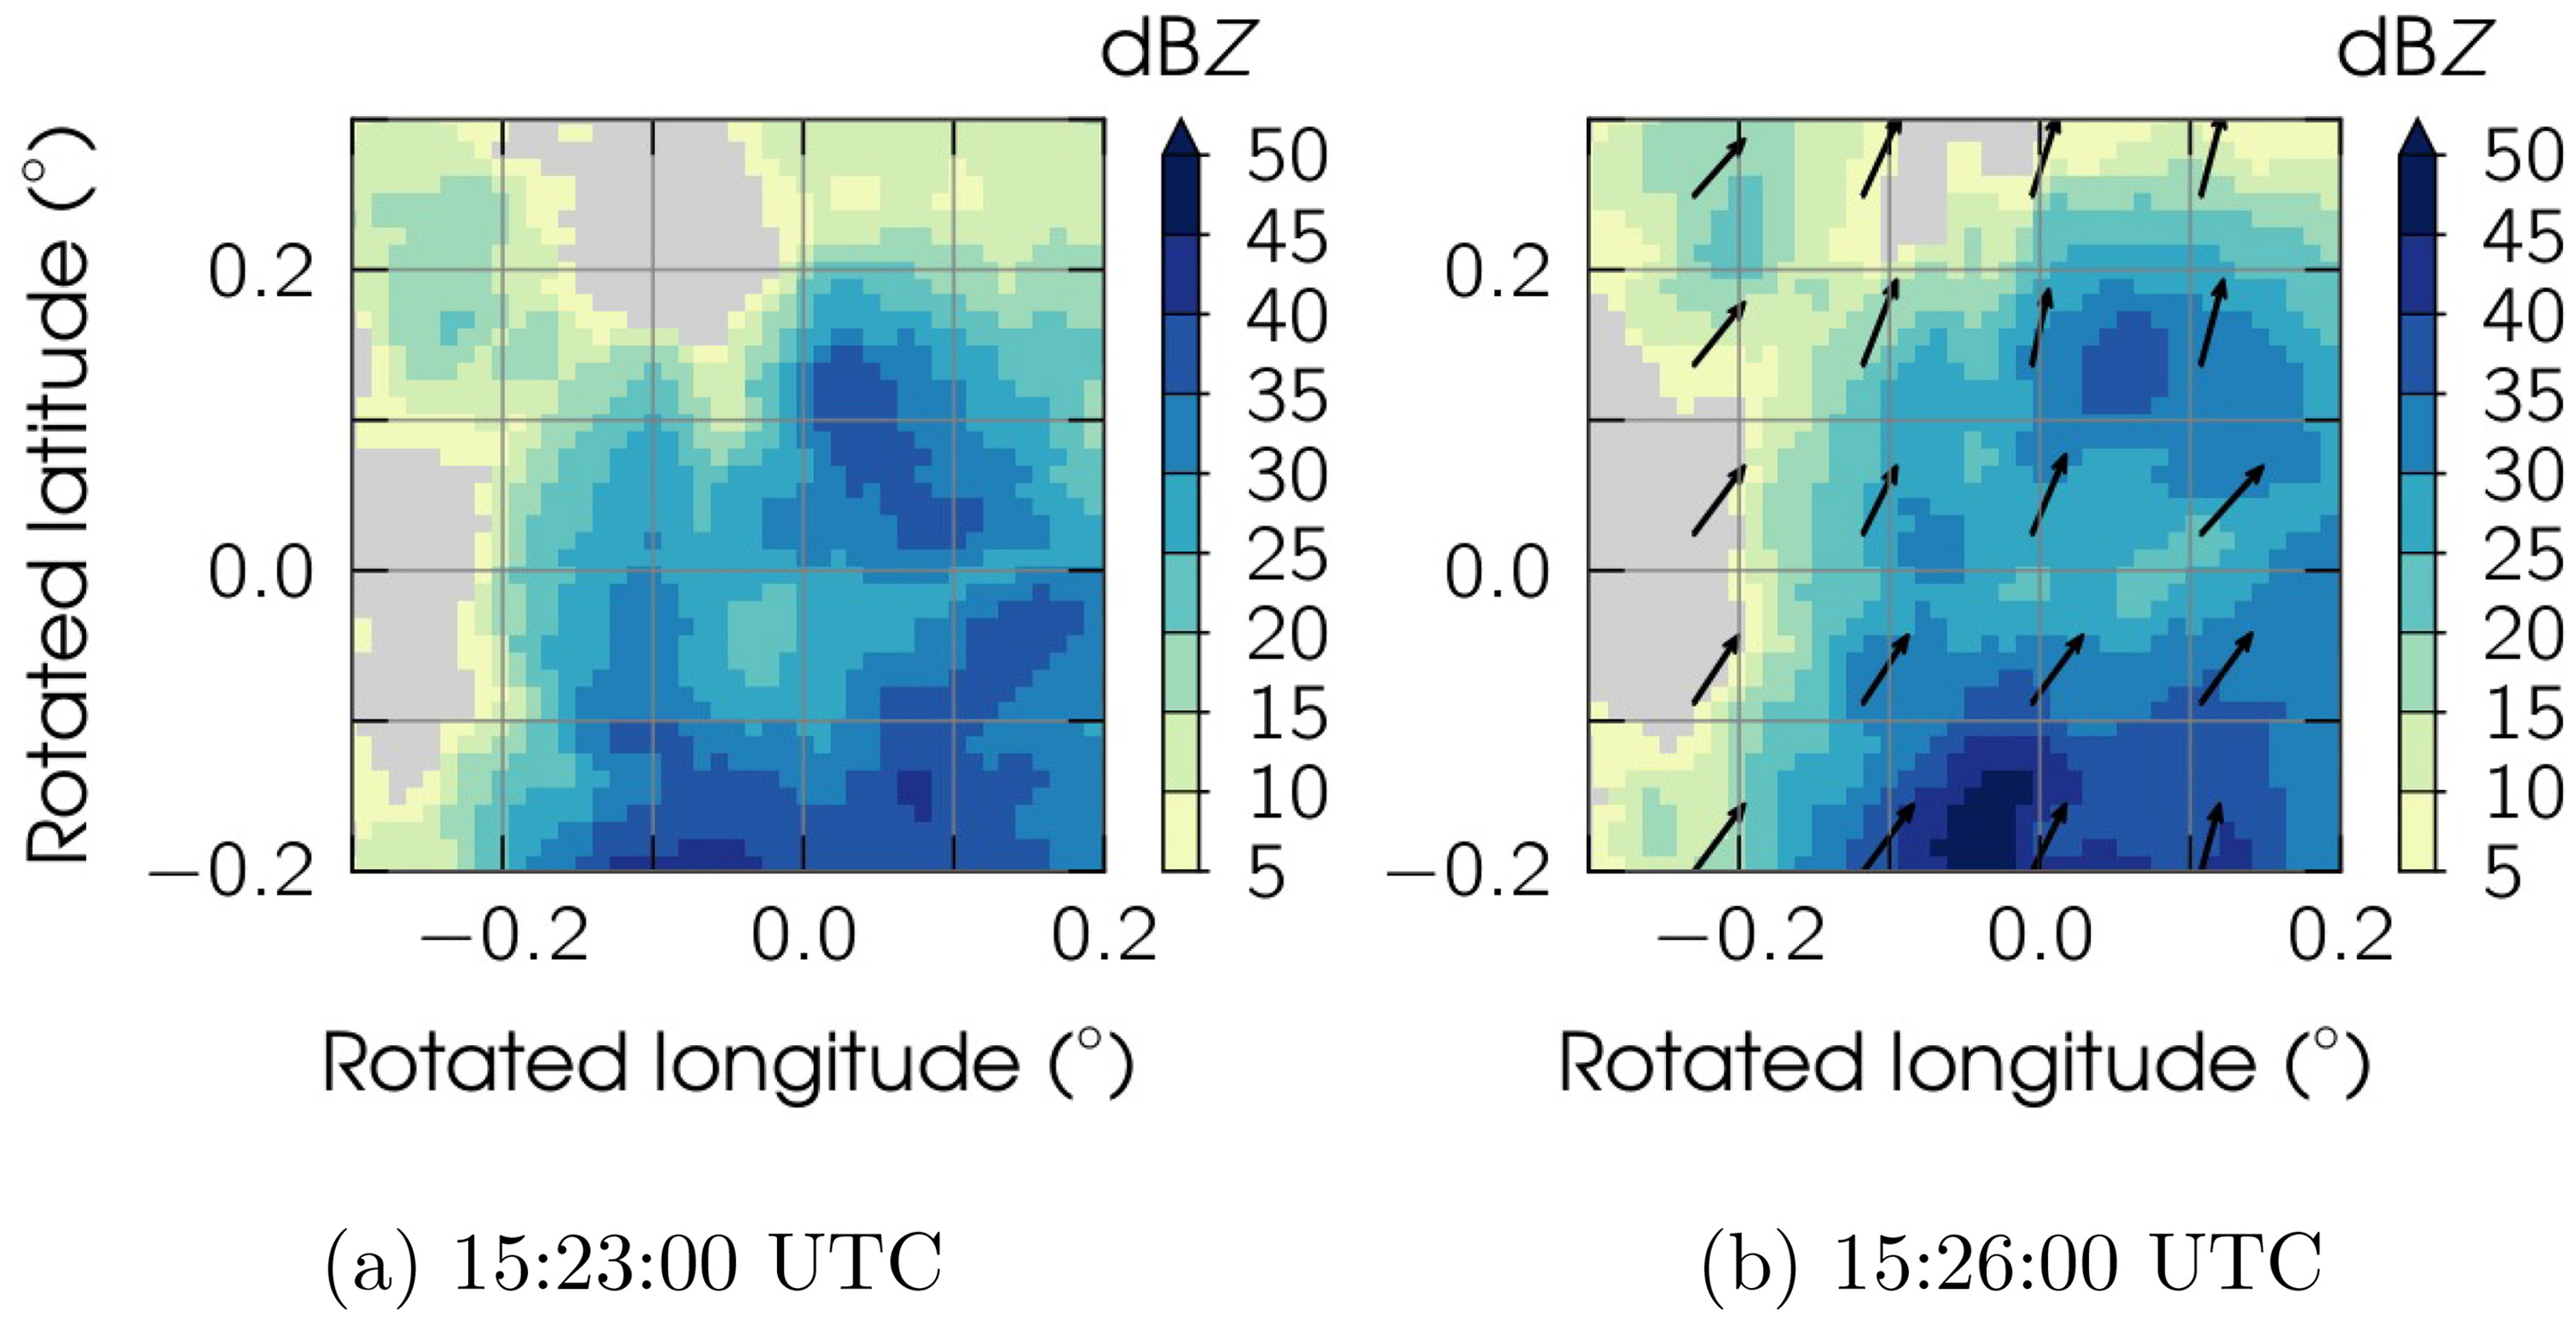
Fig. 2.
Example of input precipitation images for template-matching for the 3 July 2013. (a) 15:23:00 UTC and (b) 15:26:00 UTC and resulting displacement vector field, thinned out to every tenth pixel in each direction in this representation.
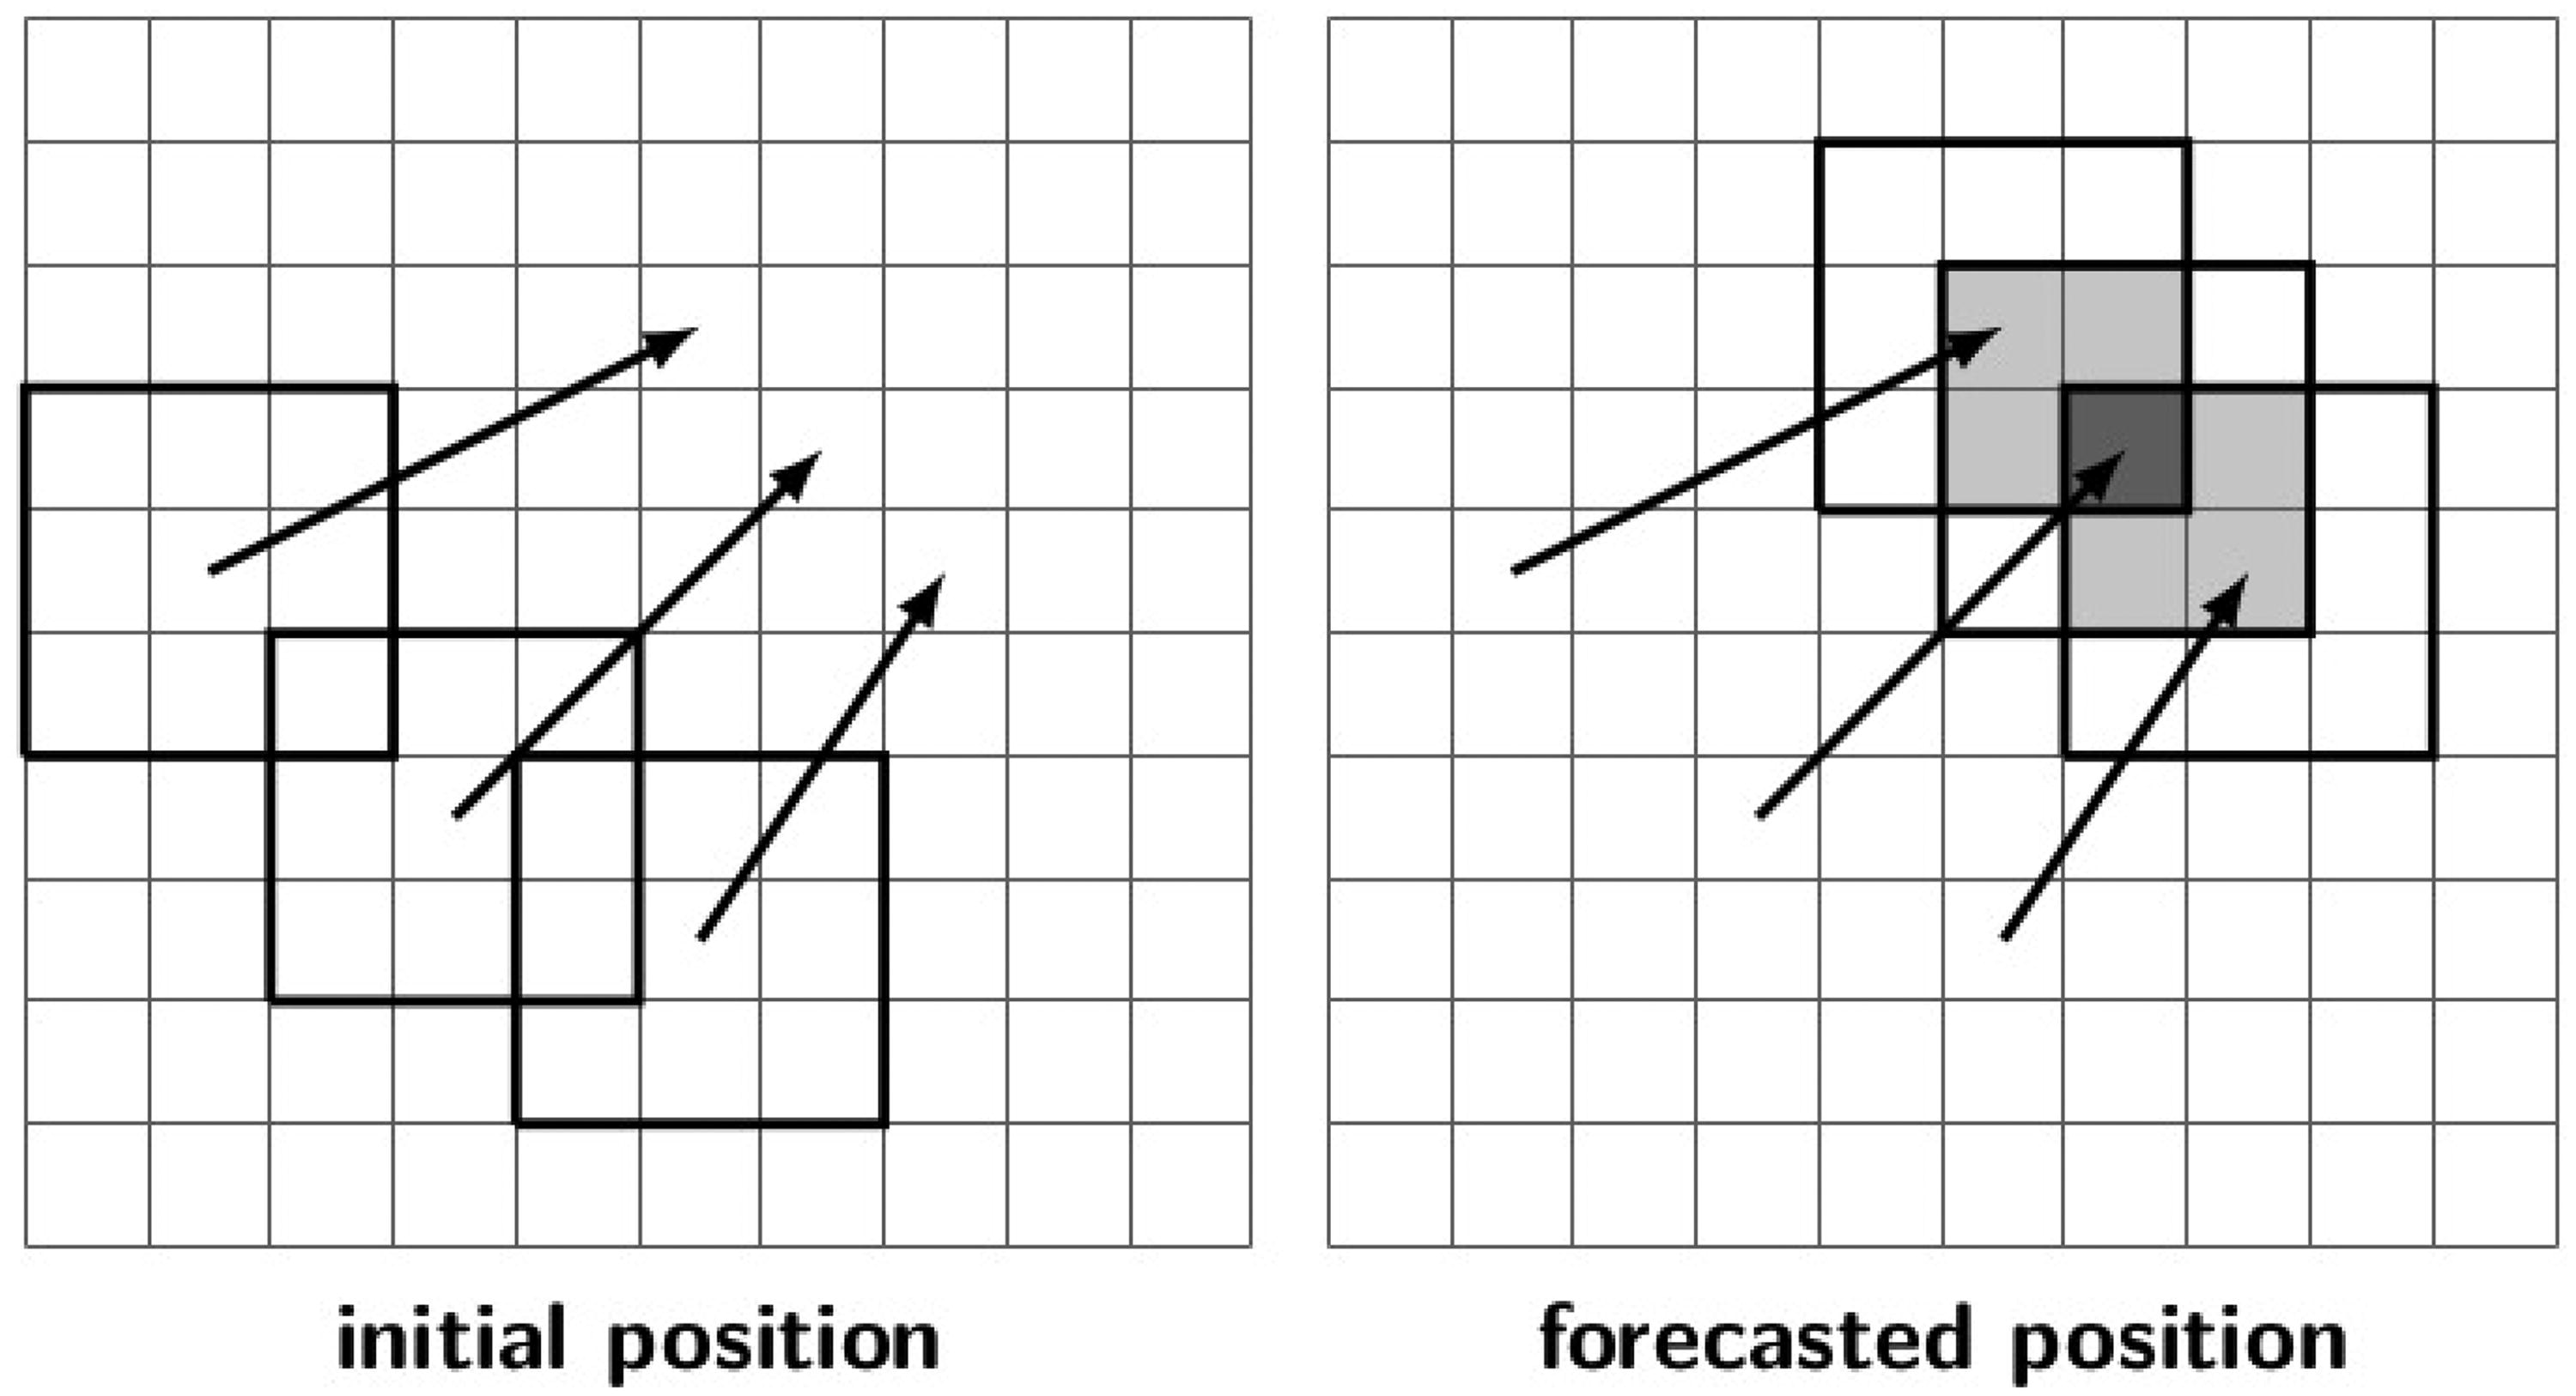
Fig. 3.
Schematic representation of the forecasting step for three pixels, exemplary. 3 × 3 windows of pixels (initial position left) are shifted according to the local motion vectors calculated for the middle pixel. If these pixel windows overlap in the forecast (new position right), pixel values (precipitation intensity or motion velocity) are averaged to get the forecasted field. In this example, light grey pixels are averages over two values, dark grey over three values.
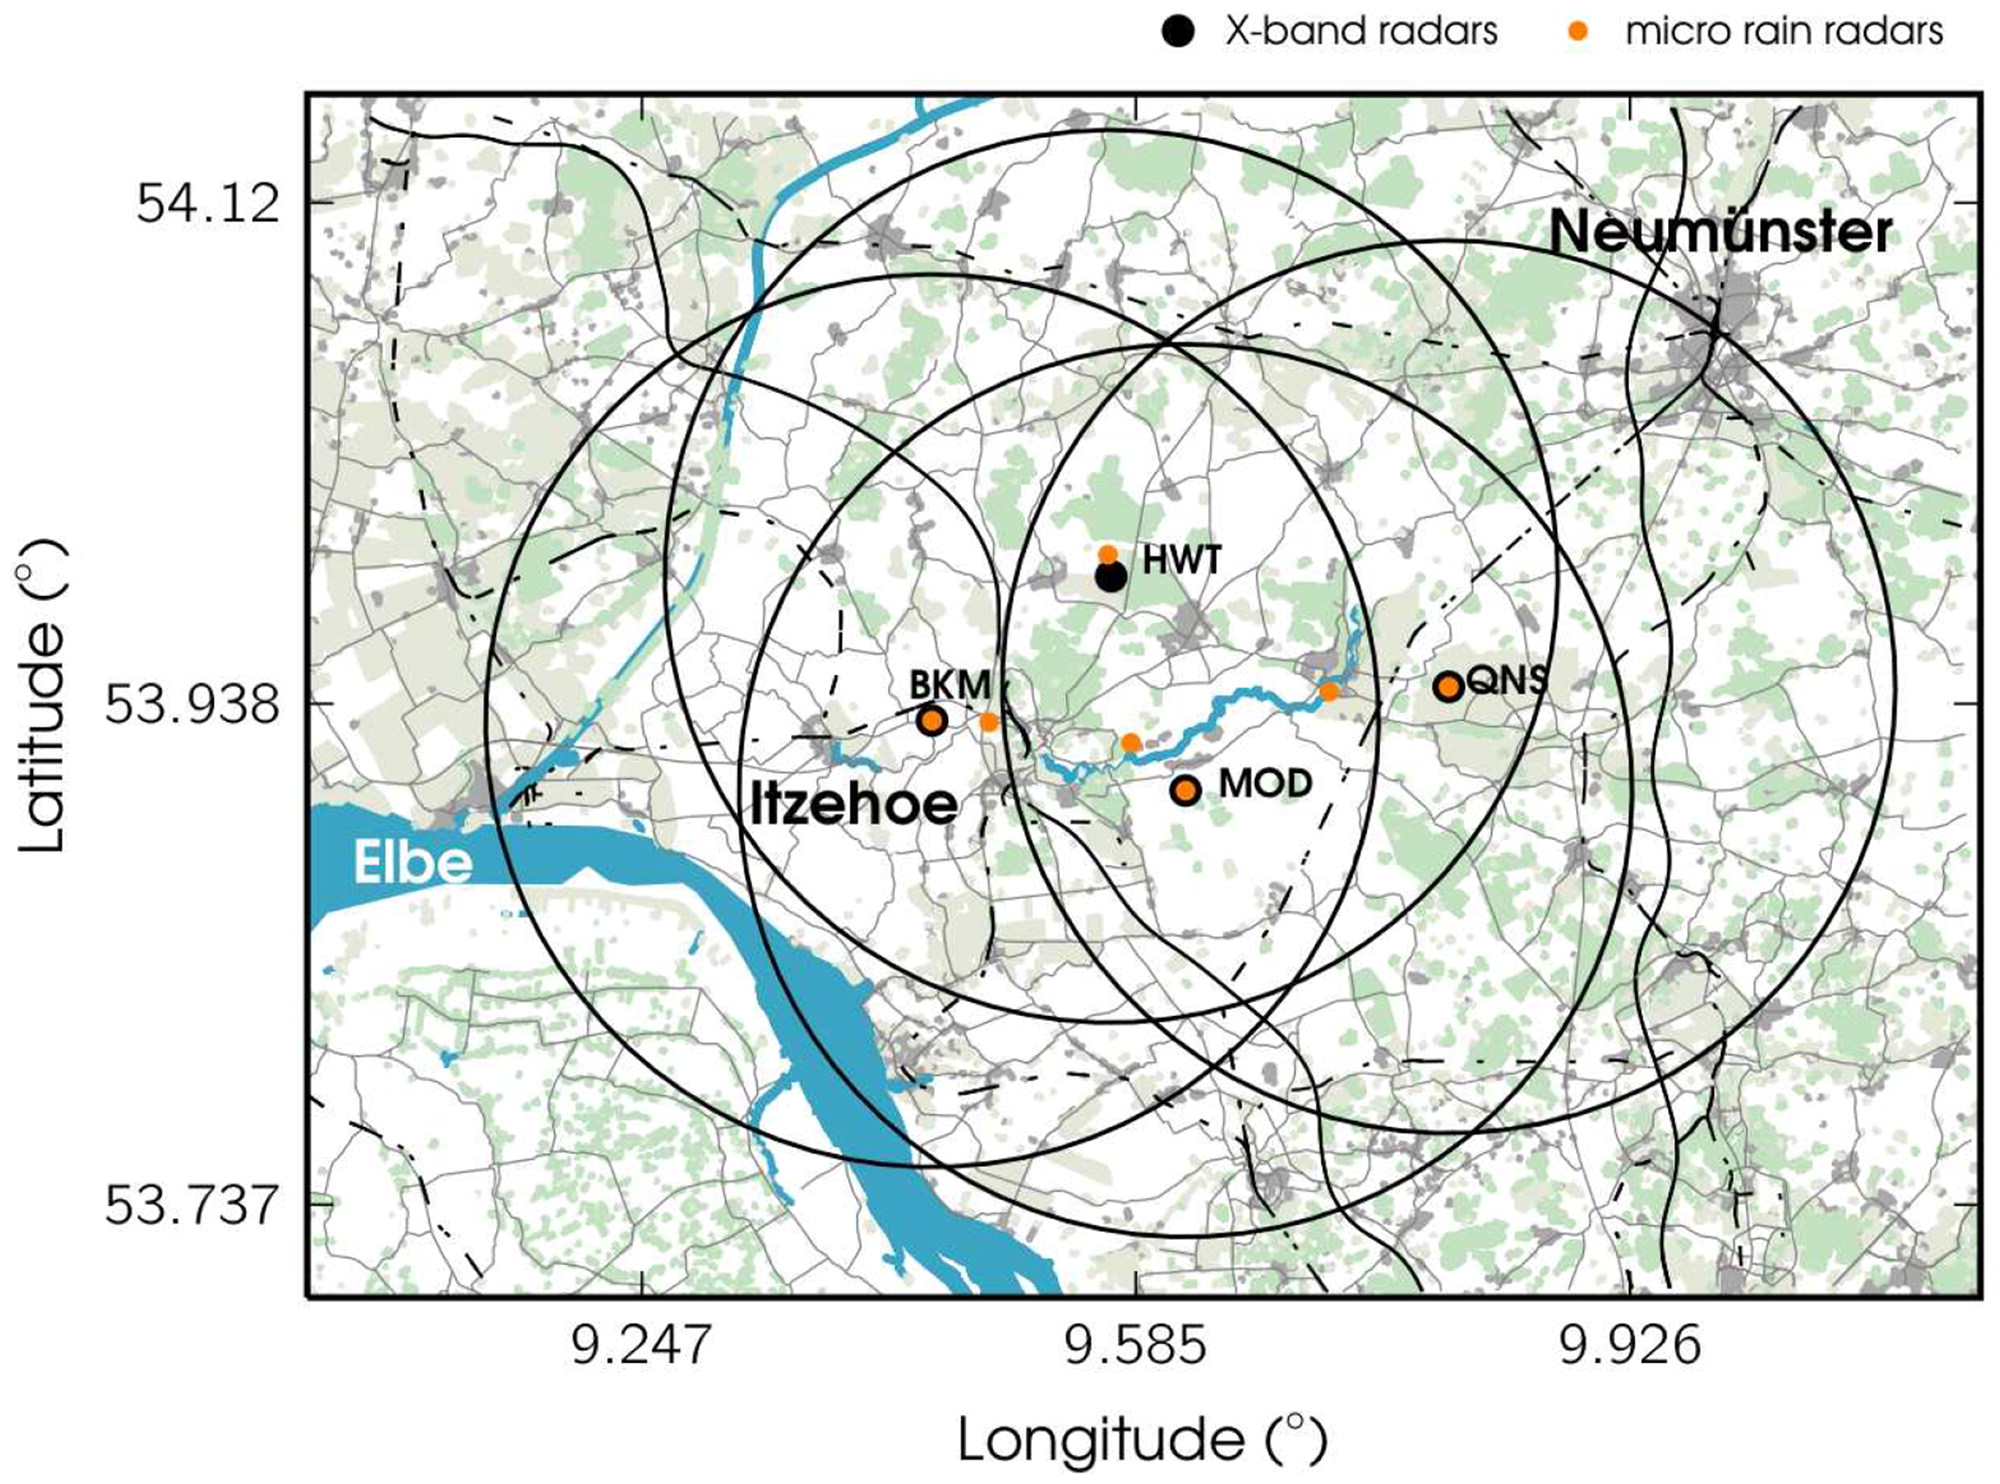
Fig. 4.
Map of the radar network. X-band radar locations and maximum range in black, MRR locations in orange. X-band radars and associated MRRs are installed at BKM, HWT, MOD and QNS sites. Three MRRs are installed between X-band radars, at sites WST, MST, and OST, from west to east respectively, together with reference rain gauges.
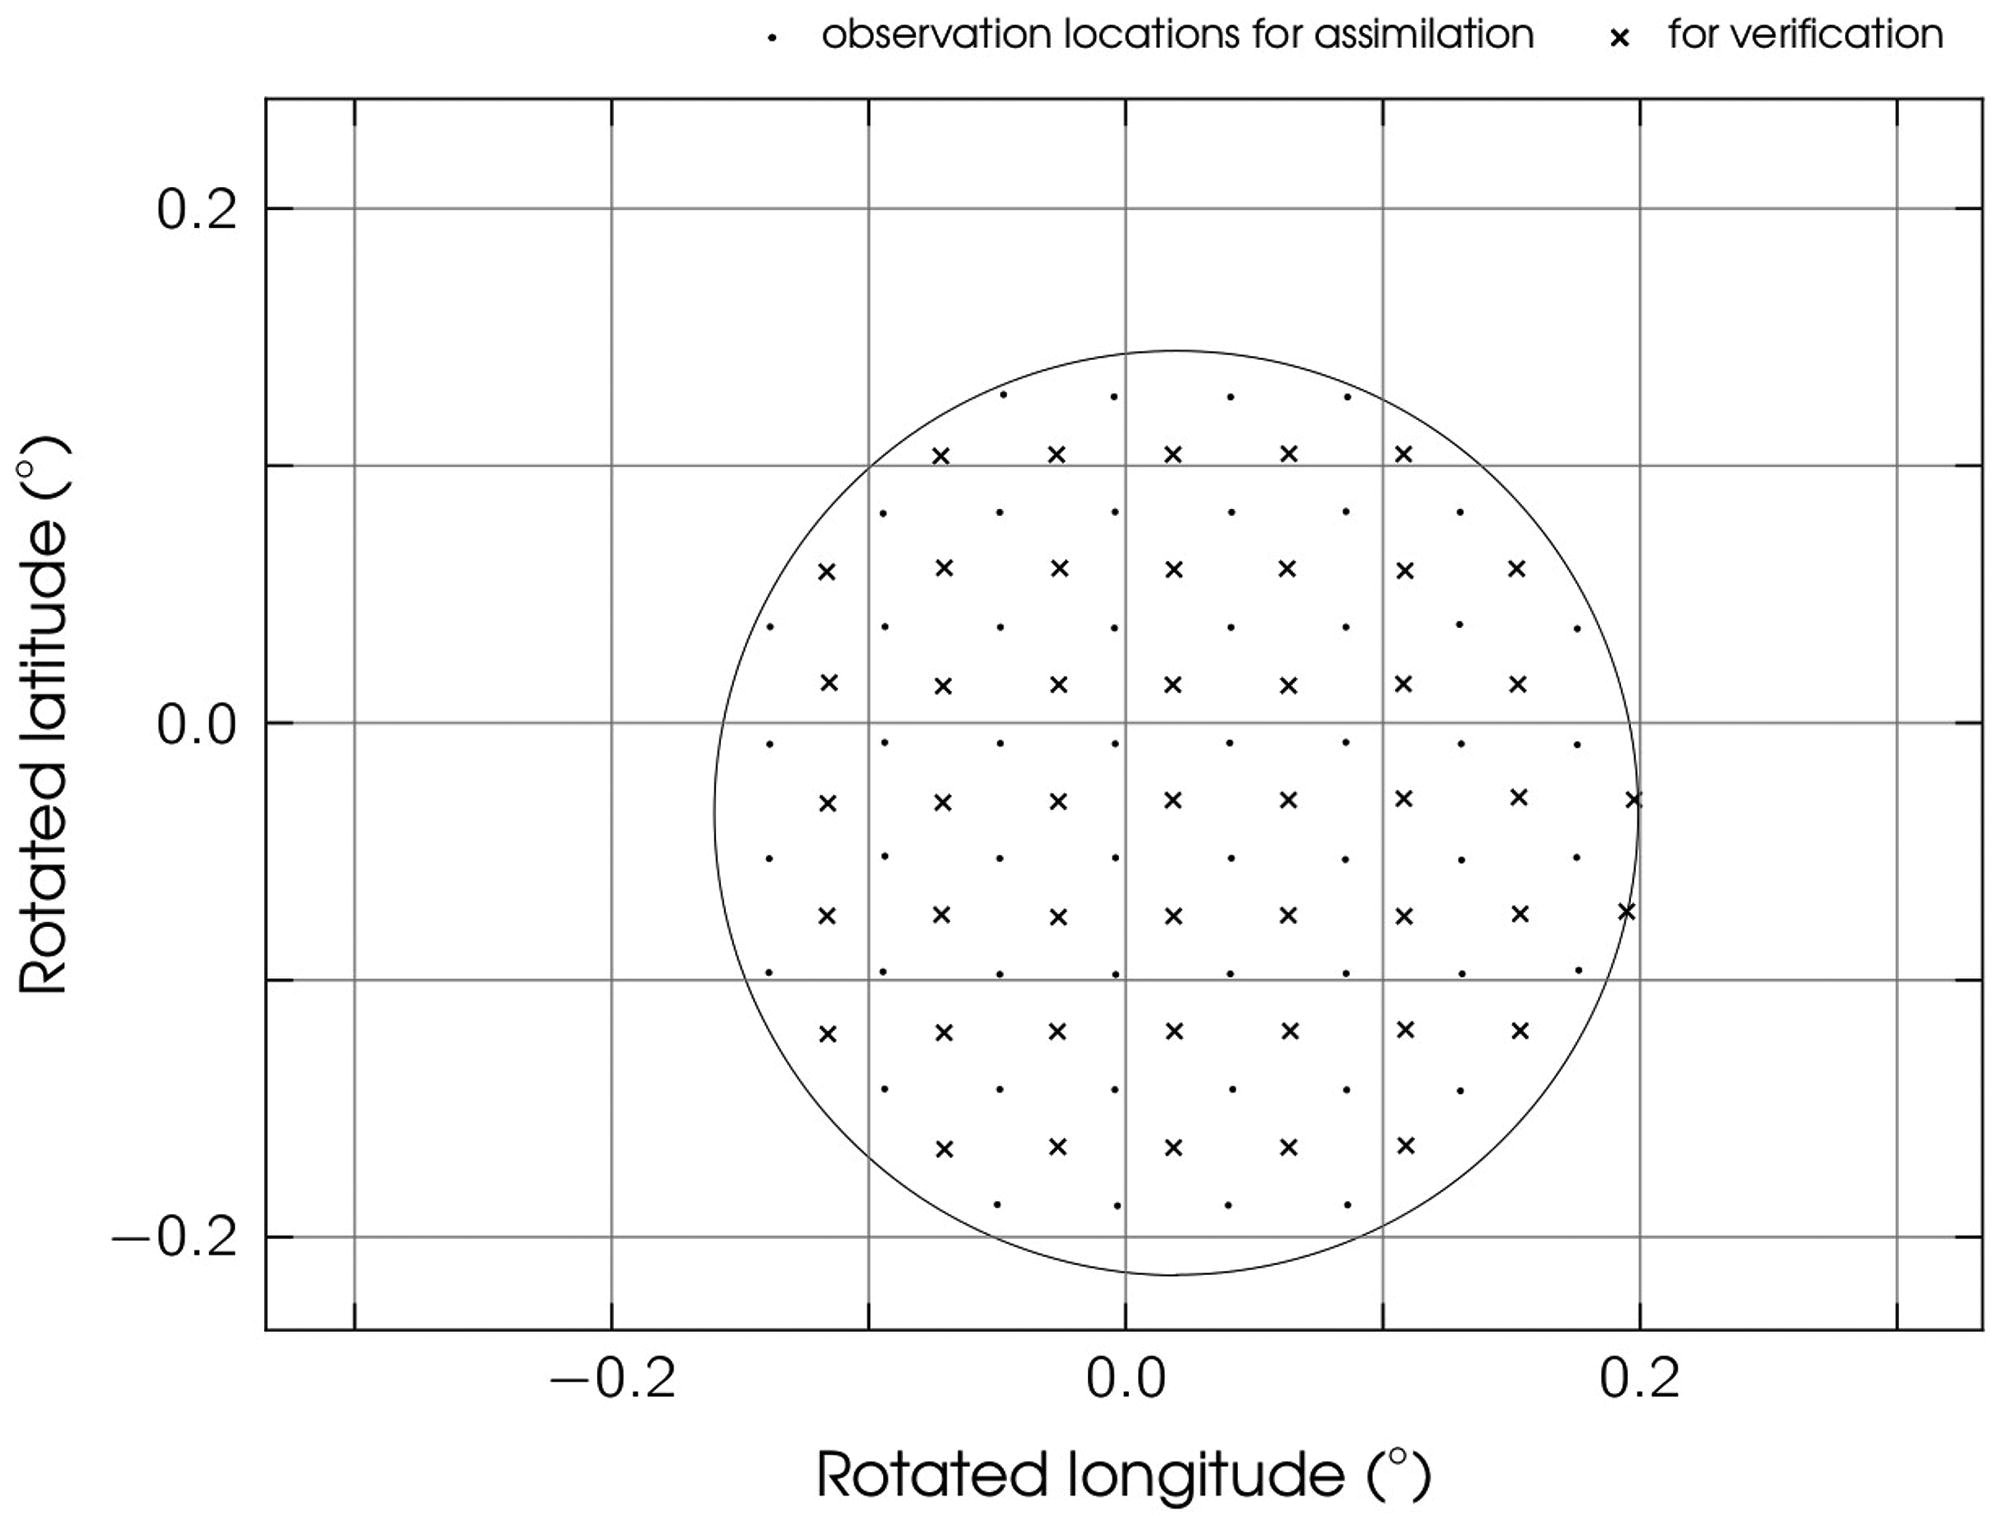
Fig. 5.
Locations of thinned precipitation observations created for assimilation from data of the X-band radar at MOD site (Lengfeld et al., 2014) on a 5000 m × 5000 m grid (dots) and locations for verification on a 5000 m × 5000 m grid shifted by 2500 m north and east (crosses).
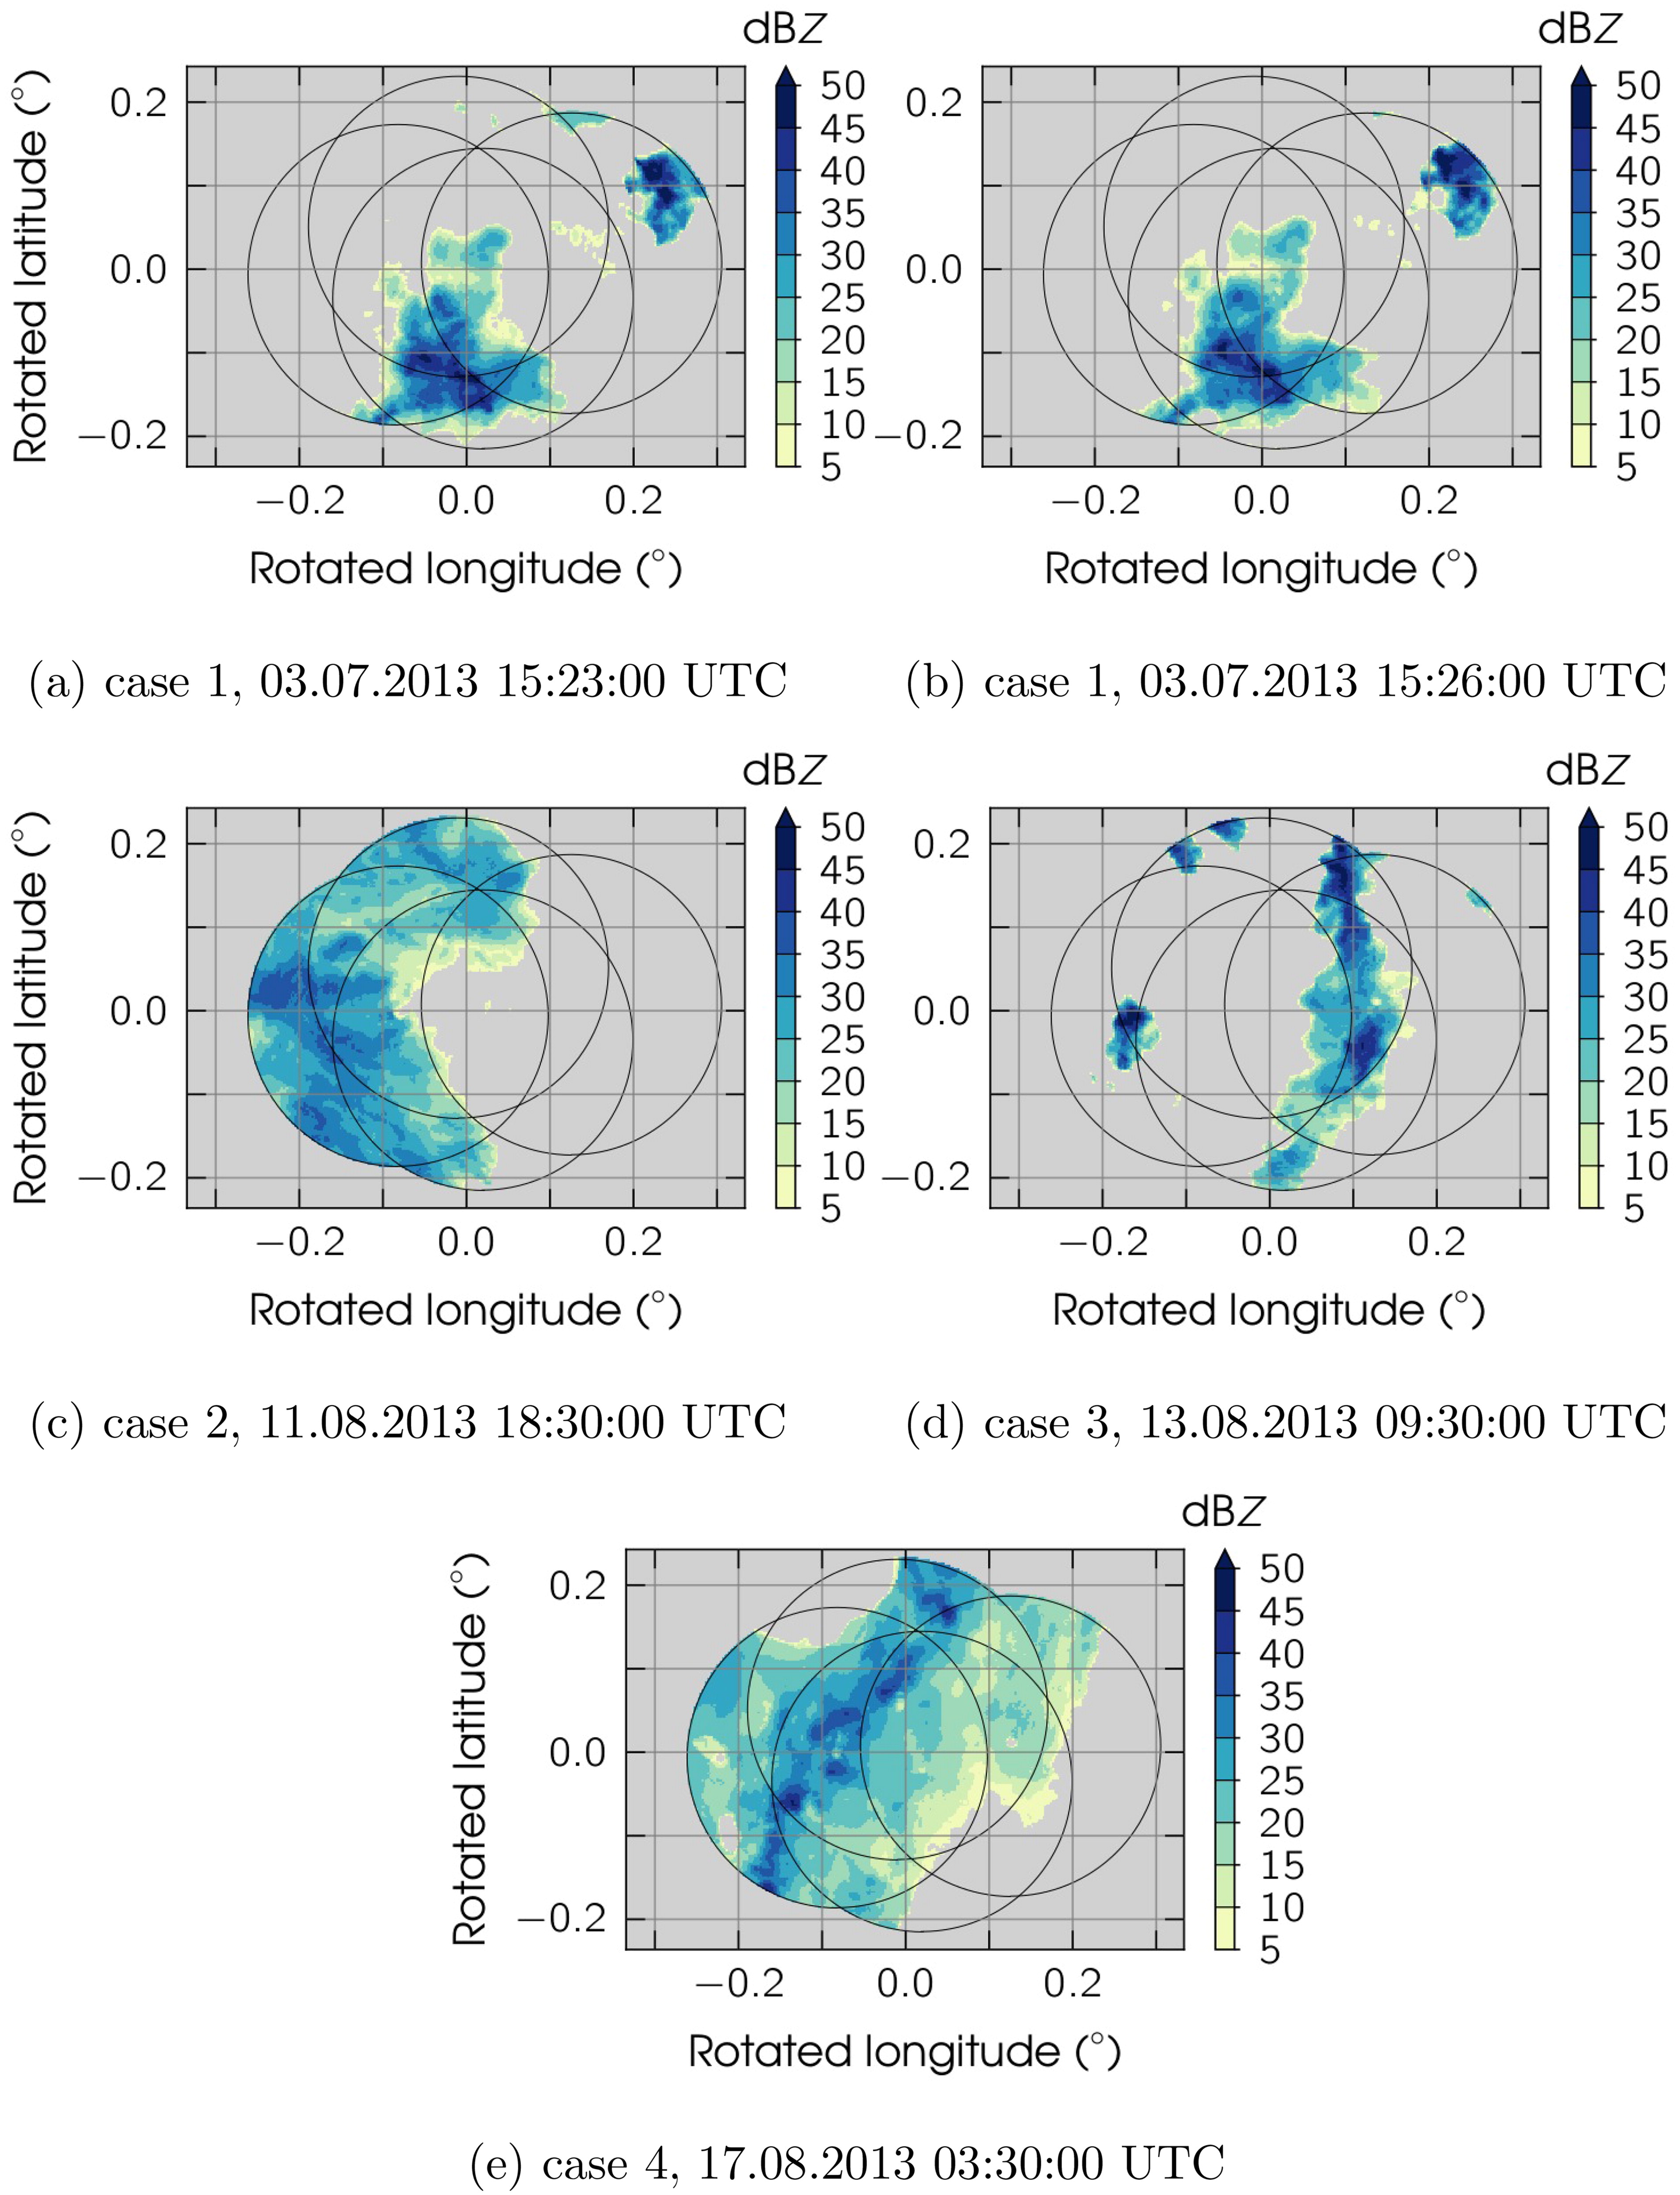
Fig. 6.
X-band radar network composite reflectivity data (Lengfeld et al., 2014) for the four cases presented in the study: Case 1 on the 3 July 2013 15:23:00 UTC (a) and 15:26:00 UTC (b), case 2 on the 11 August 2013 18:30:00 UTC (c), case 3 on the 13 August 2013 09:30:00 UTC (d) and case 4 on the 17 August 2013 03:30:00 UTC (e).
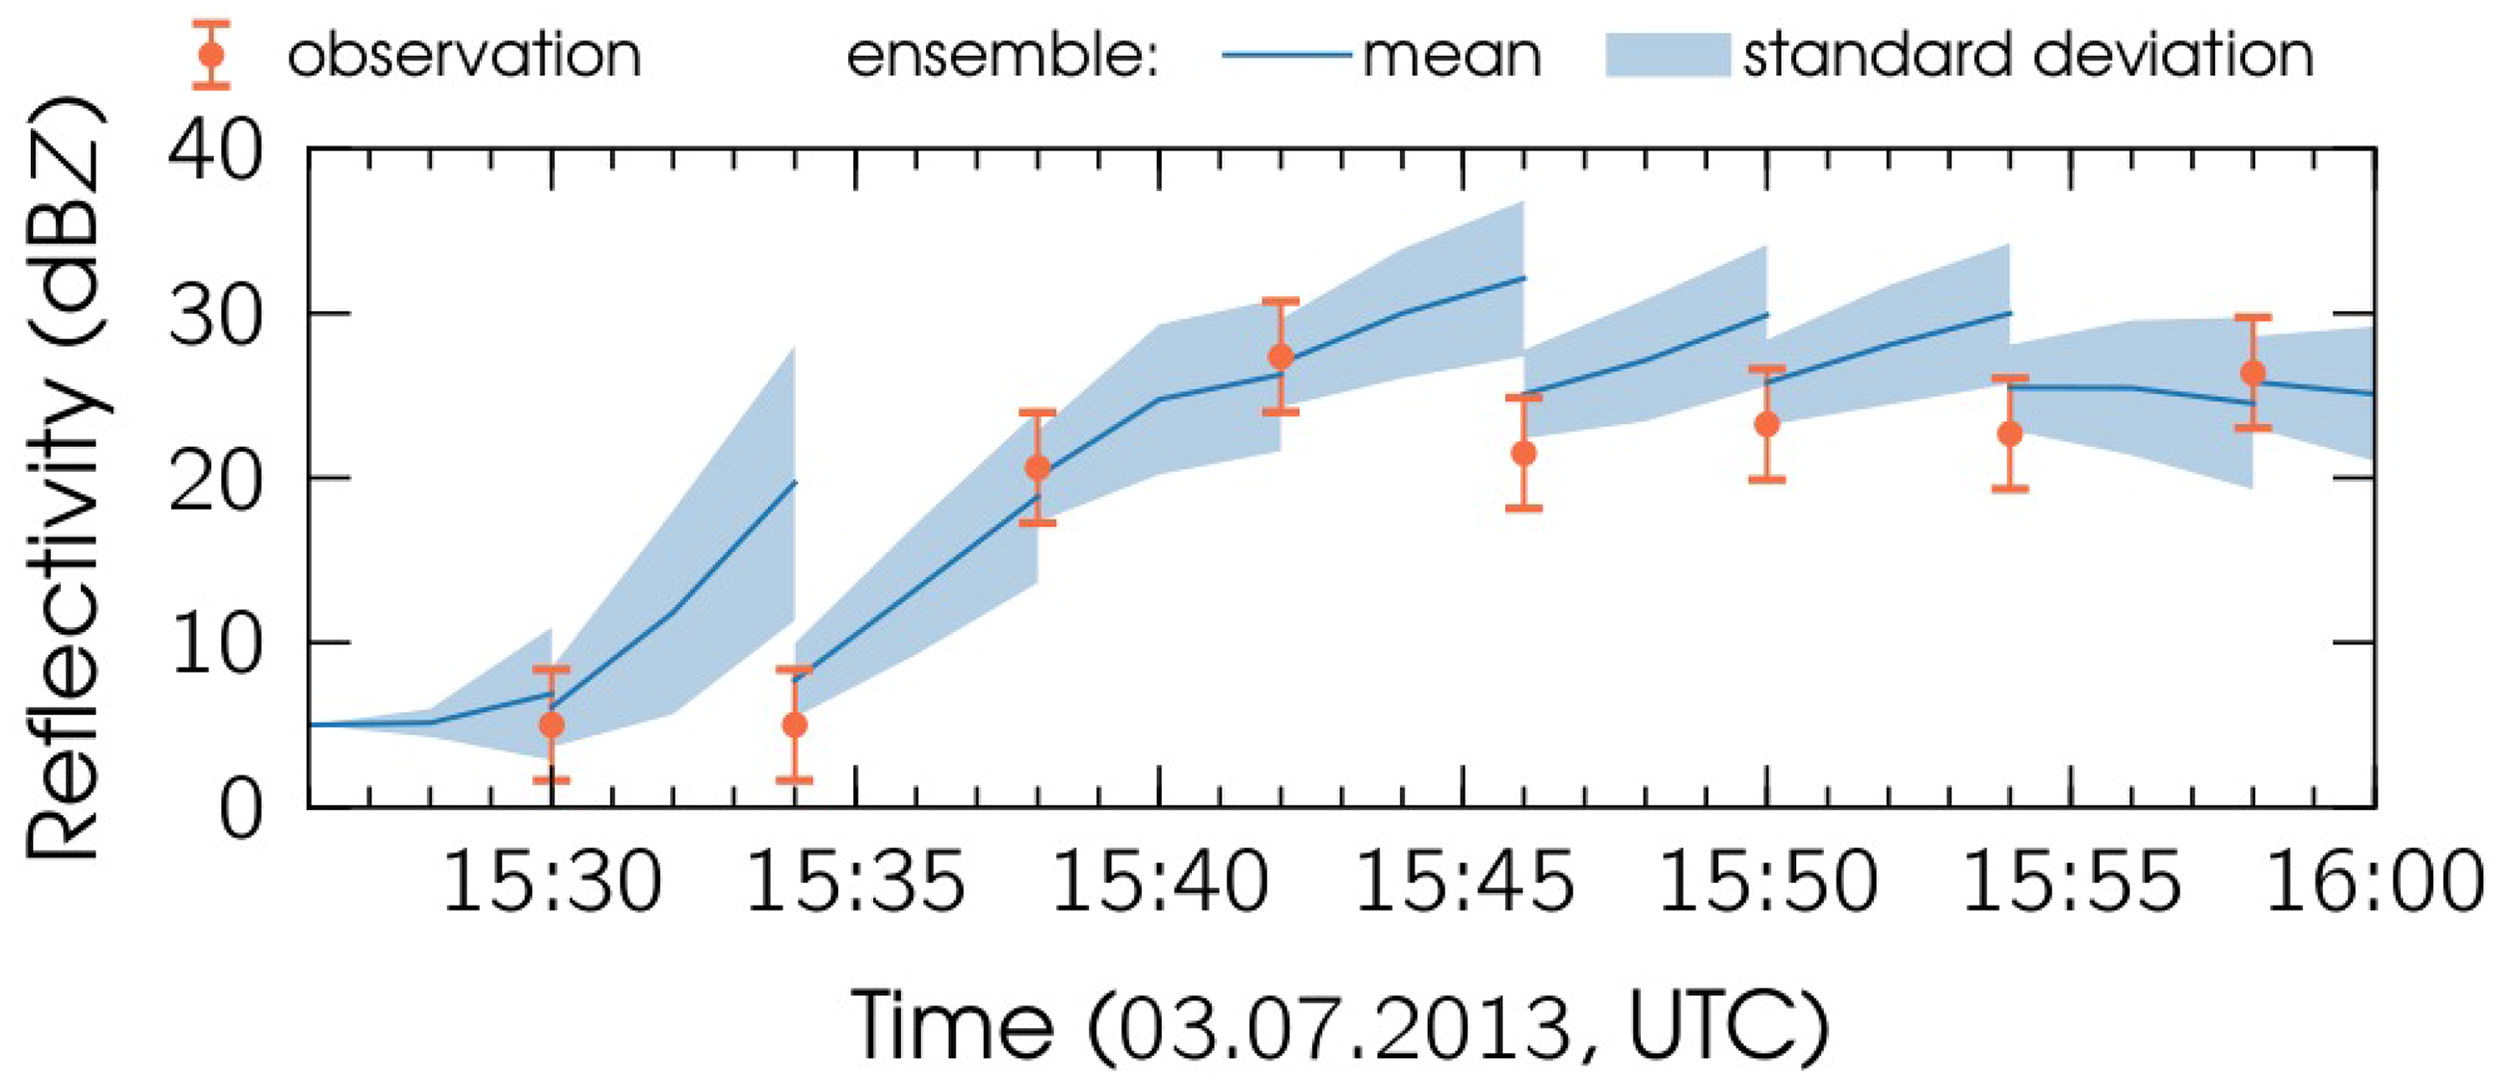
Fig. 7.
Reflectivity ensemble mean evolution (dark blue line) and uncertainty range (light blue envelope, ± one ensemble standard deviation) throughout the data assimilation cycle at observation grid point 0.041°E, – 0.053°N (indicated by a cross in Fig. 8) and observations (orange whiskers, ± observation error standard deviation).
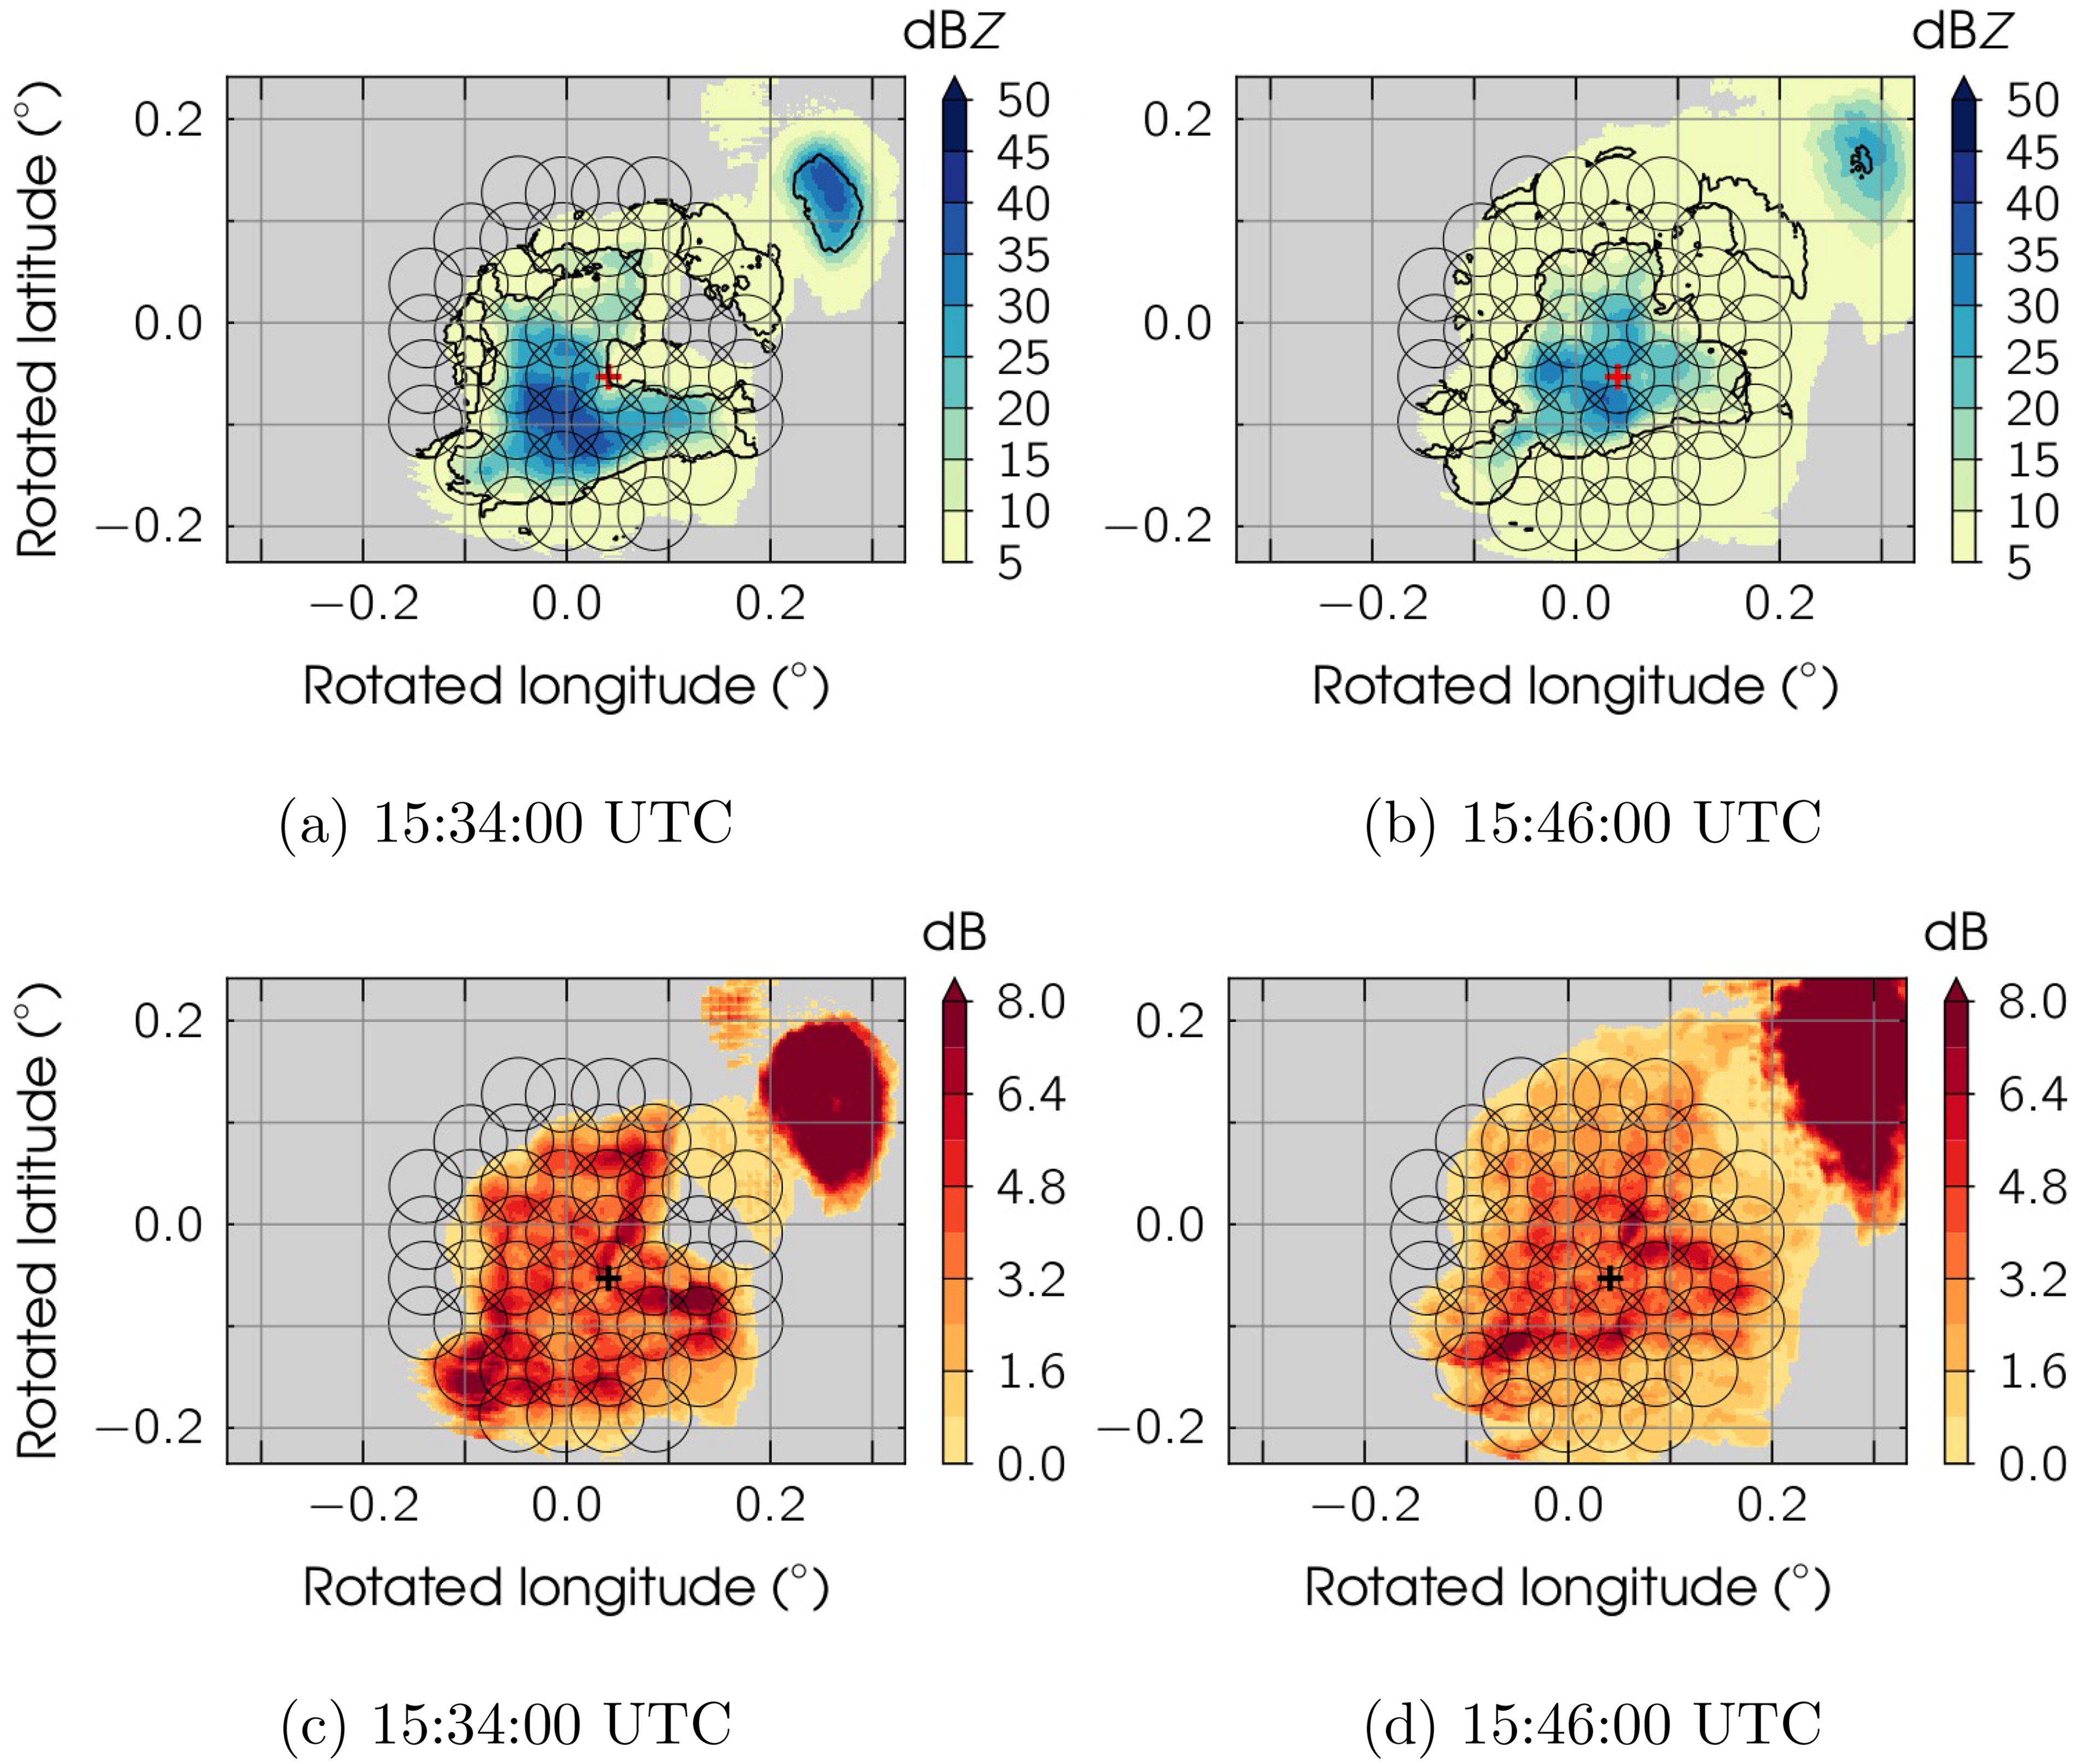
Fig. 8.
Spatial distribution of the reflectivity ensemble mean (with contour highlighting the region in which 80% of the ensemble members show precipitation above 5 dBZ, top row) and spread (bottom row), i.e. ensemble standard deviation, for the analysis at (a, c) 15:34:00 UTC and (b, d) 15:46:00 UTC on the 03 July 2013. Circles indicate observation influence radii, the cross indicate the location of the observation location used as an example in Fig. 7.
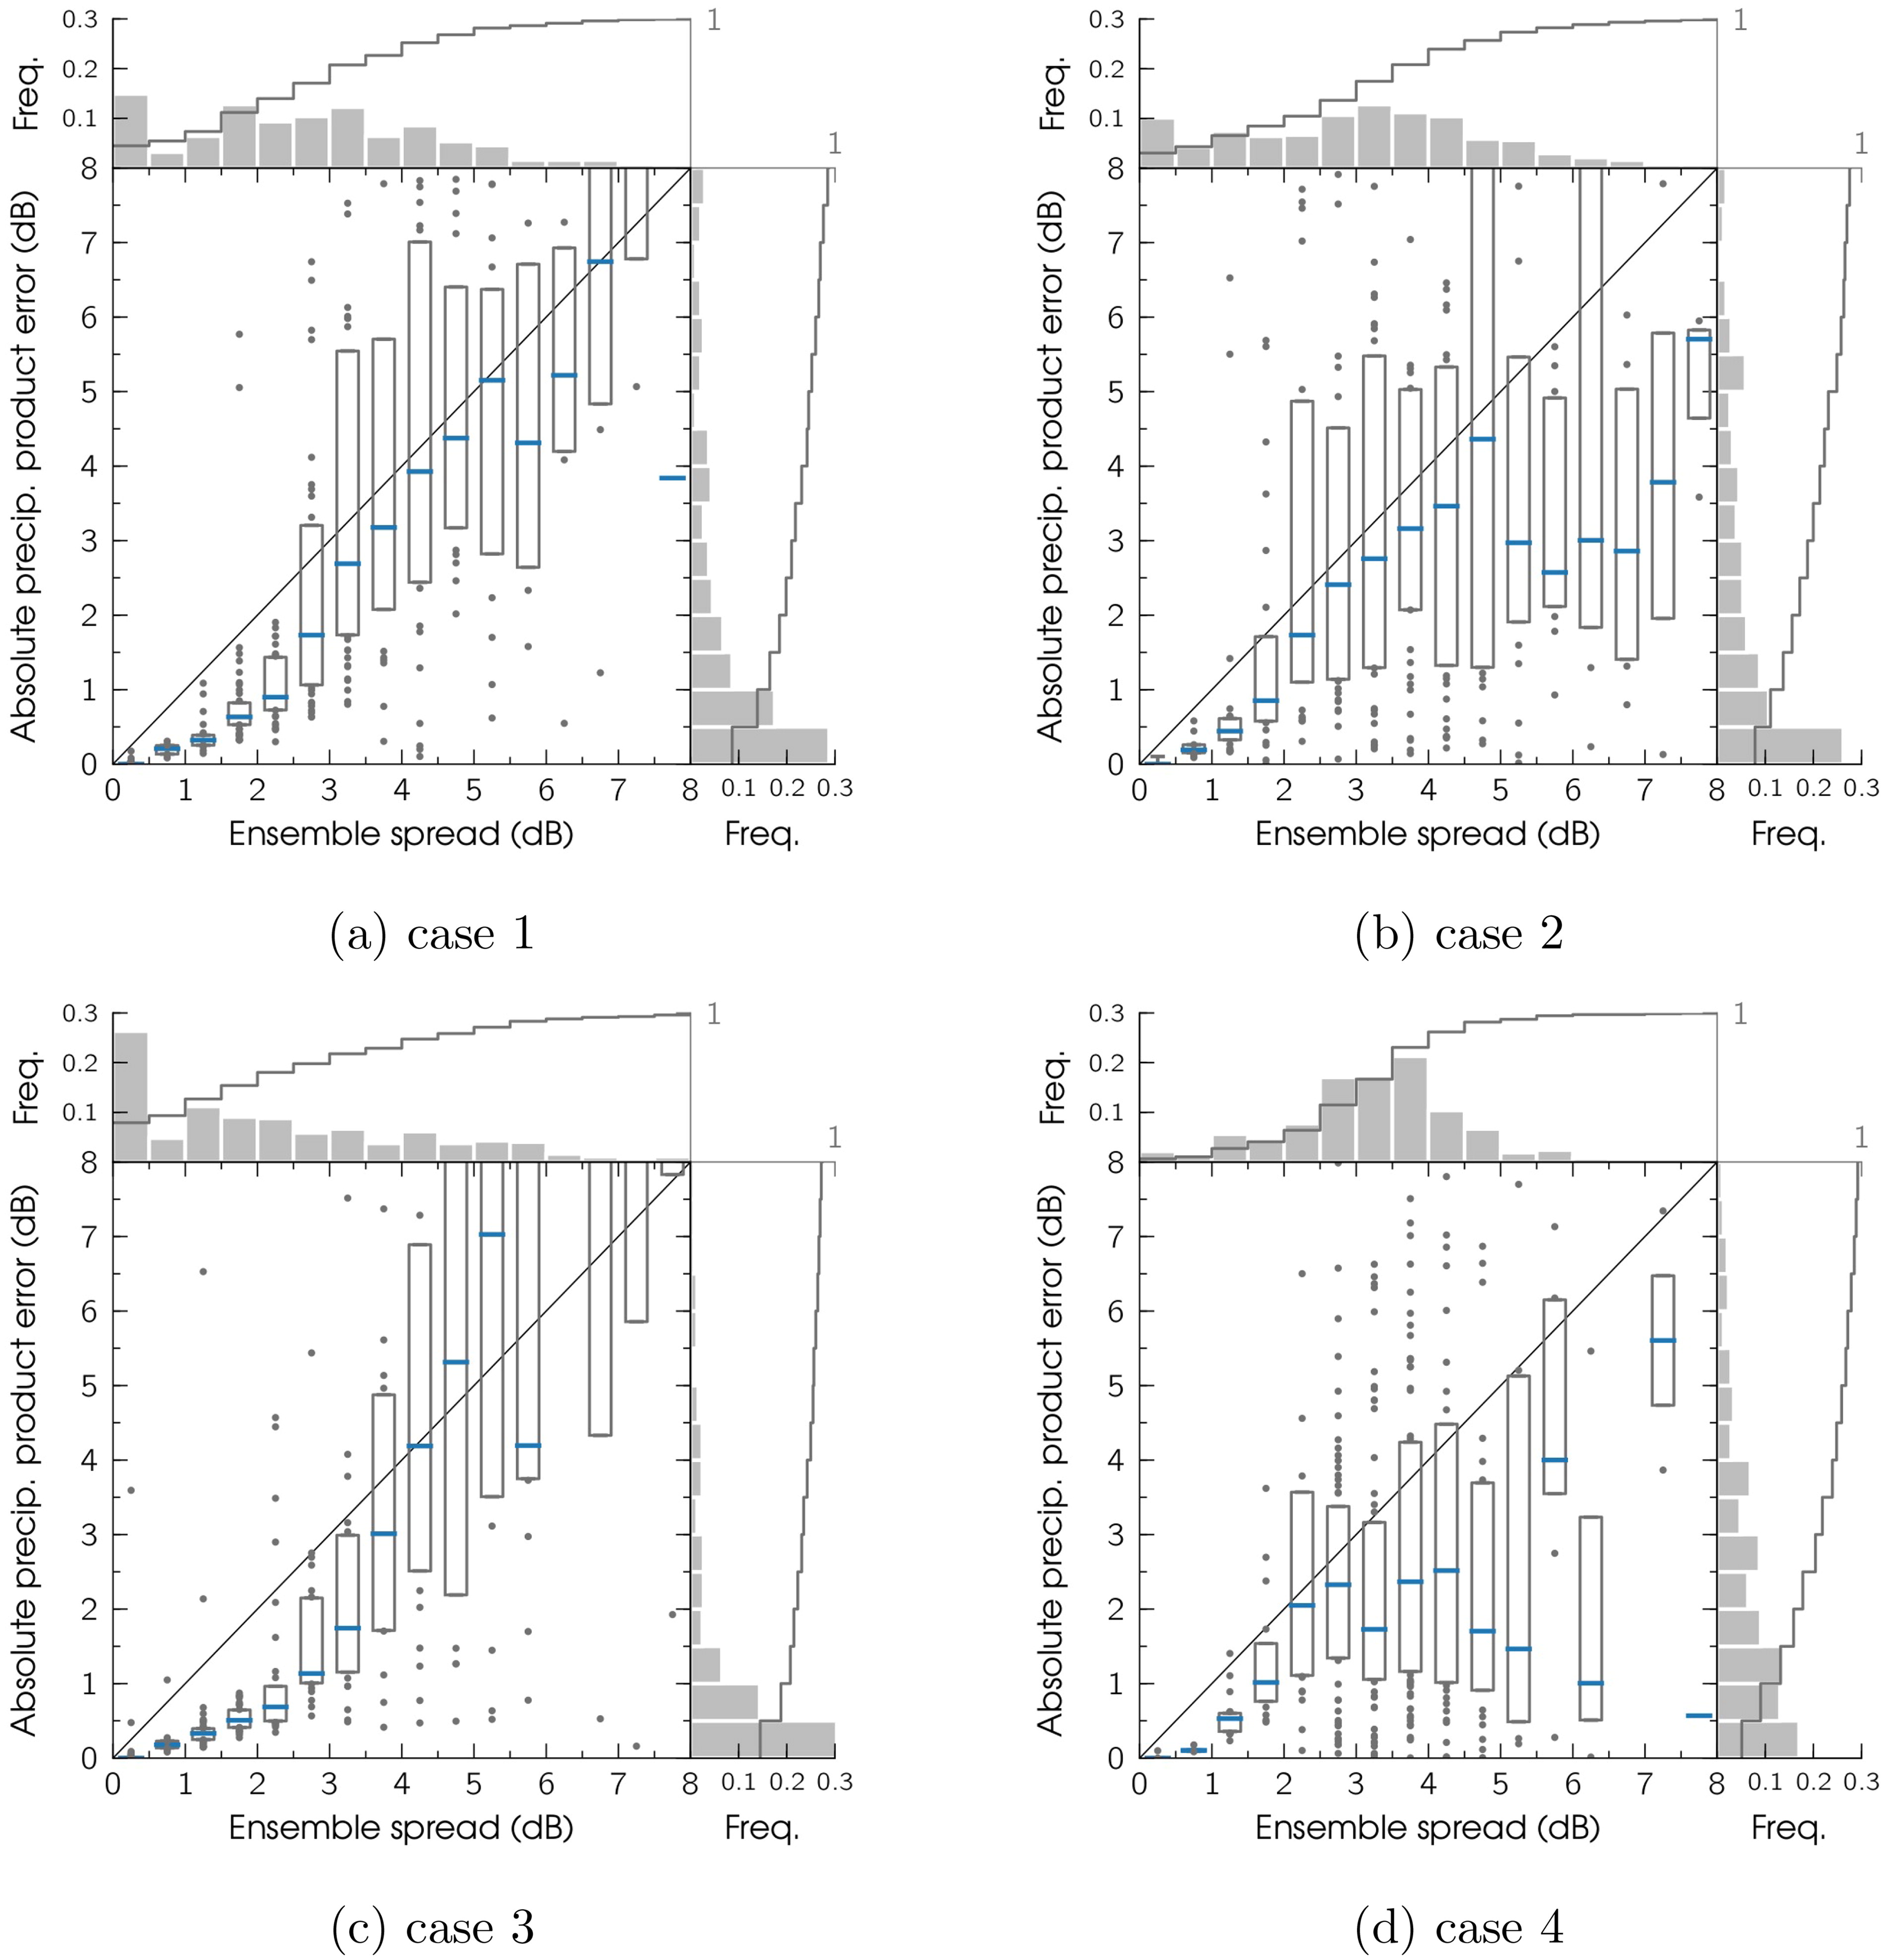
Fig. 9.
Comparison of absolute precipitation product (model ensemble mean) error and ensemble spread (model ensemble standard deviation) at the available 47 verification grid points and eight analysis time steps for (a) case 1, (b) case 2, (c) case 3 and (d) case 4. Ensemble spread values are divided into bins of 0.5 dB width, boxes indicate the median (blue line) and the first and third quartiles. Data distribution is shown in frequency histograms, the solid grey lines show the cumulative distribution function.