
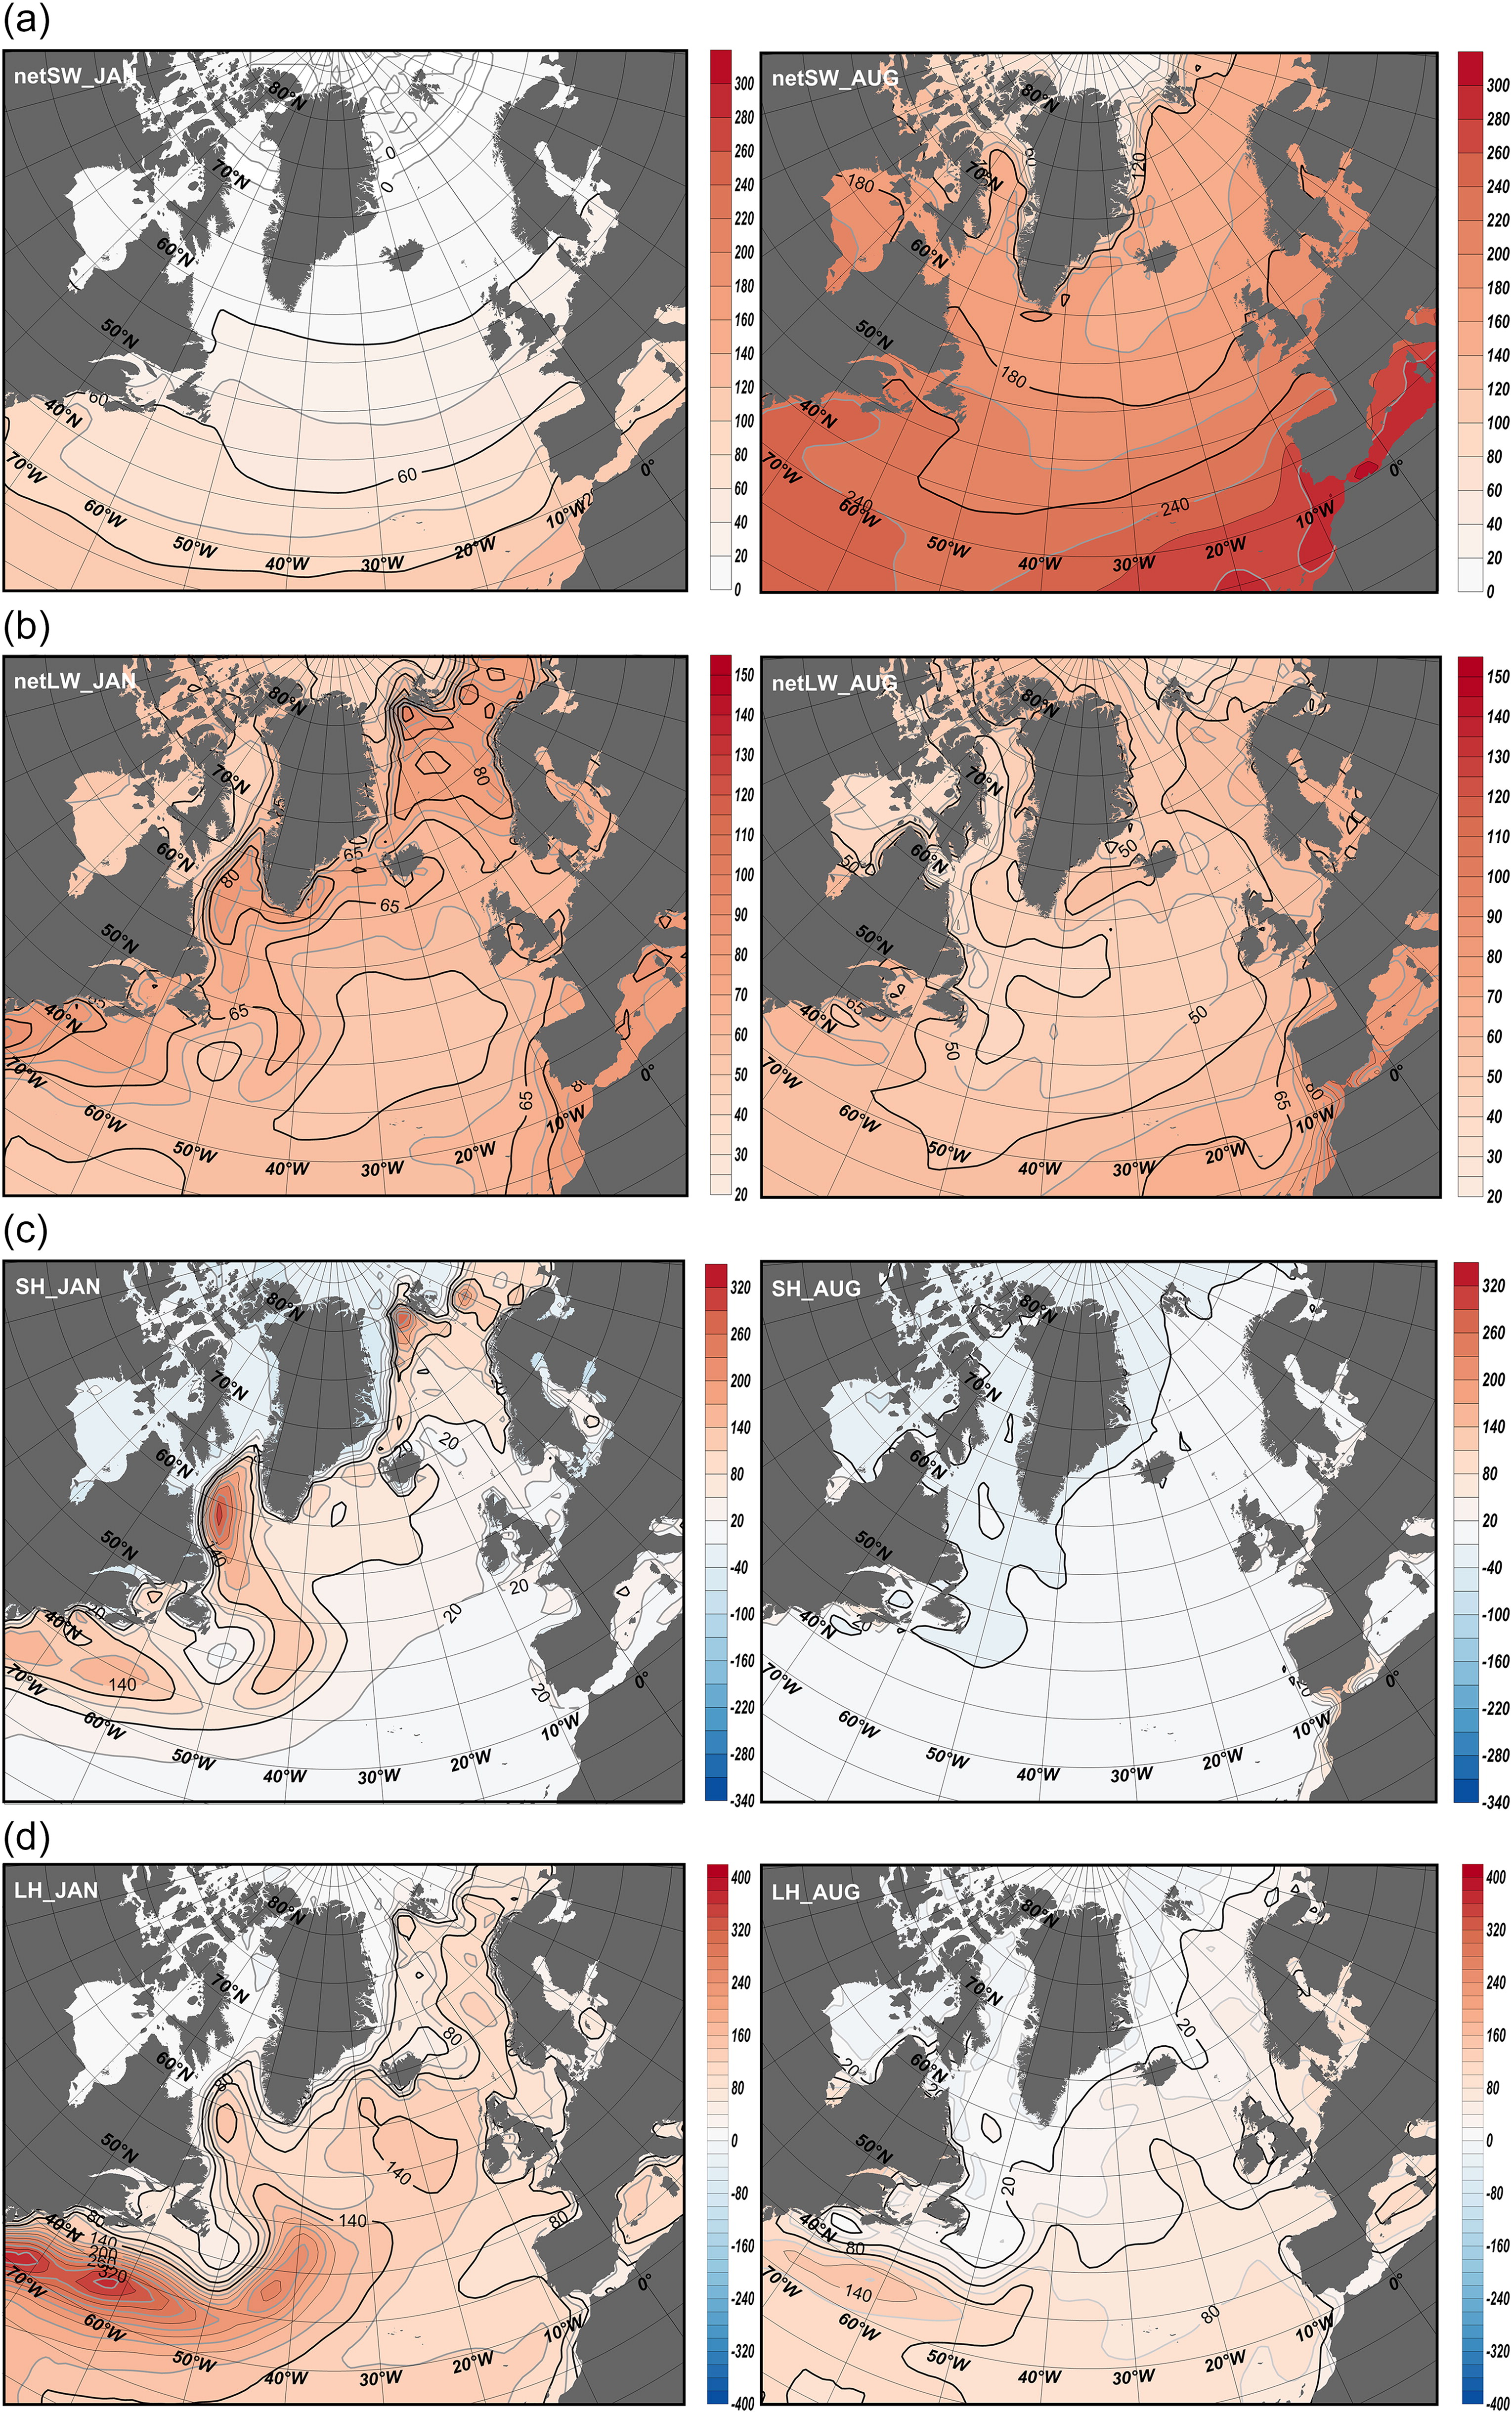
Fig. 1.
Multiyear averaged monthly heat fluxes in winter (January) and summer (August). (a) Net short-wave radiation (left: January; right: August). (b) Net long-wave radiation (left: January; right: August). (c) Sensible heat flux (left: January; right: August). (d) Latent heat flux (left: January; right: August).
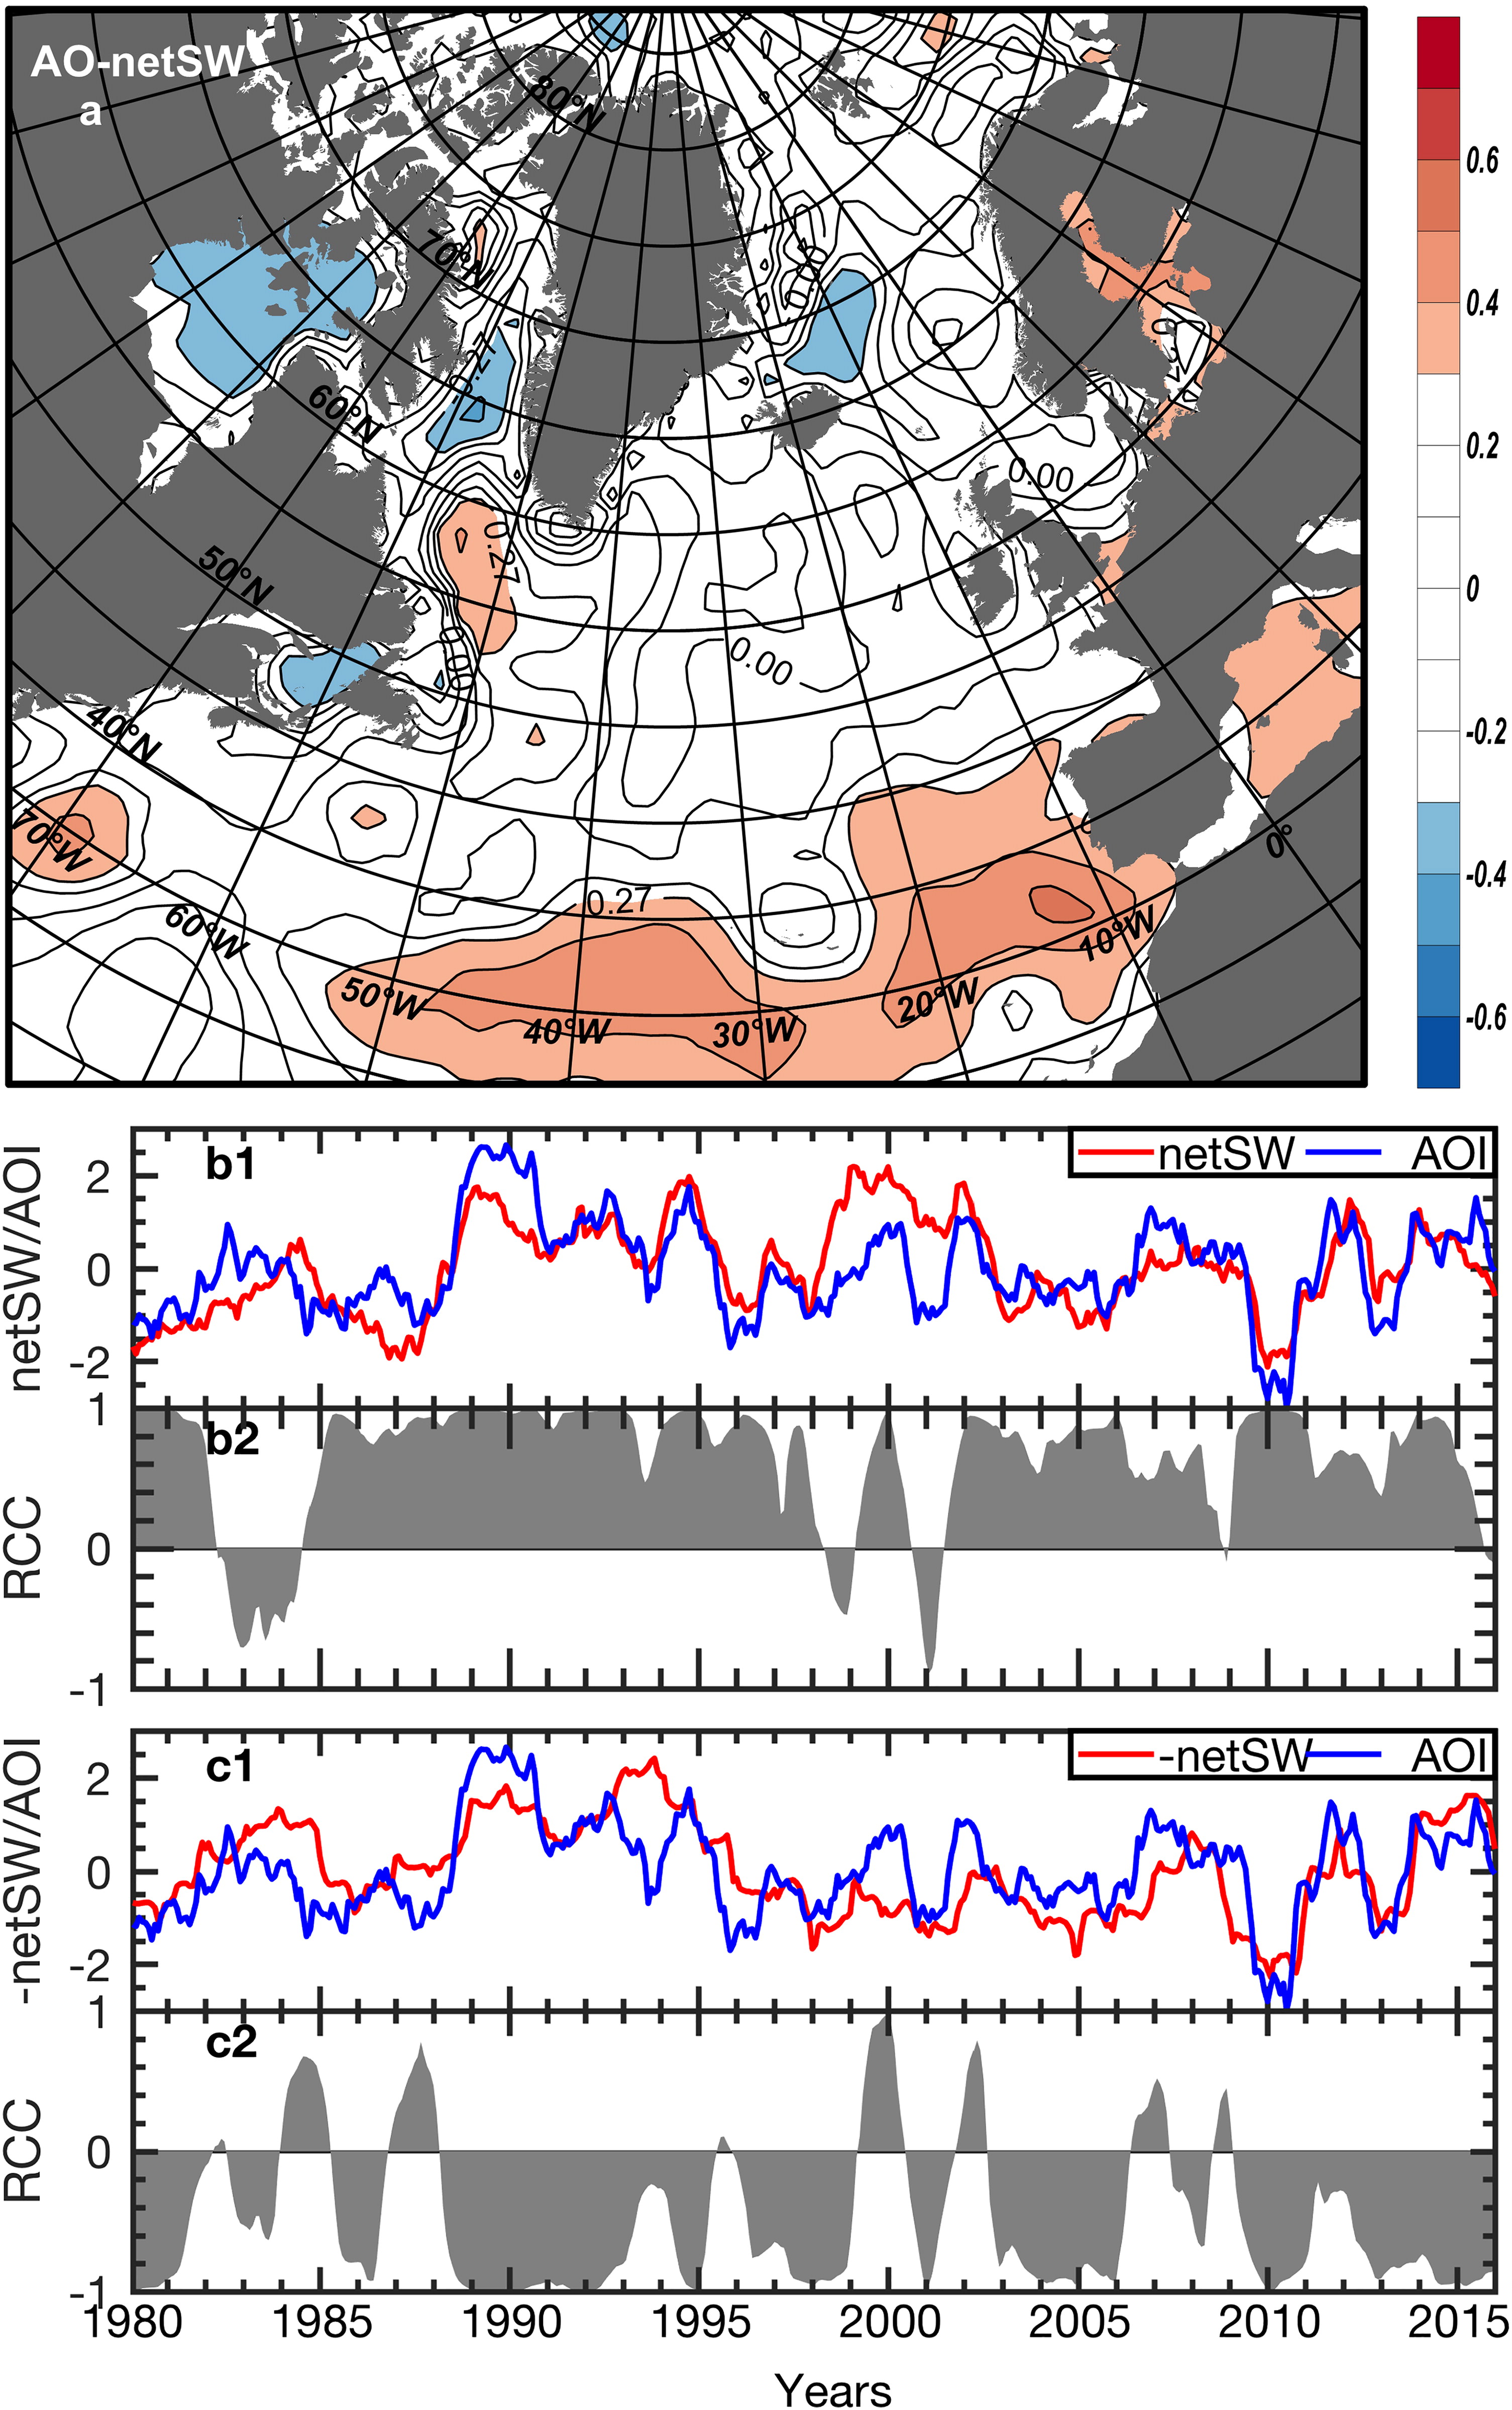
Fig. 2.
Correlation between net short-wave radiation and the AOI. (a) Spatial distribution of correlation coefficient with positive (orange) and negative (blue) HCRs. (b1) and (c1), are the normalised curves for AOI (blue lines) and the averaged net short-wave radiation anomalies (red lines) for positive and negative HCRs, respectively. The histograms show the RCCs for the positive (b2) and negative (c2) HCRs.
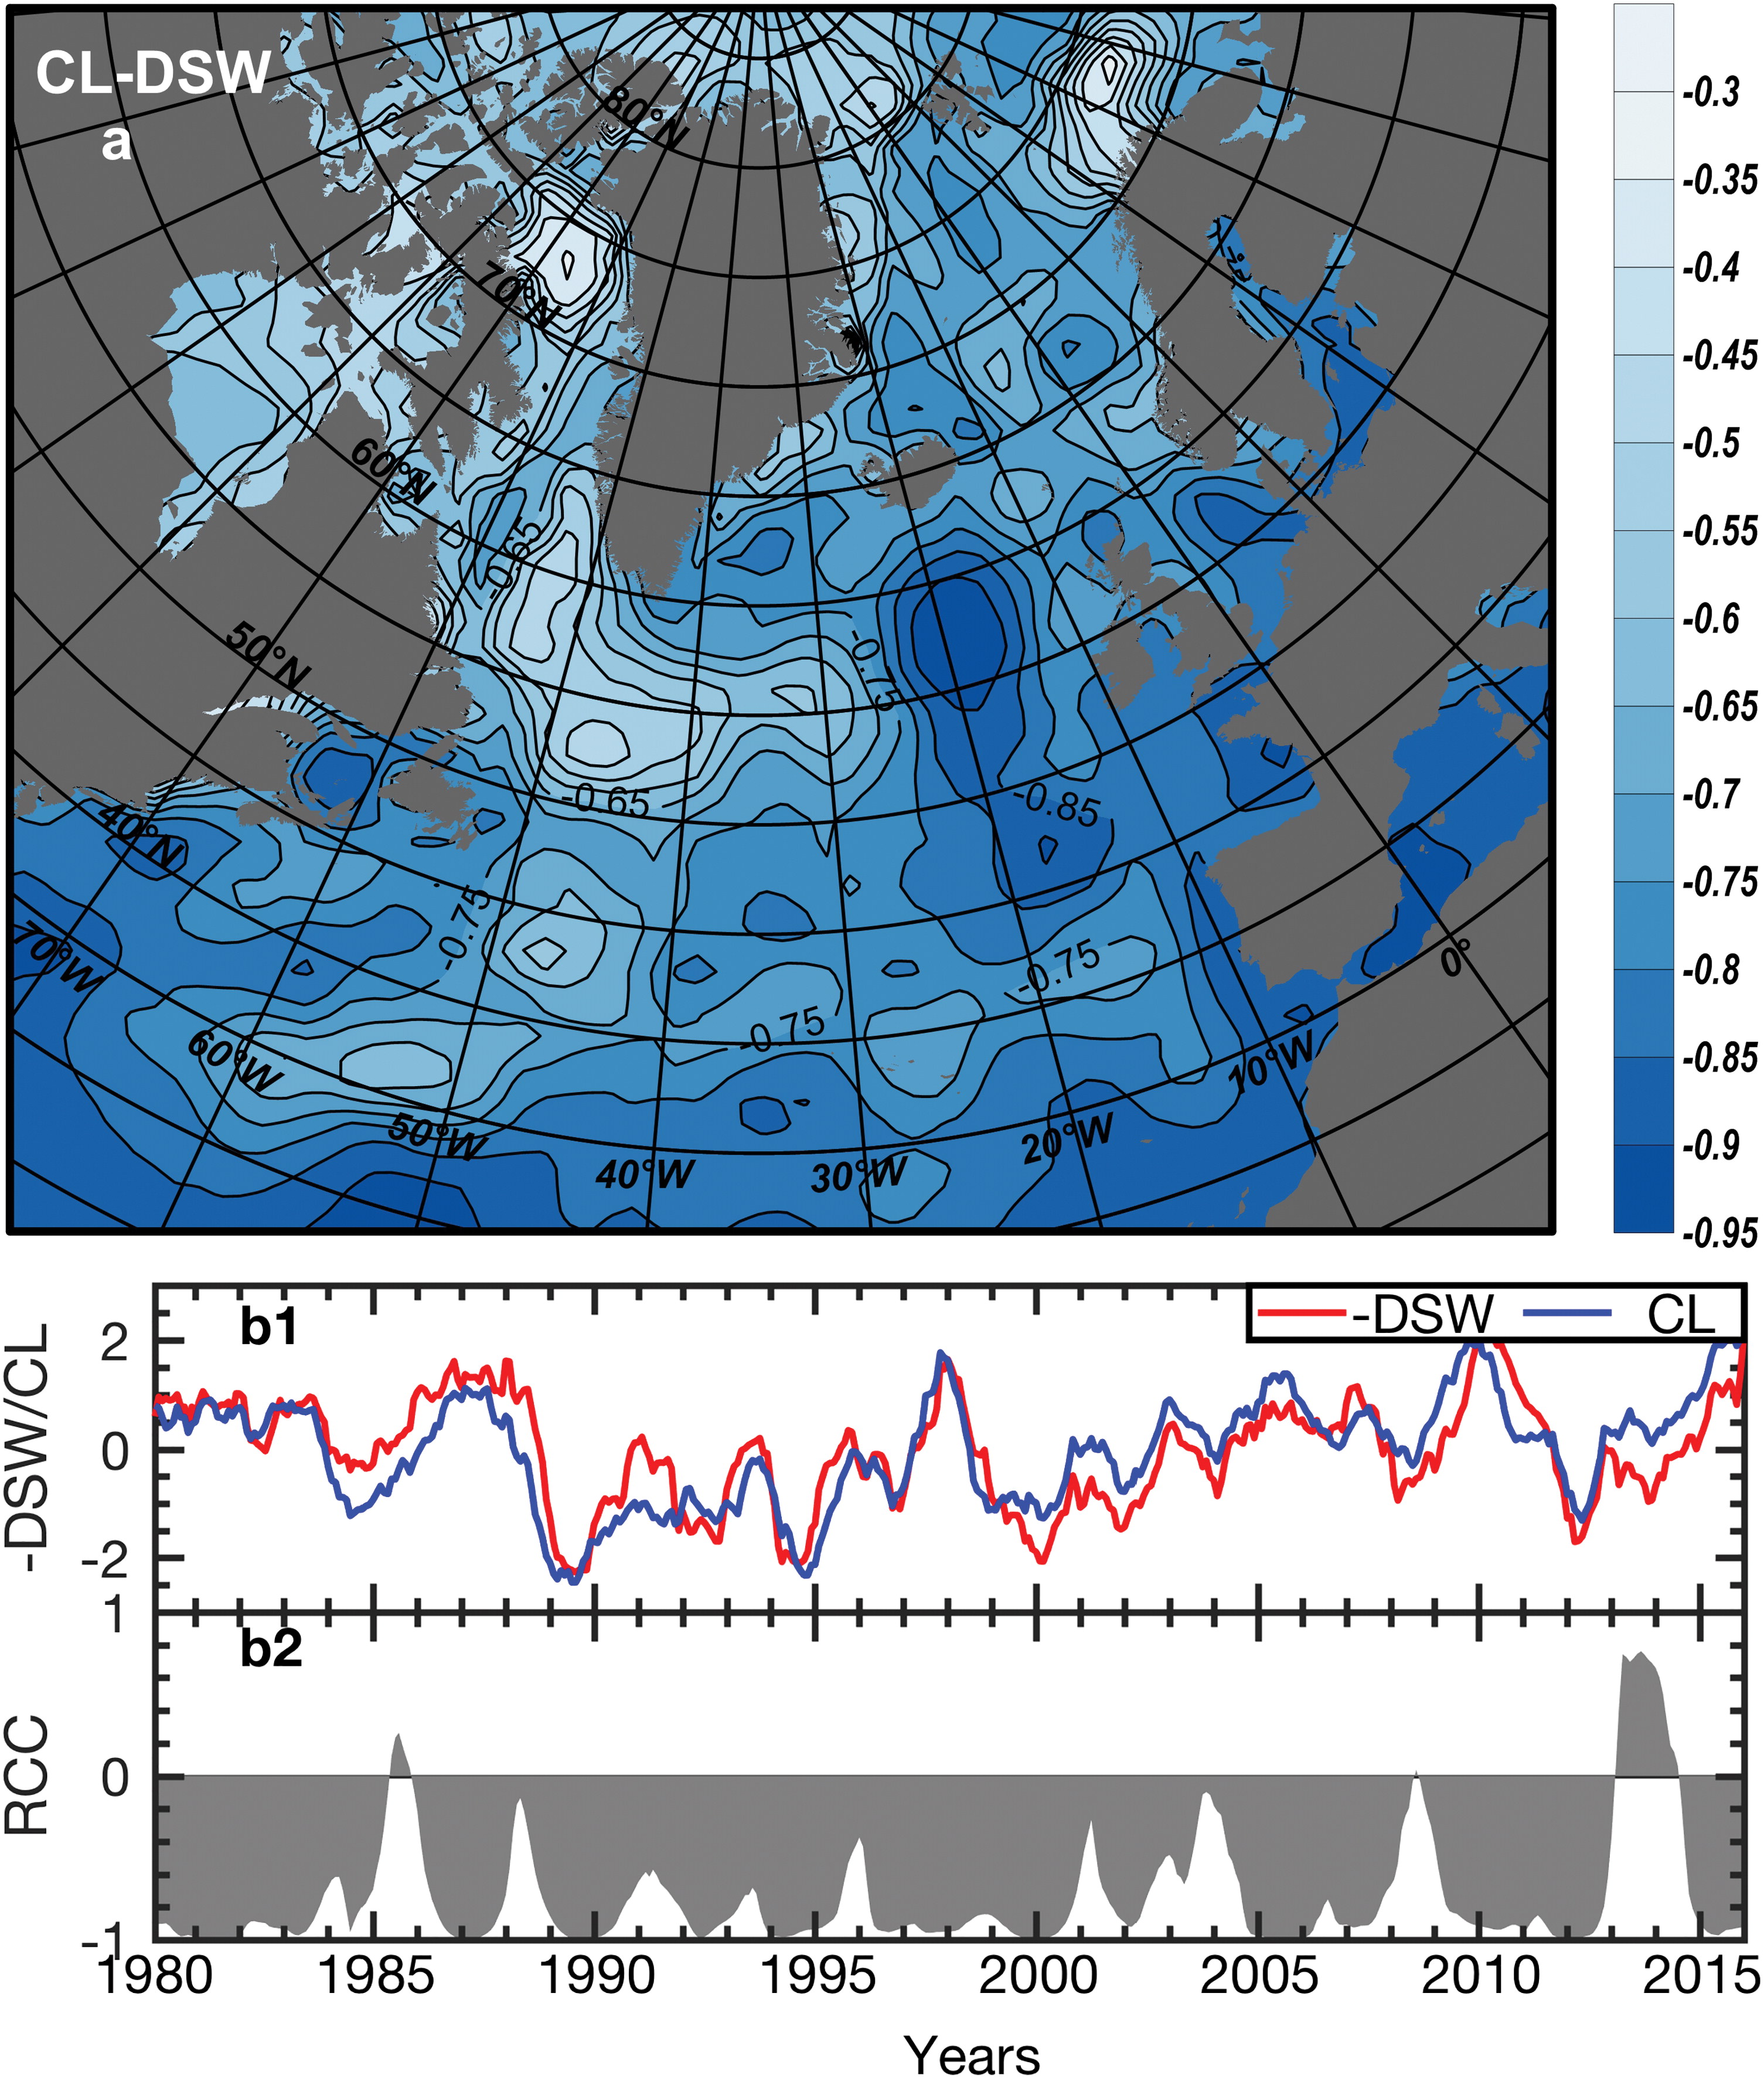
Fig. 3.
The correlation between the downwelling short-wave radiation and cloud coverage. (a) The spatial distribution of correlation coefficient of gridded downwelling short-wave radiation and cloud coverage anomalies. The entire correlation field is negative. (b1) The normalised average downwelling short-wave radiation (red) and cloud coverage (blue) anomalies. (b2) The histogram of the RCC of downwelling short-wave radiation and cloud cover.
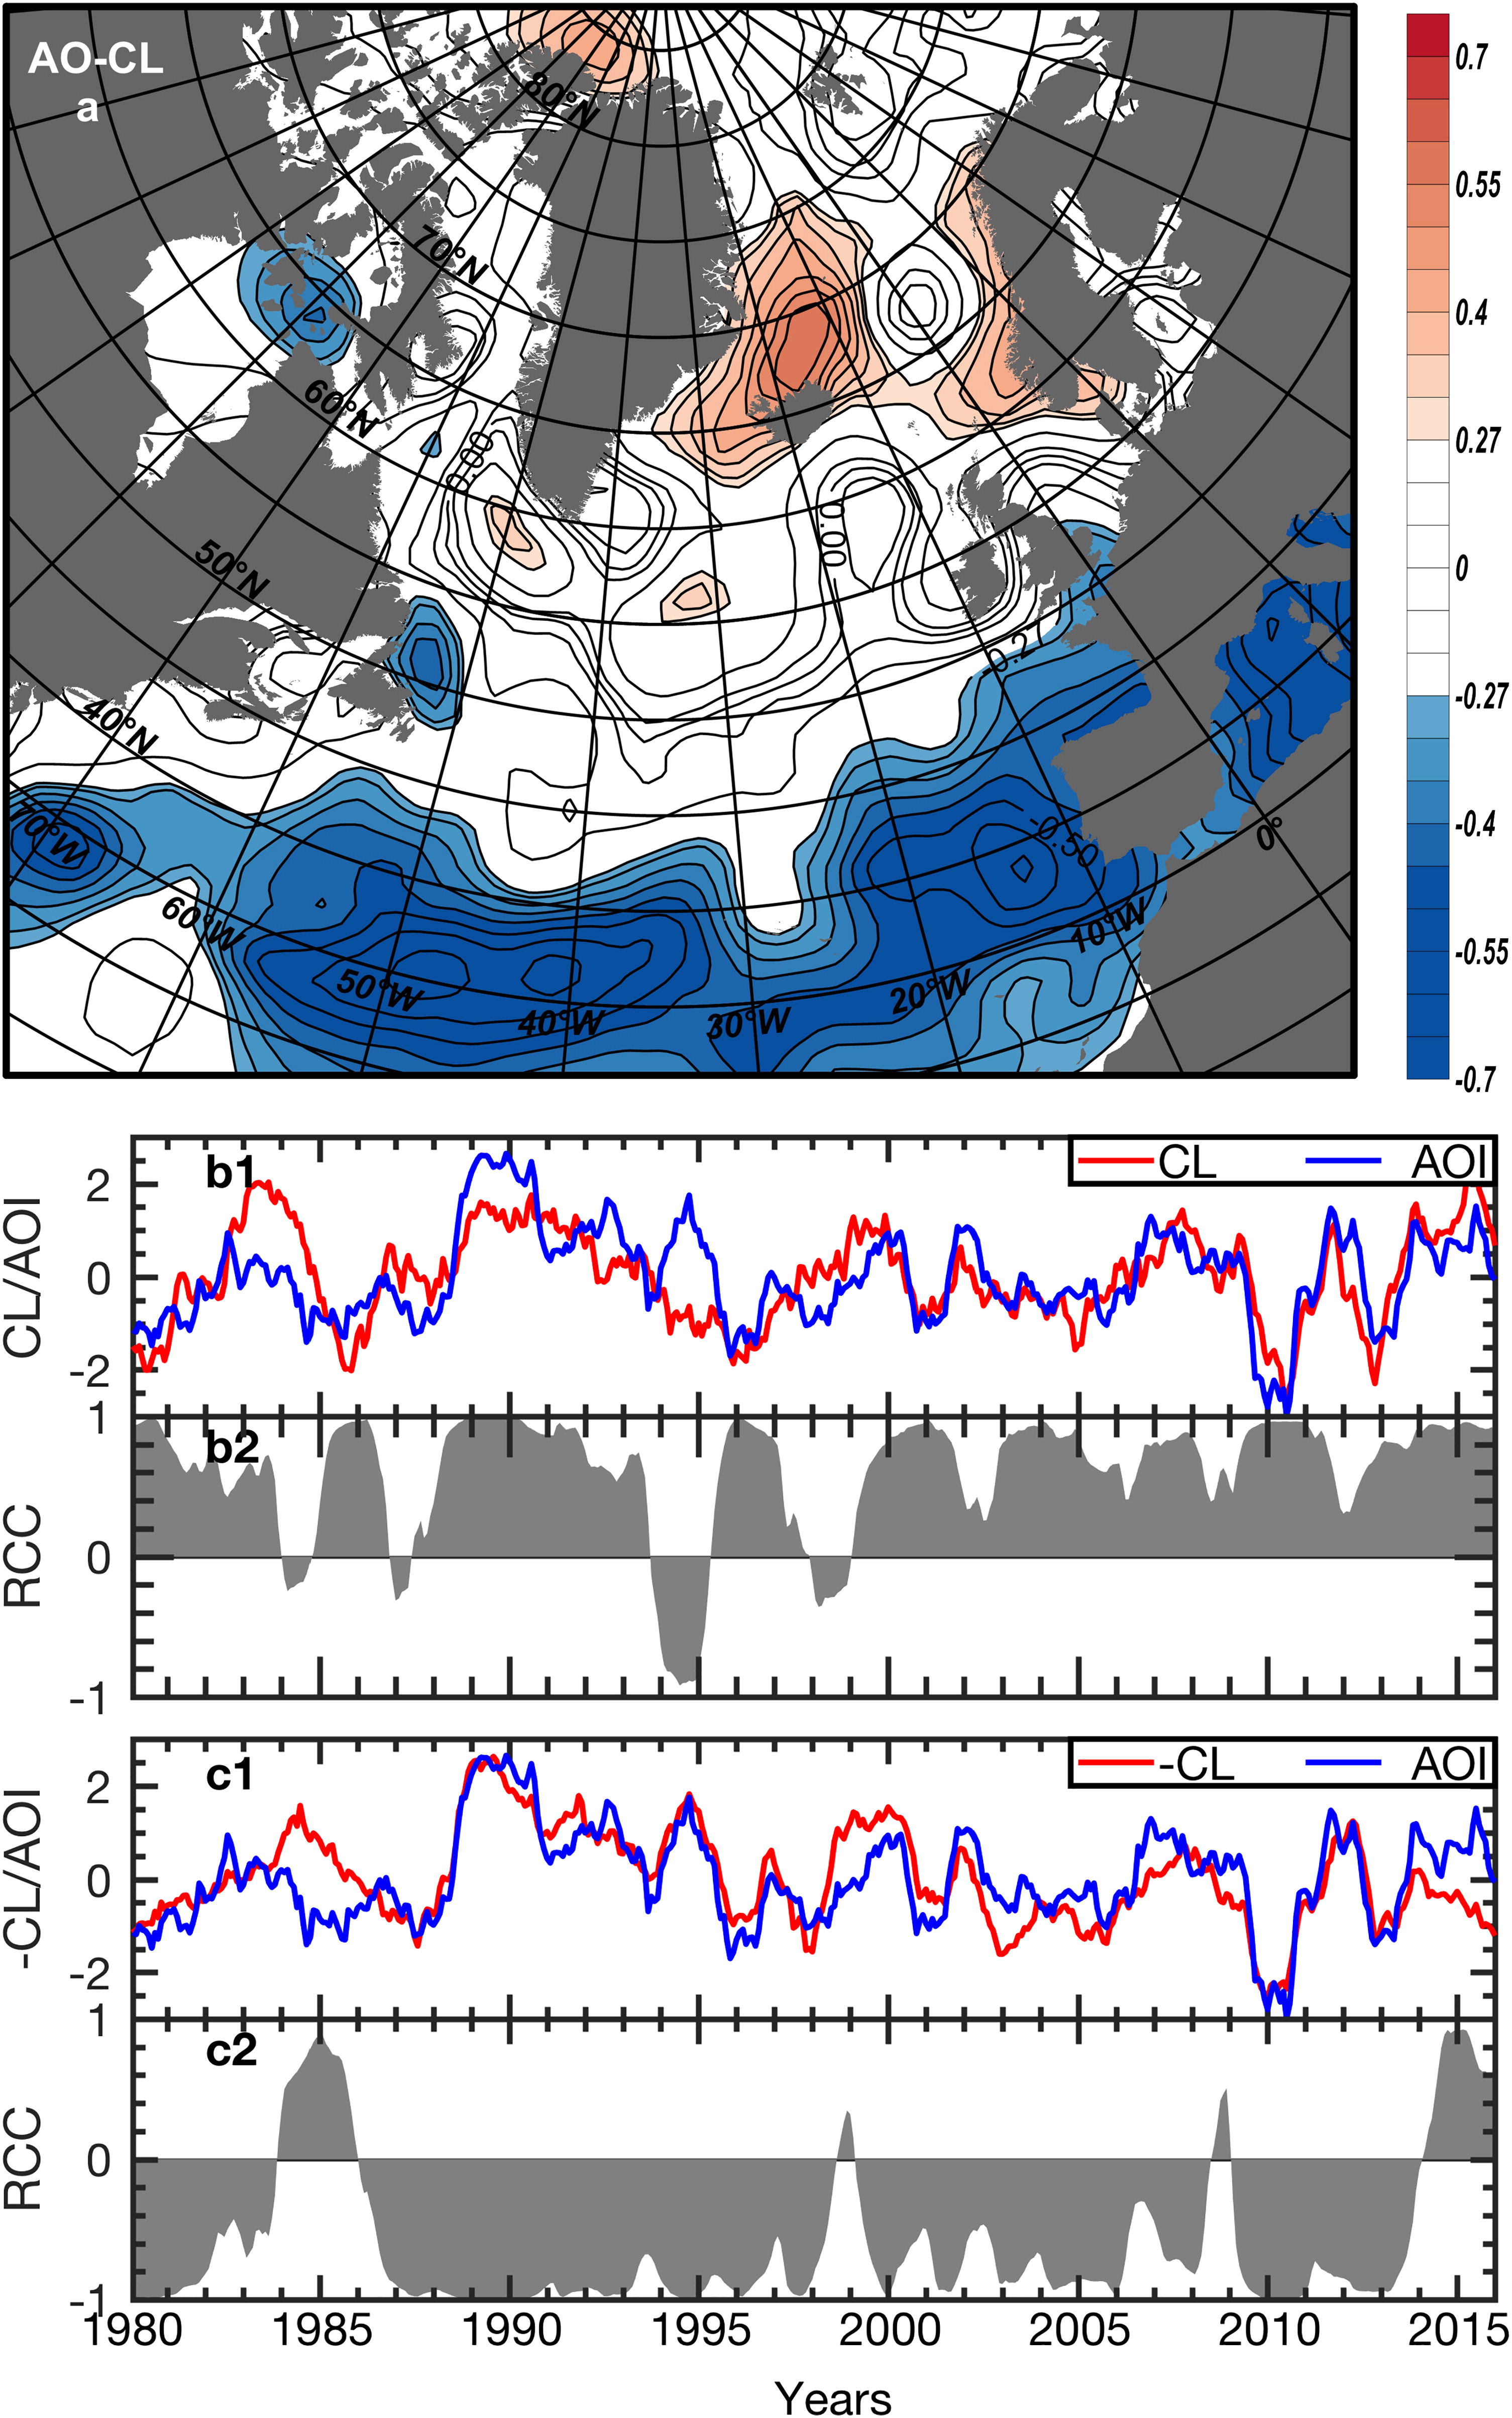
Fig. 4.
The same as Fig. 2 but for the total cloud coverage and AOI.
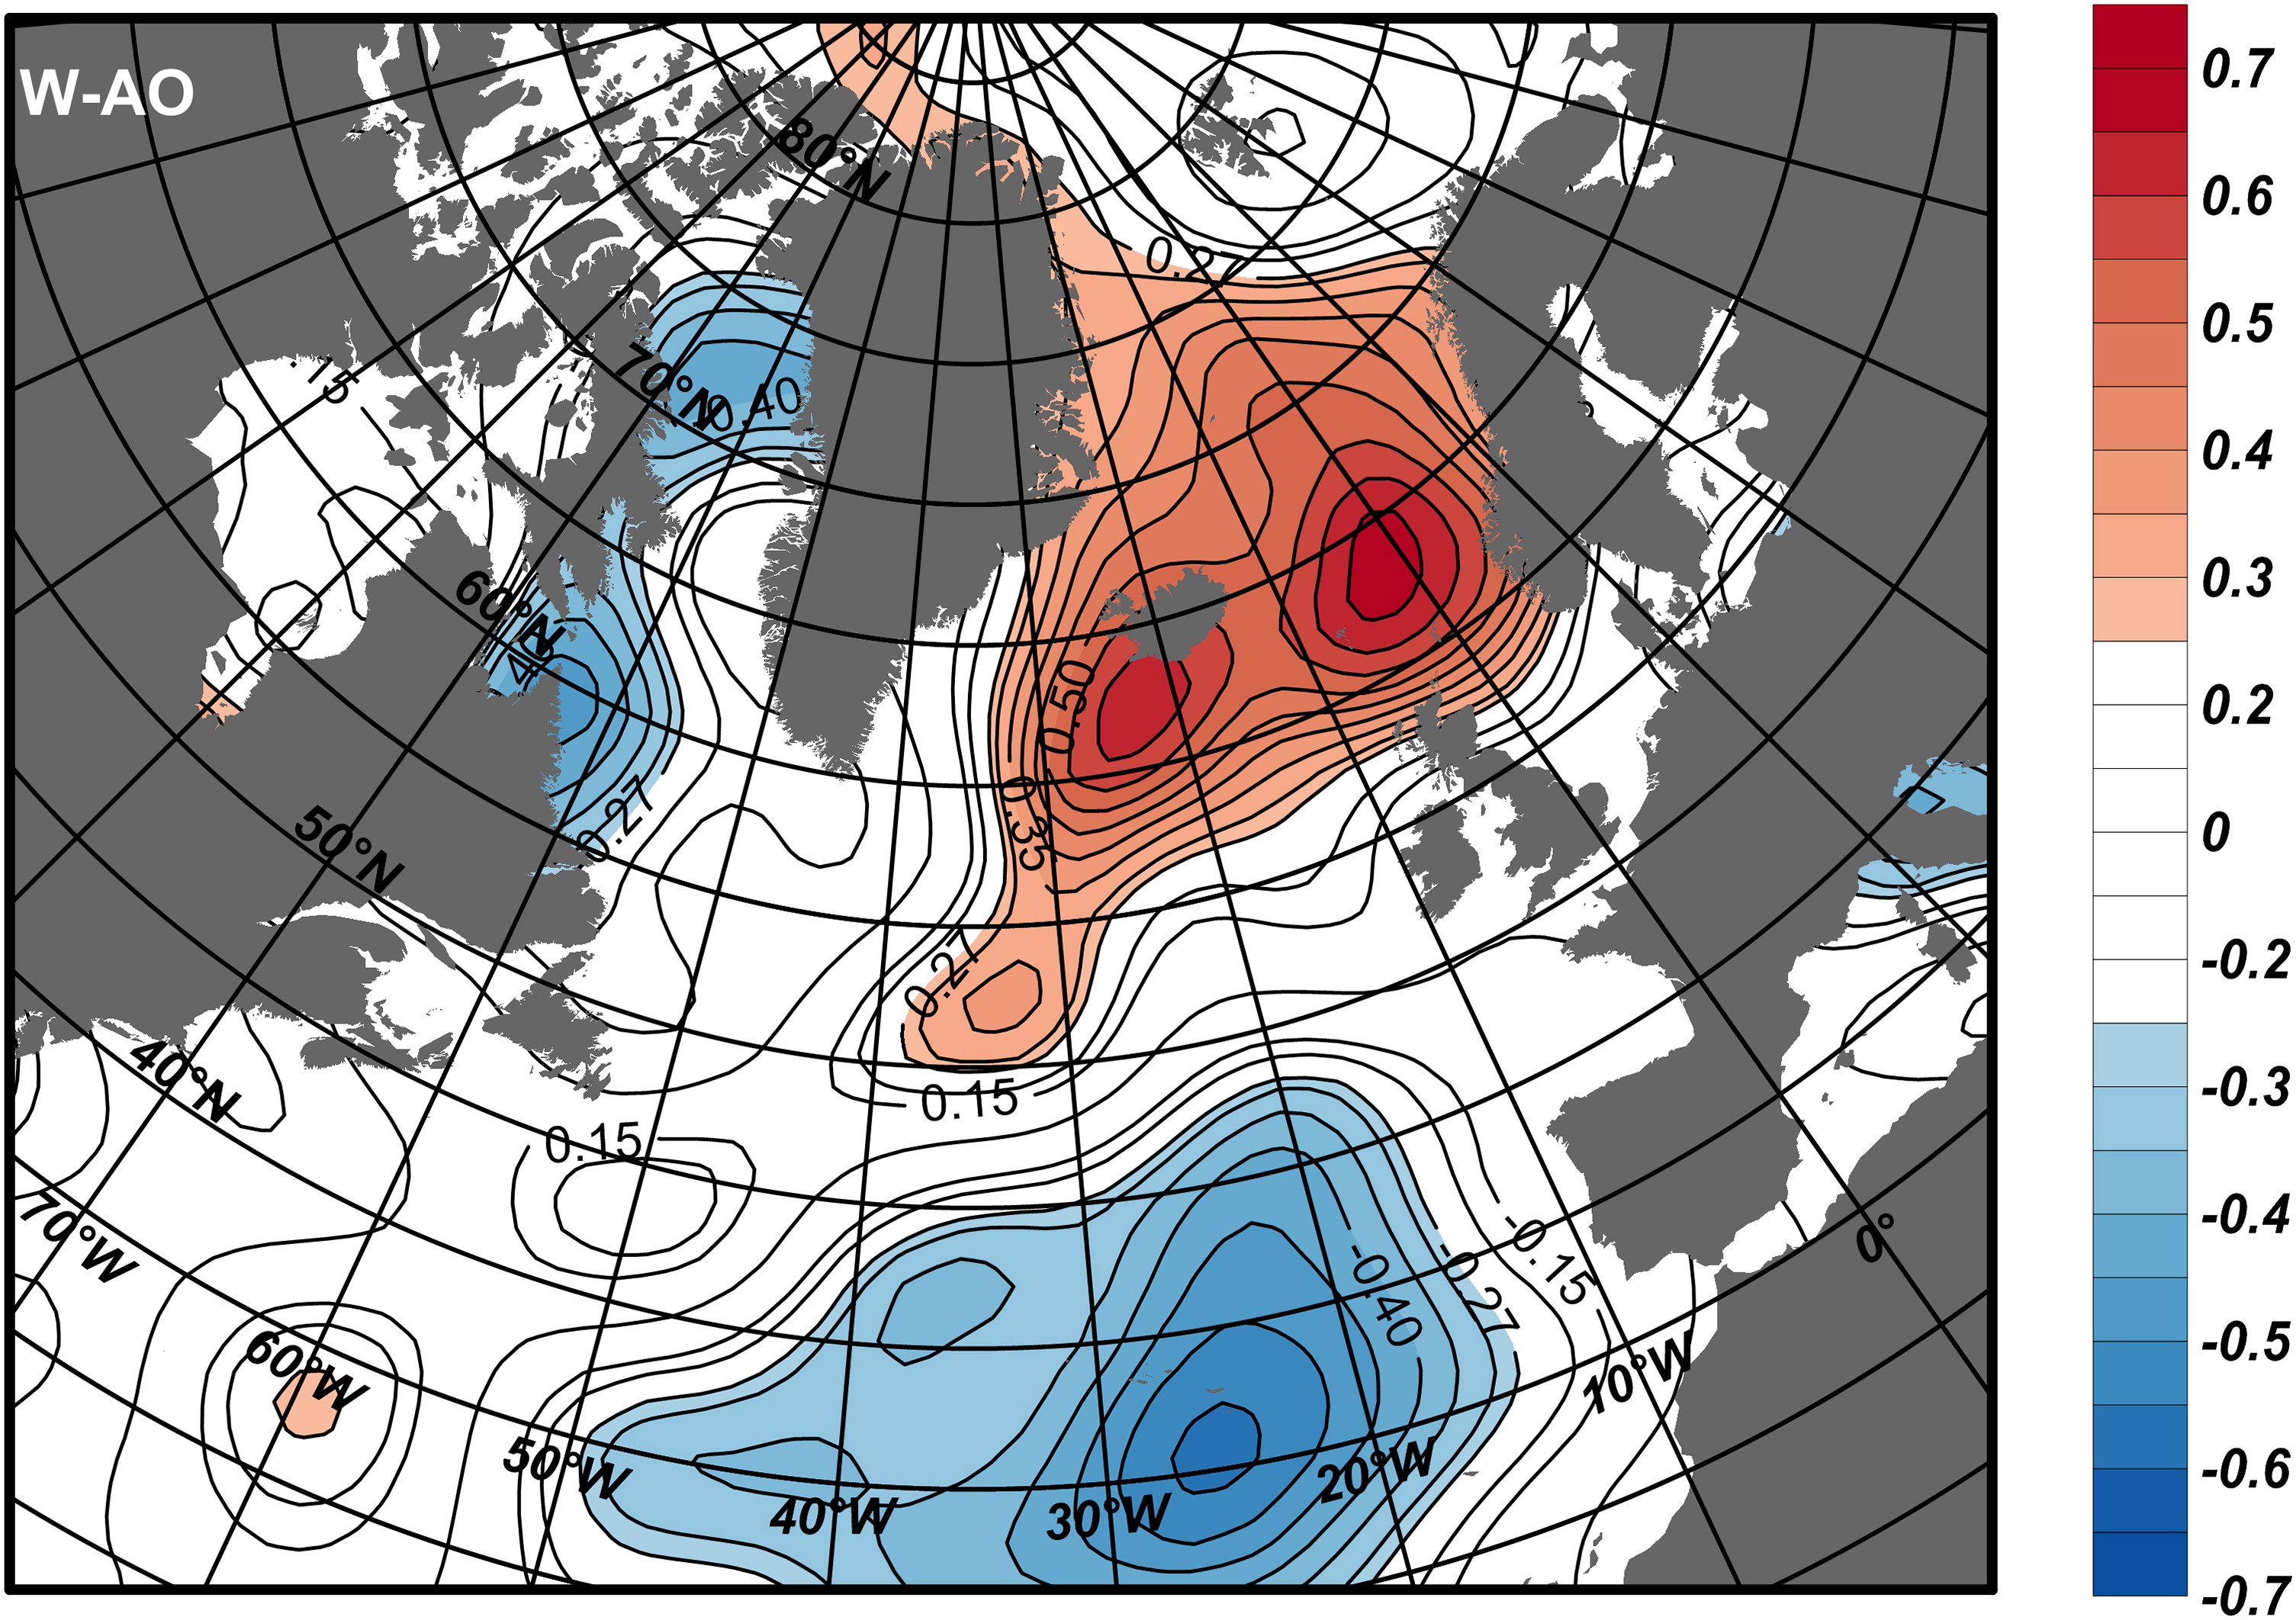
Fig. 5.
Spatial distribution of the correlation coefficient of upward airflow speed with the AOI.
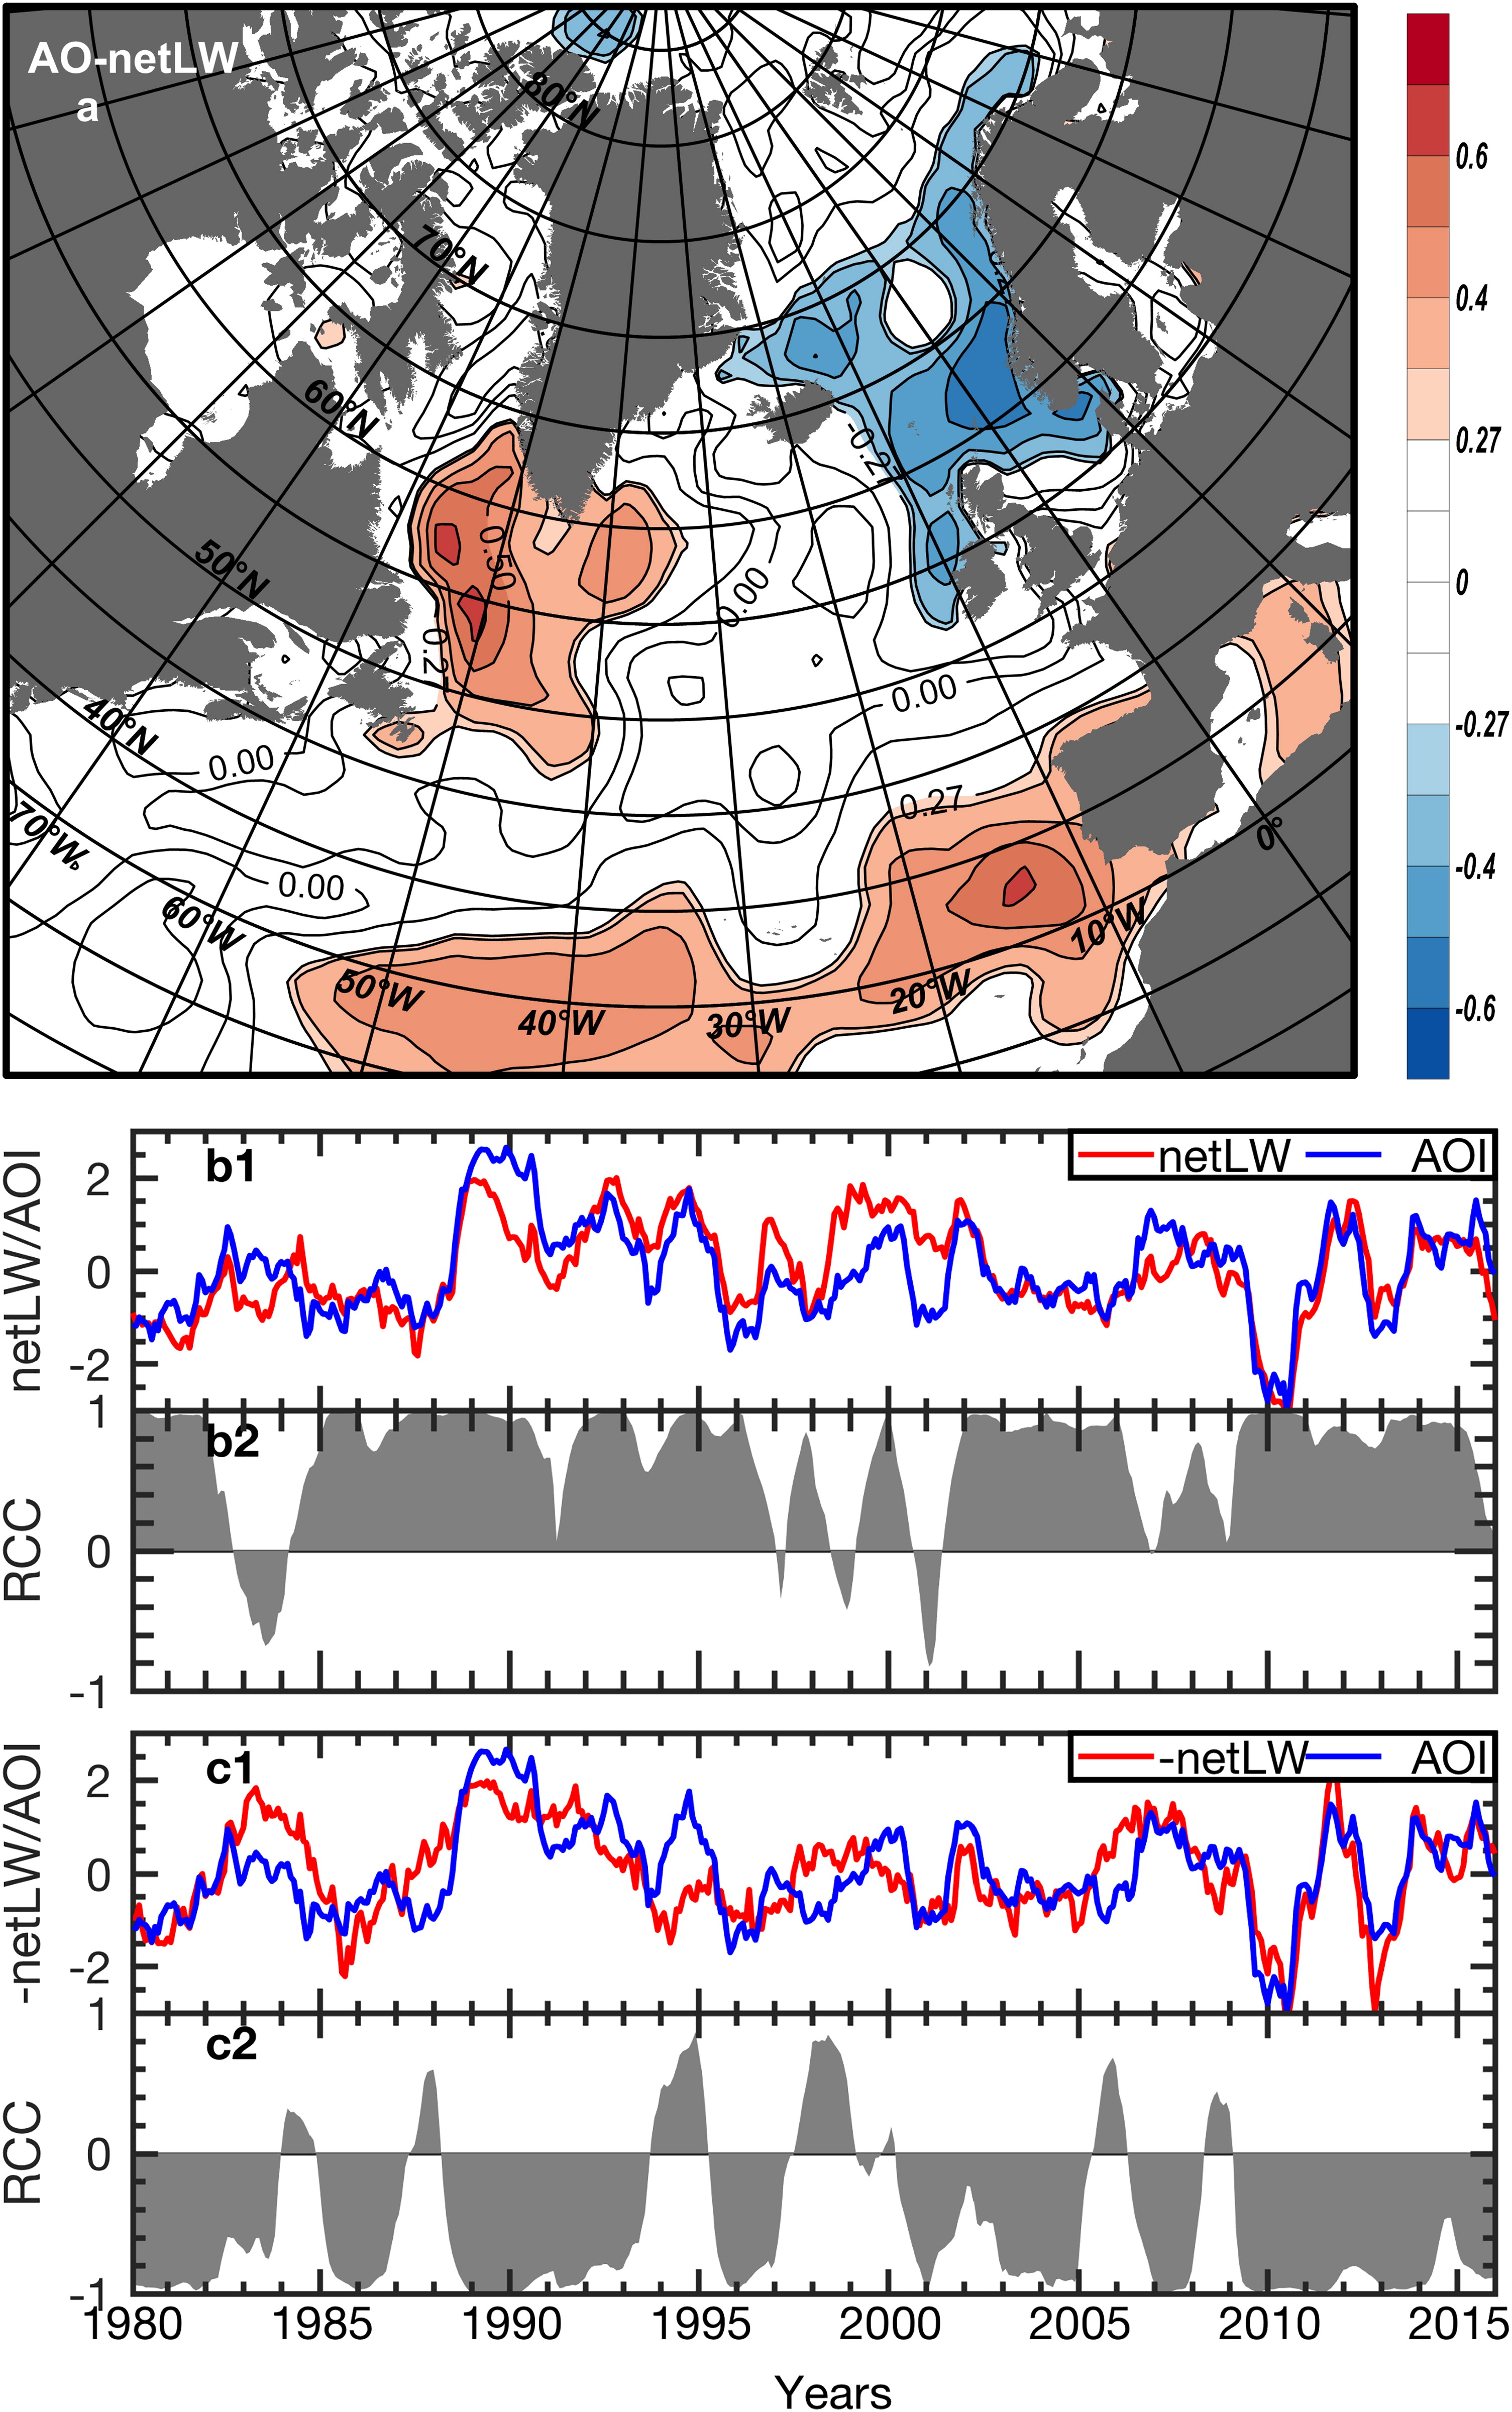
Fig. 6.
The same as Fig. 2 but for the net long-wave radiation and the AOI.
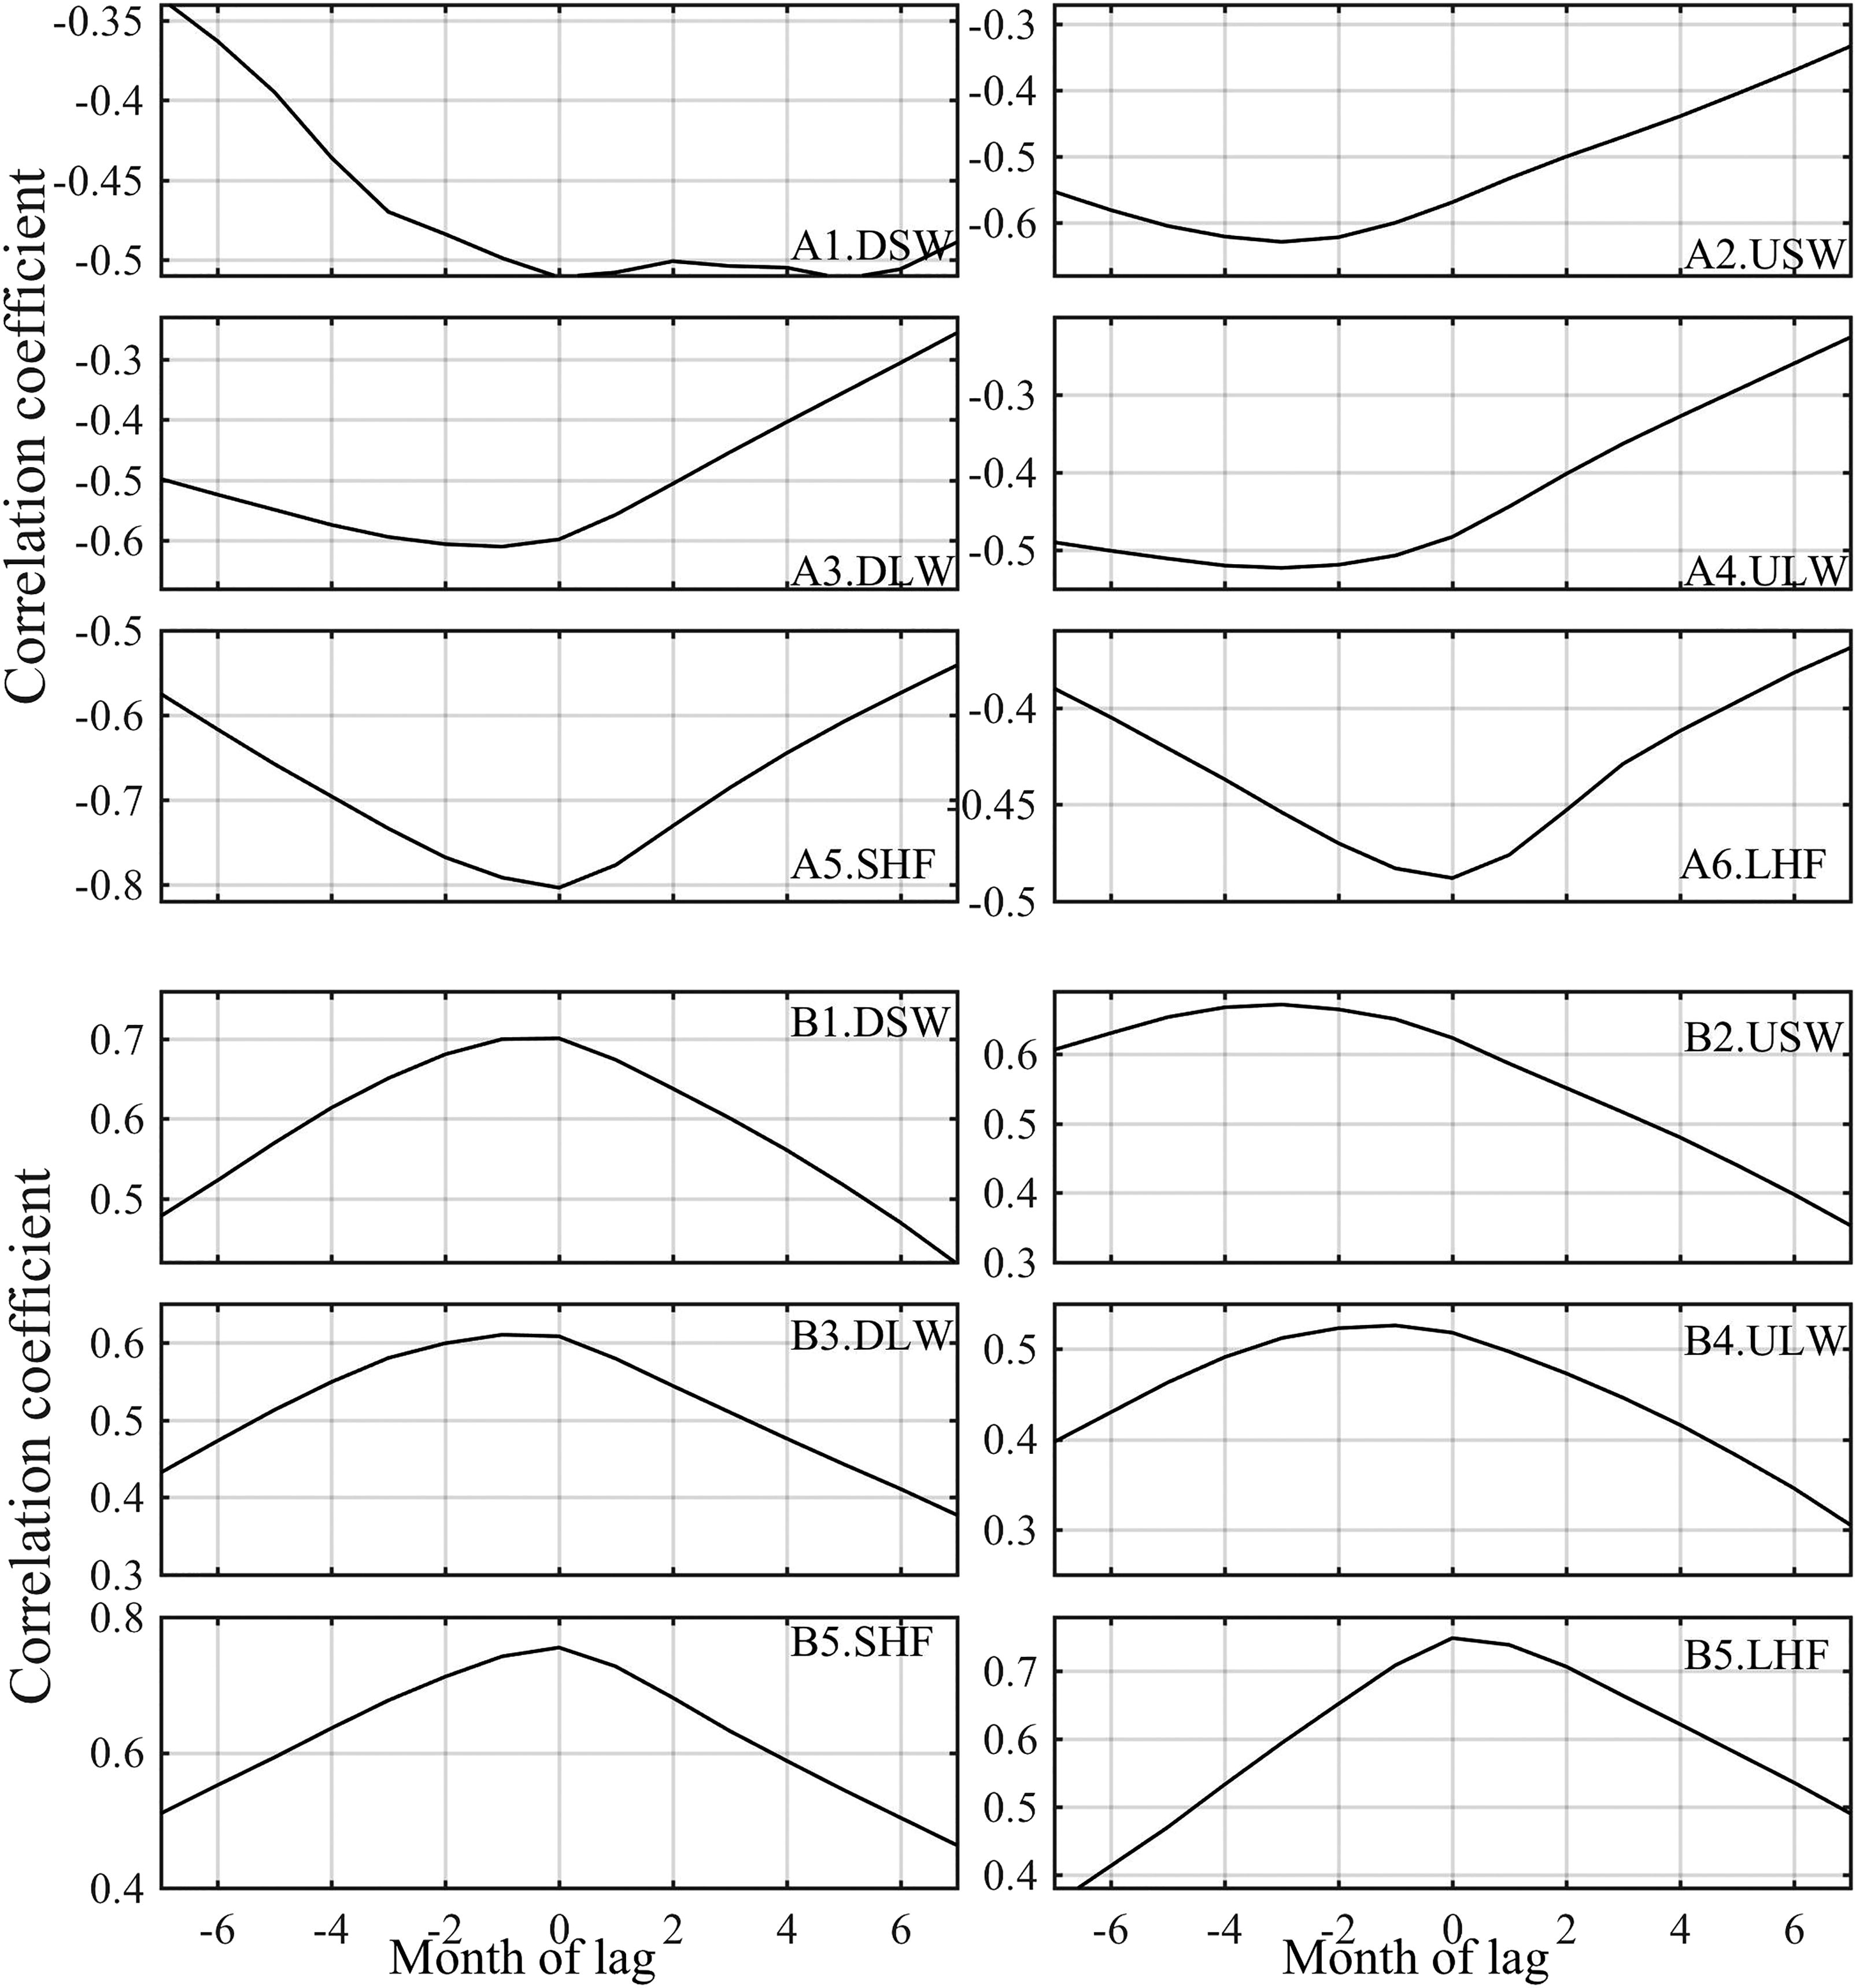
Fig. 7.
The correlation as a function of lag between heat fluxes and the AOI for positive (a) and negative (b) HCRs, respectively. DSW and USW are downward and upward shortwave radiations, DLW and ULW are downward and upward long-wave radiations, SHF and LHF and for sensible and latent heat fluxes.
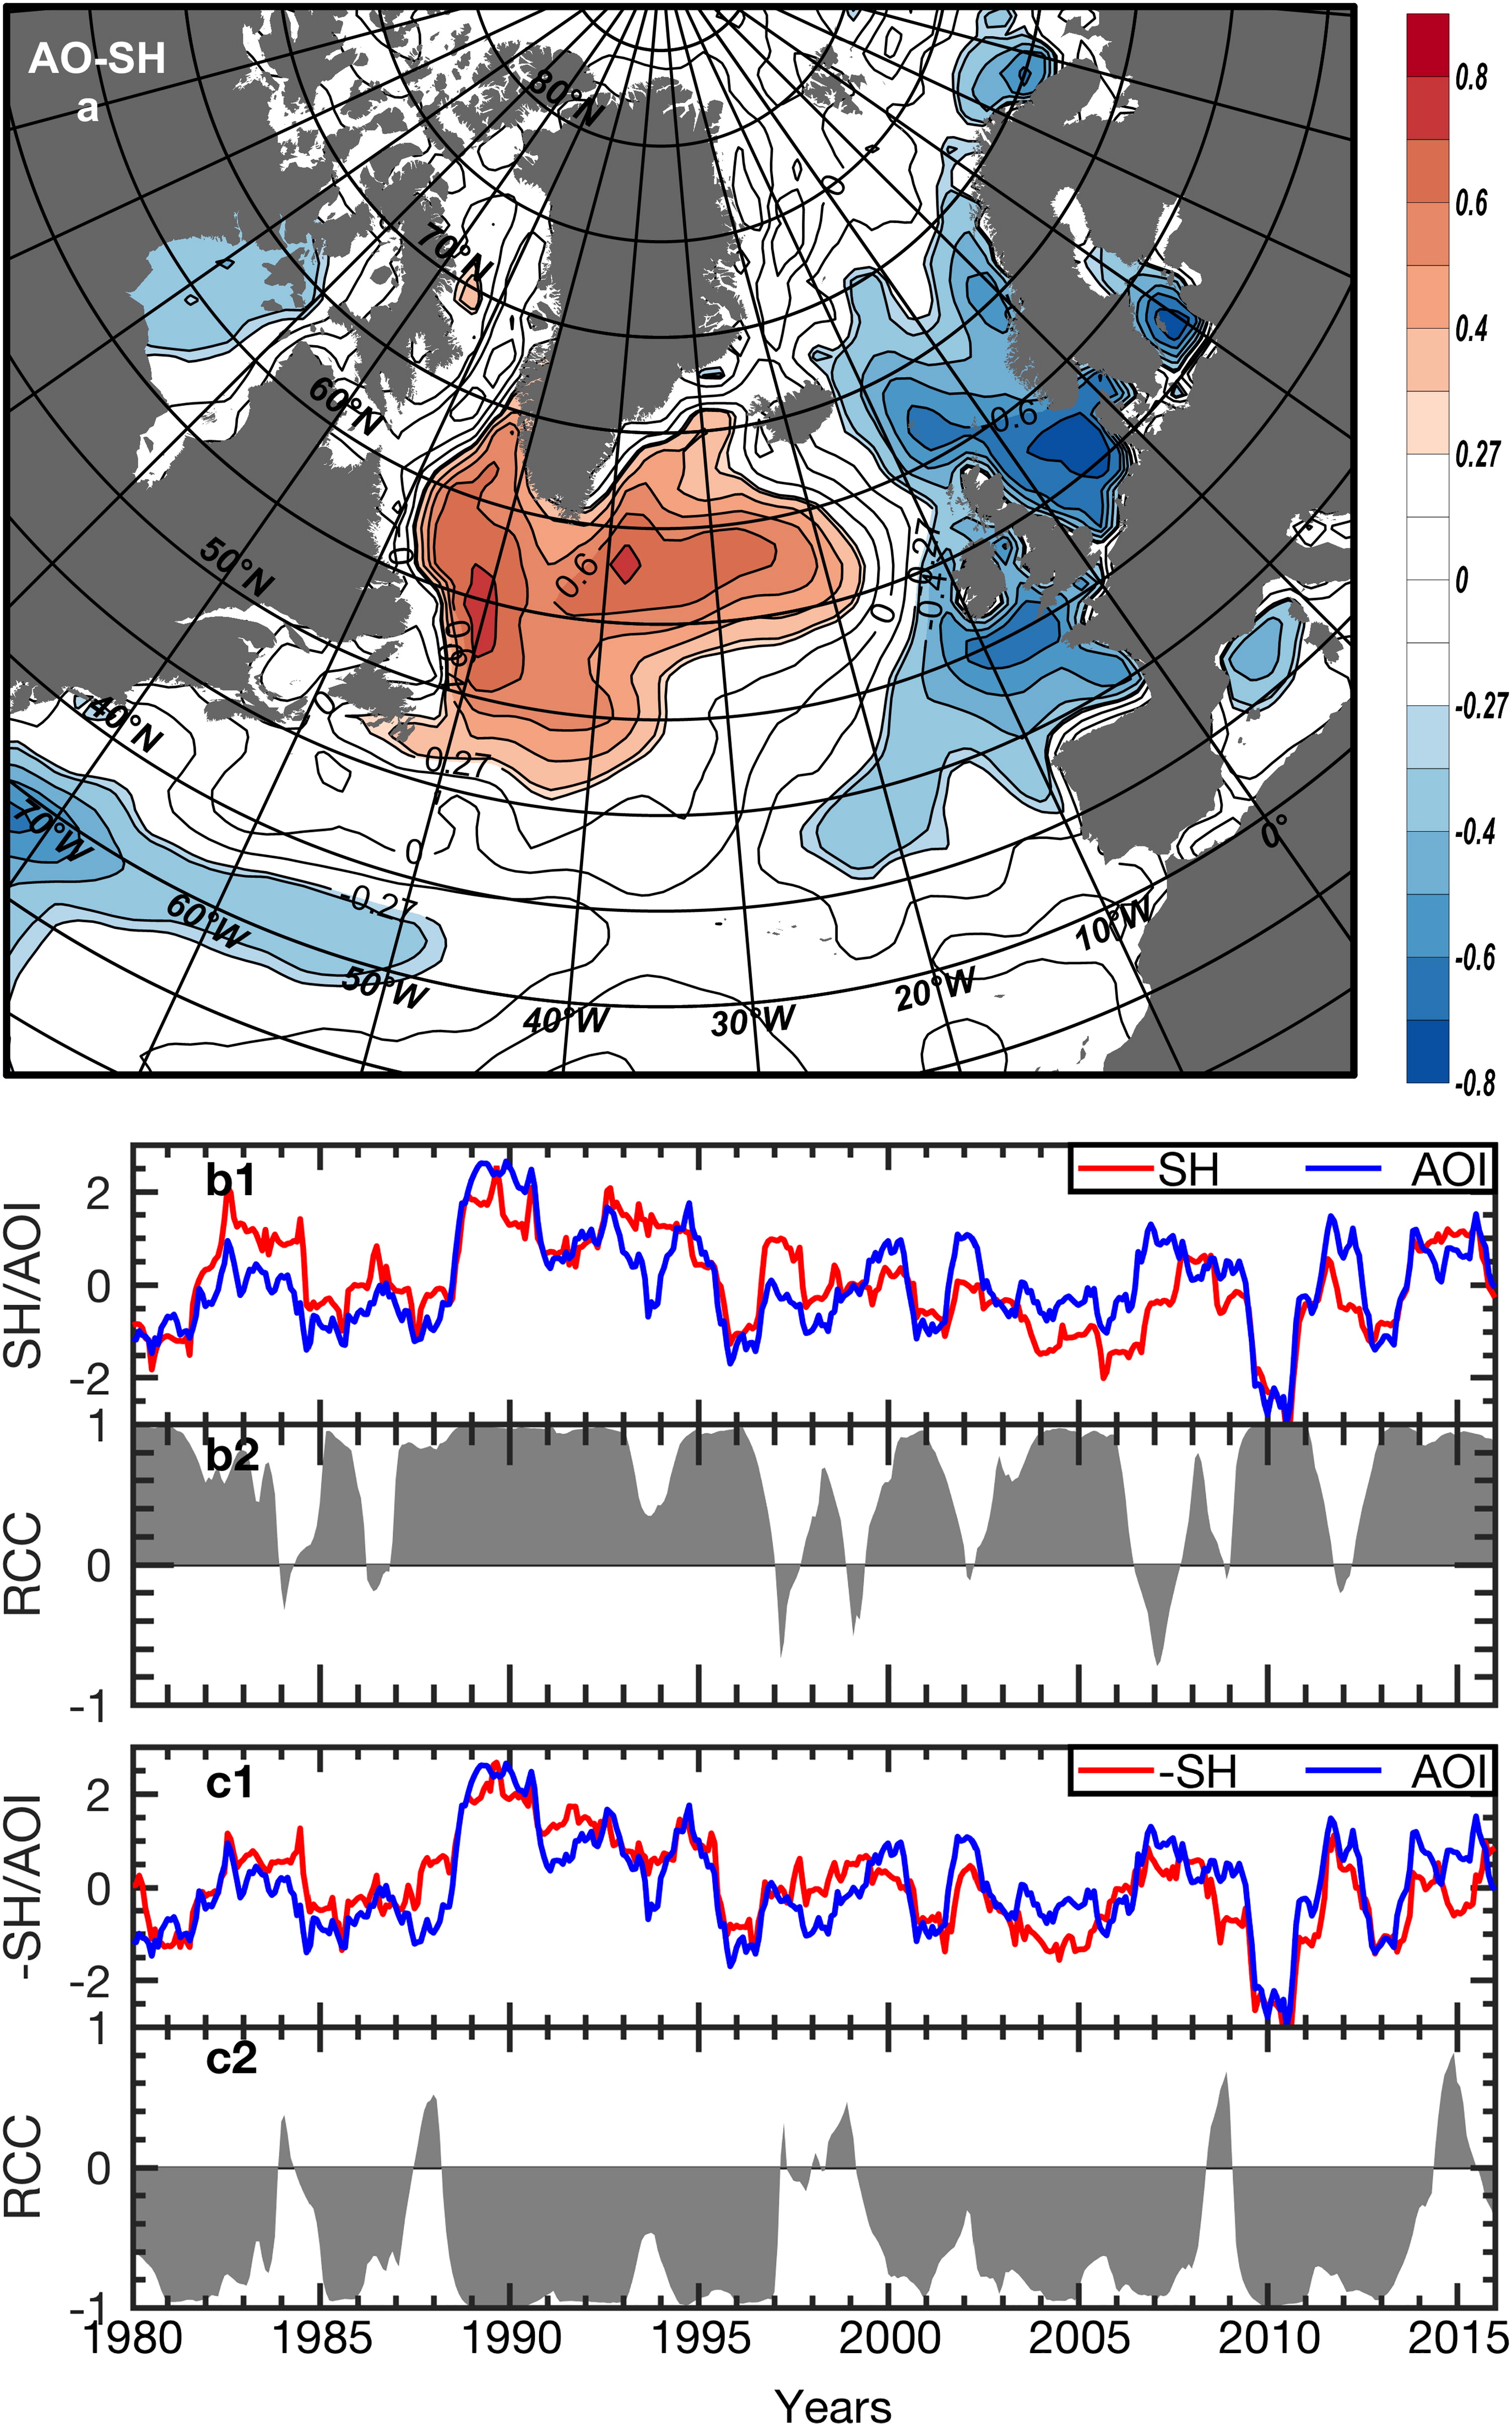
Fig. 8.
The same as Fig. 2 but for sensible heat and the AOI.
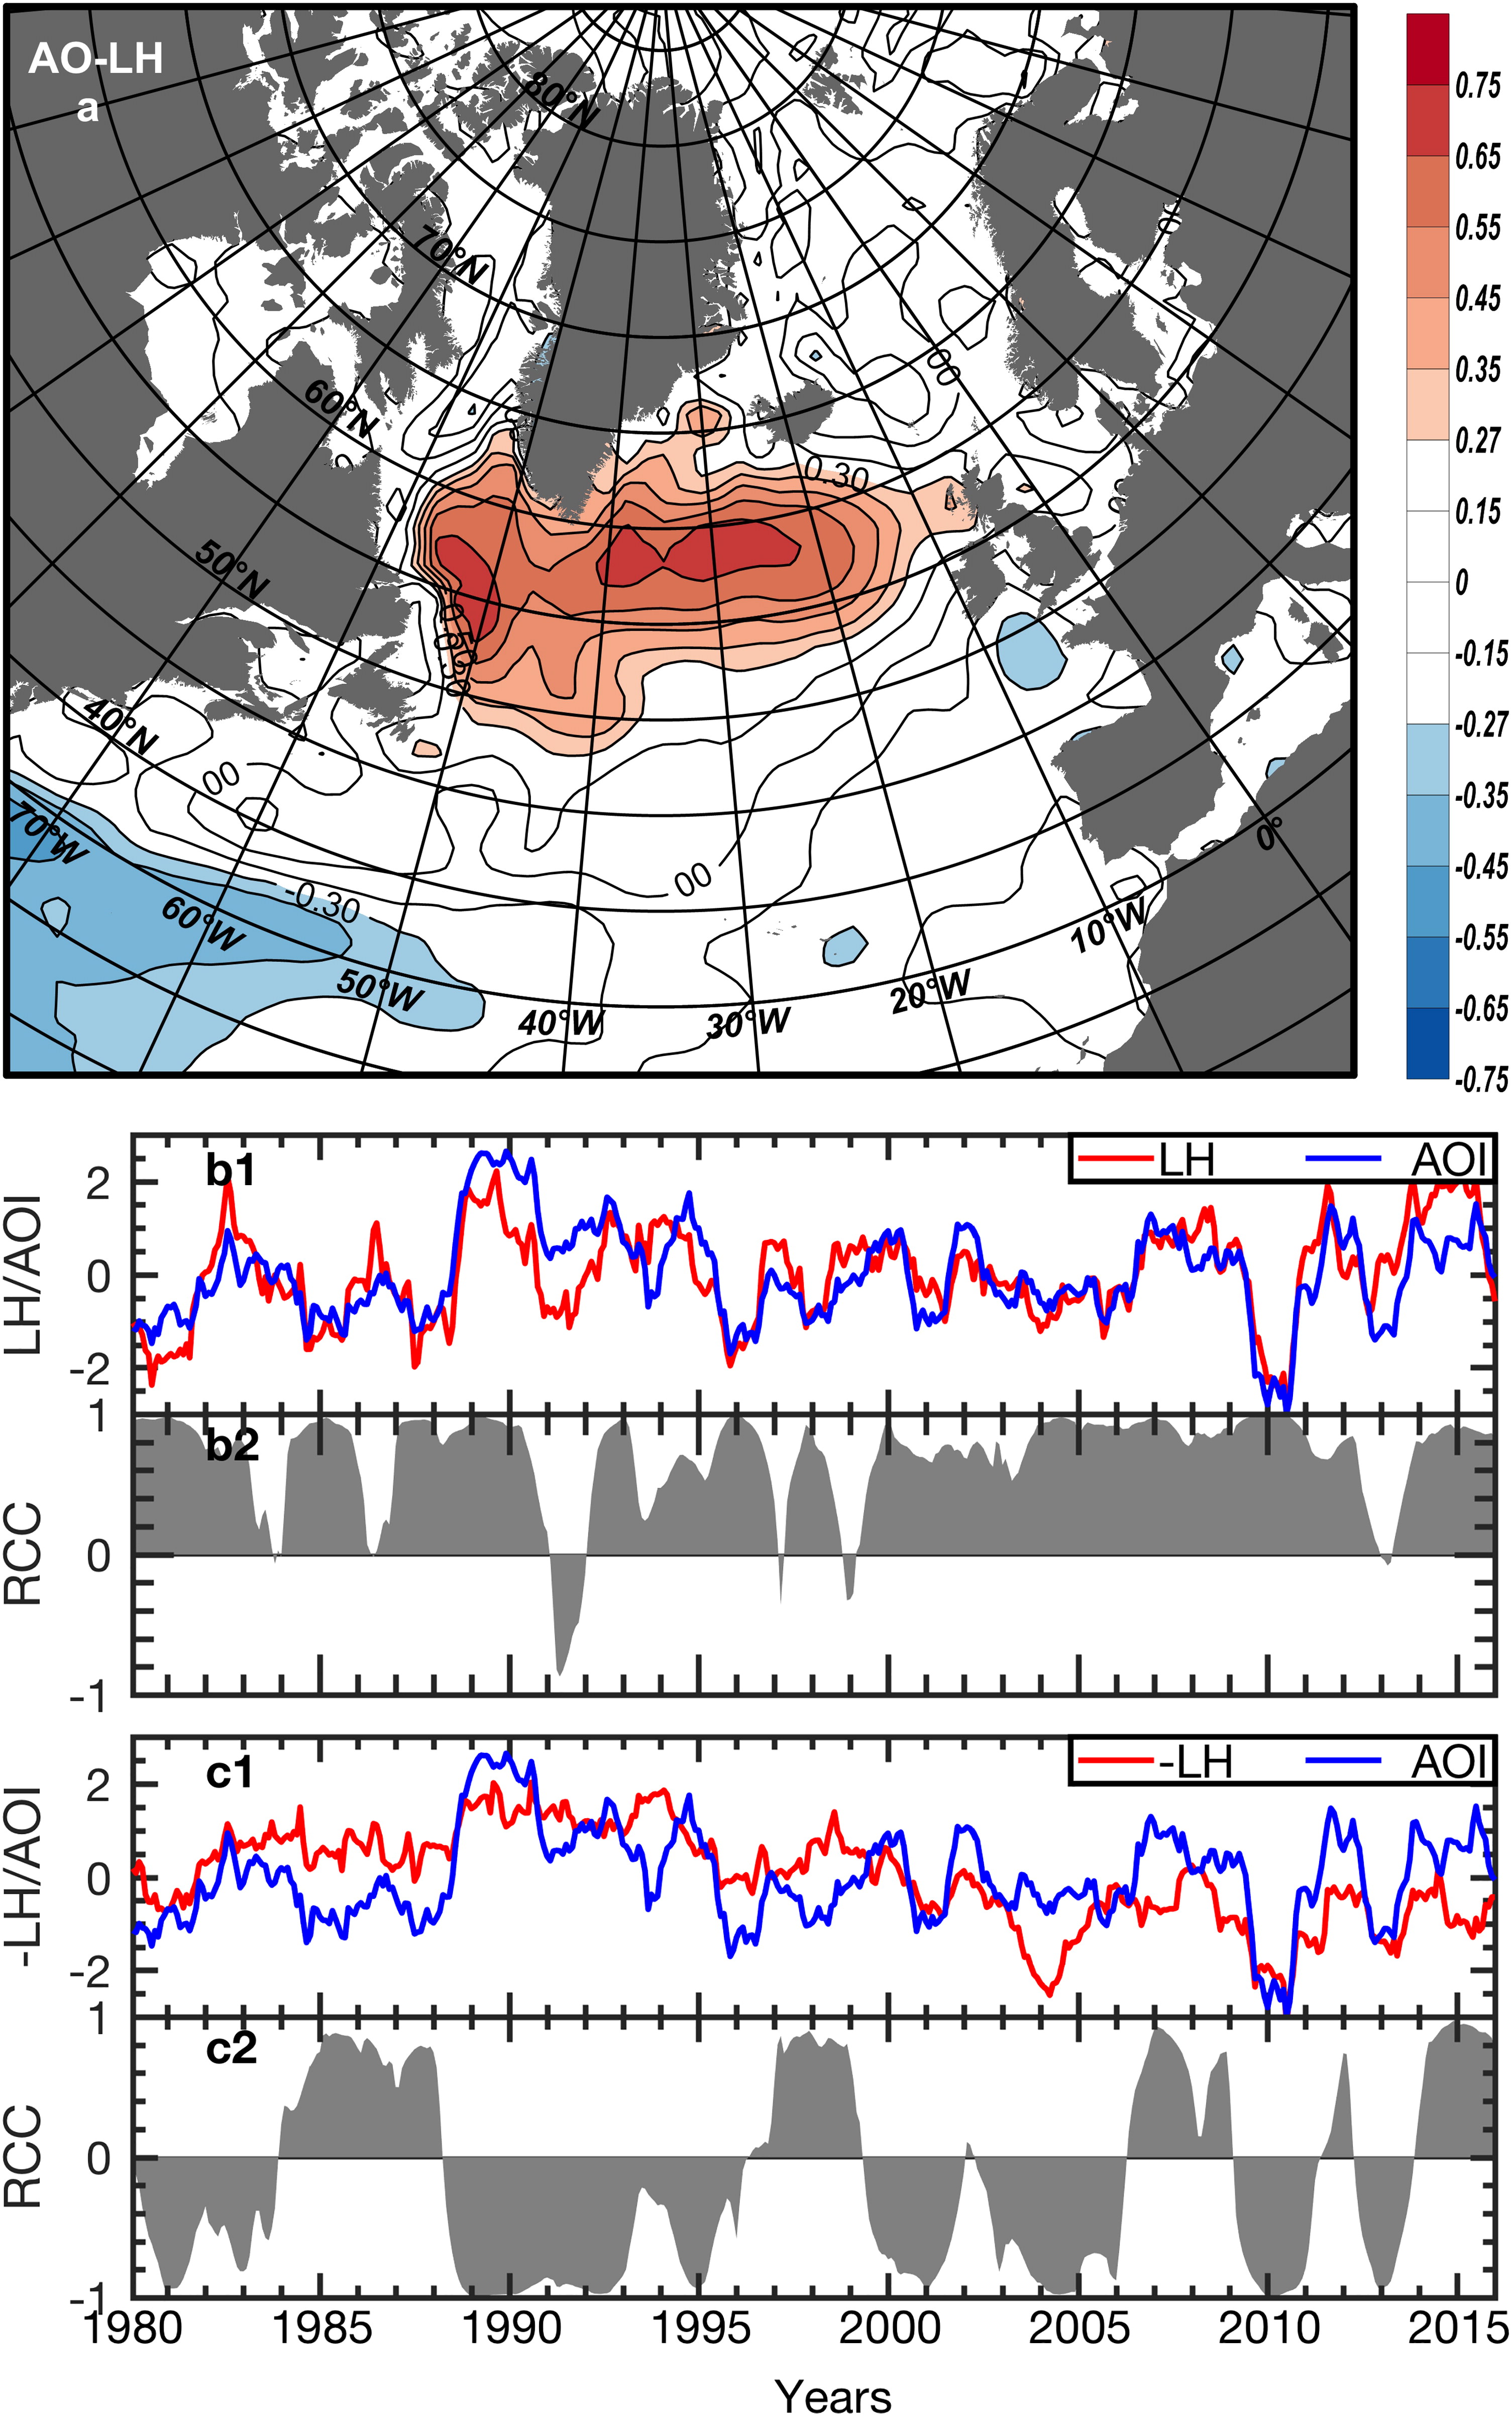
Fig. 9.
The same as Fig. 2 but for latent heat and the AOI.
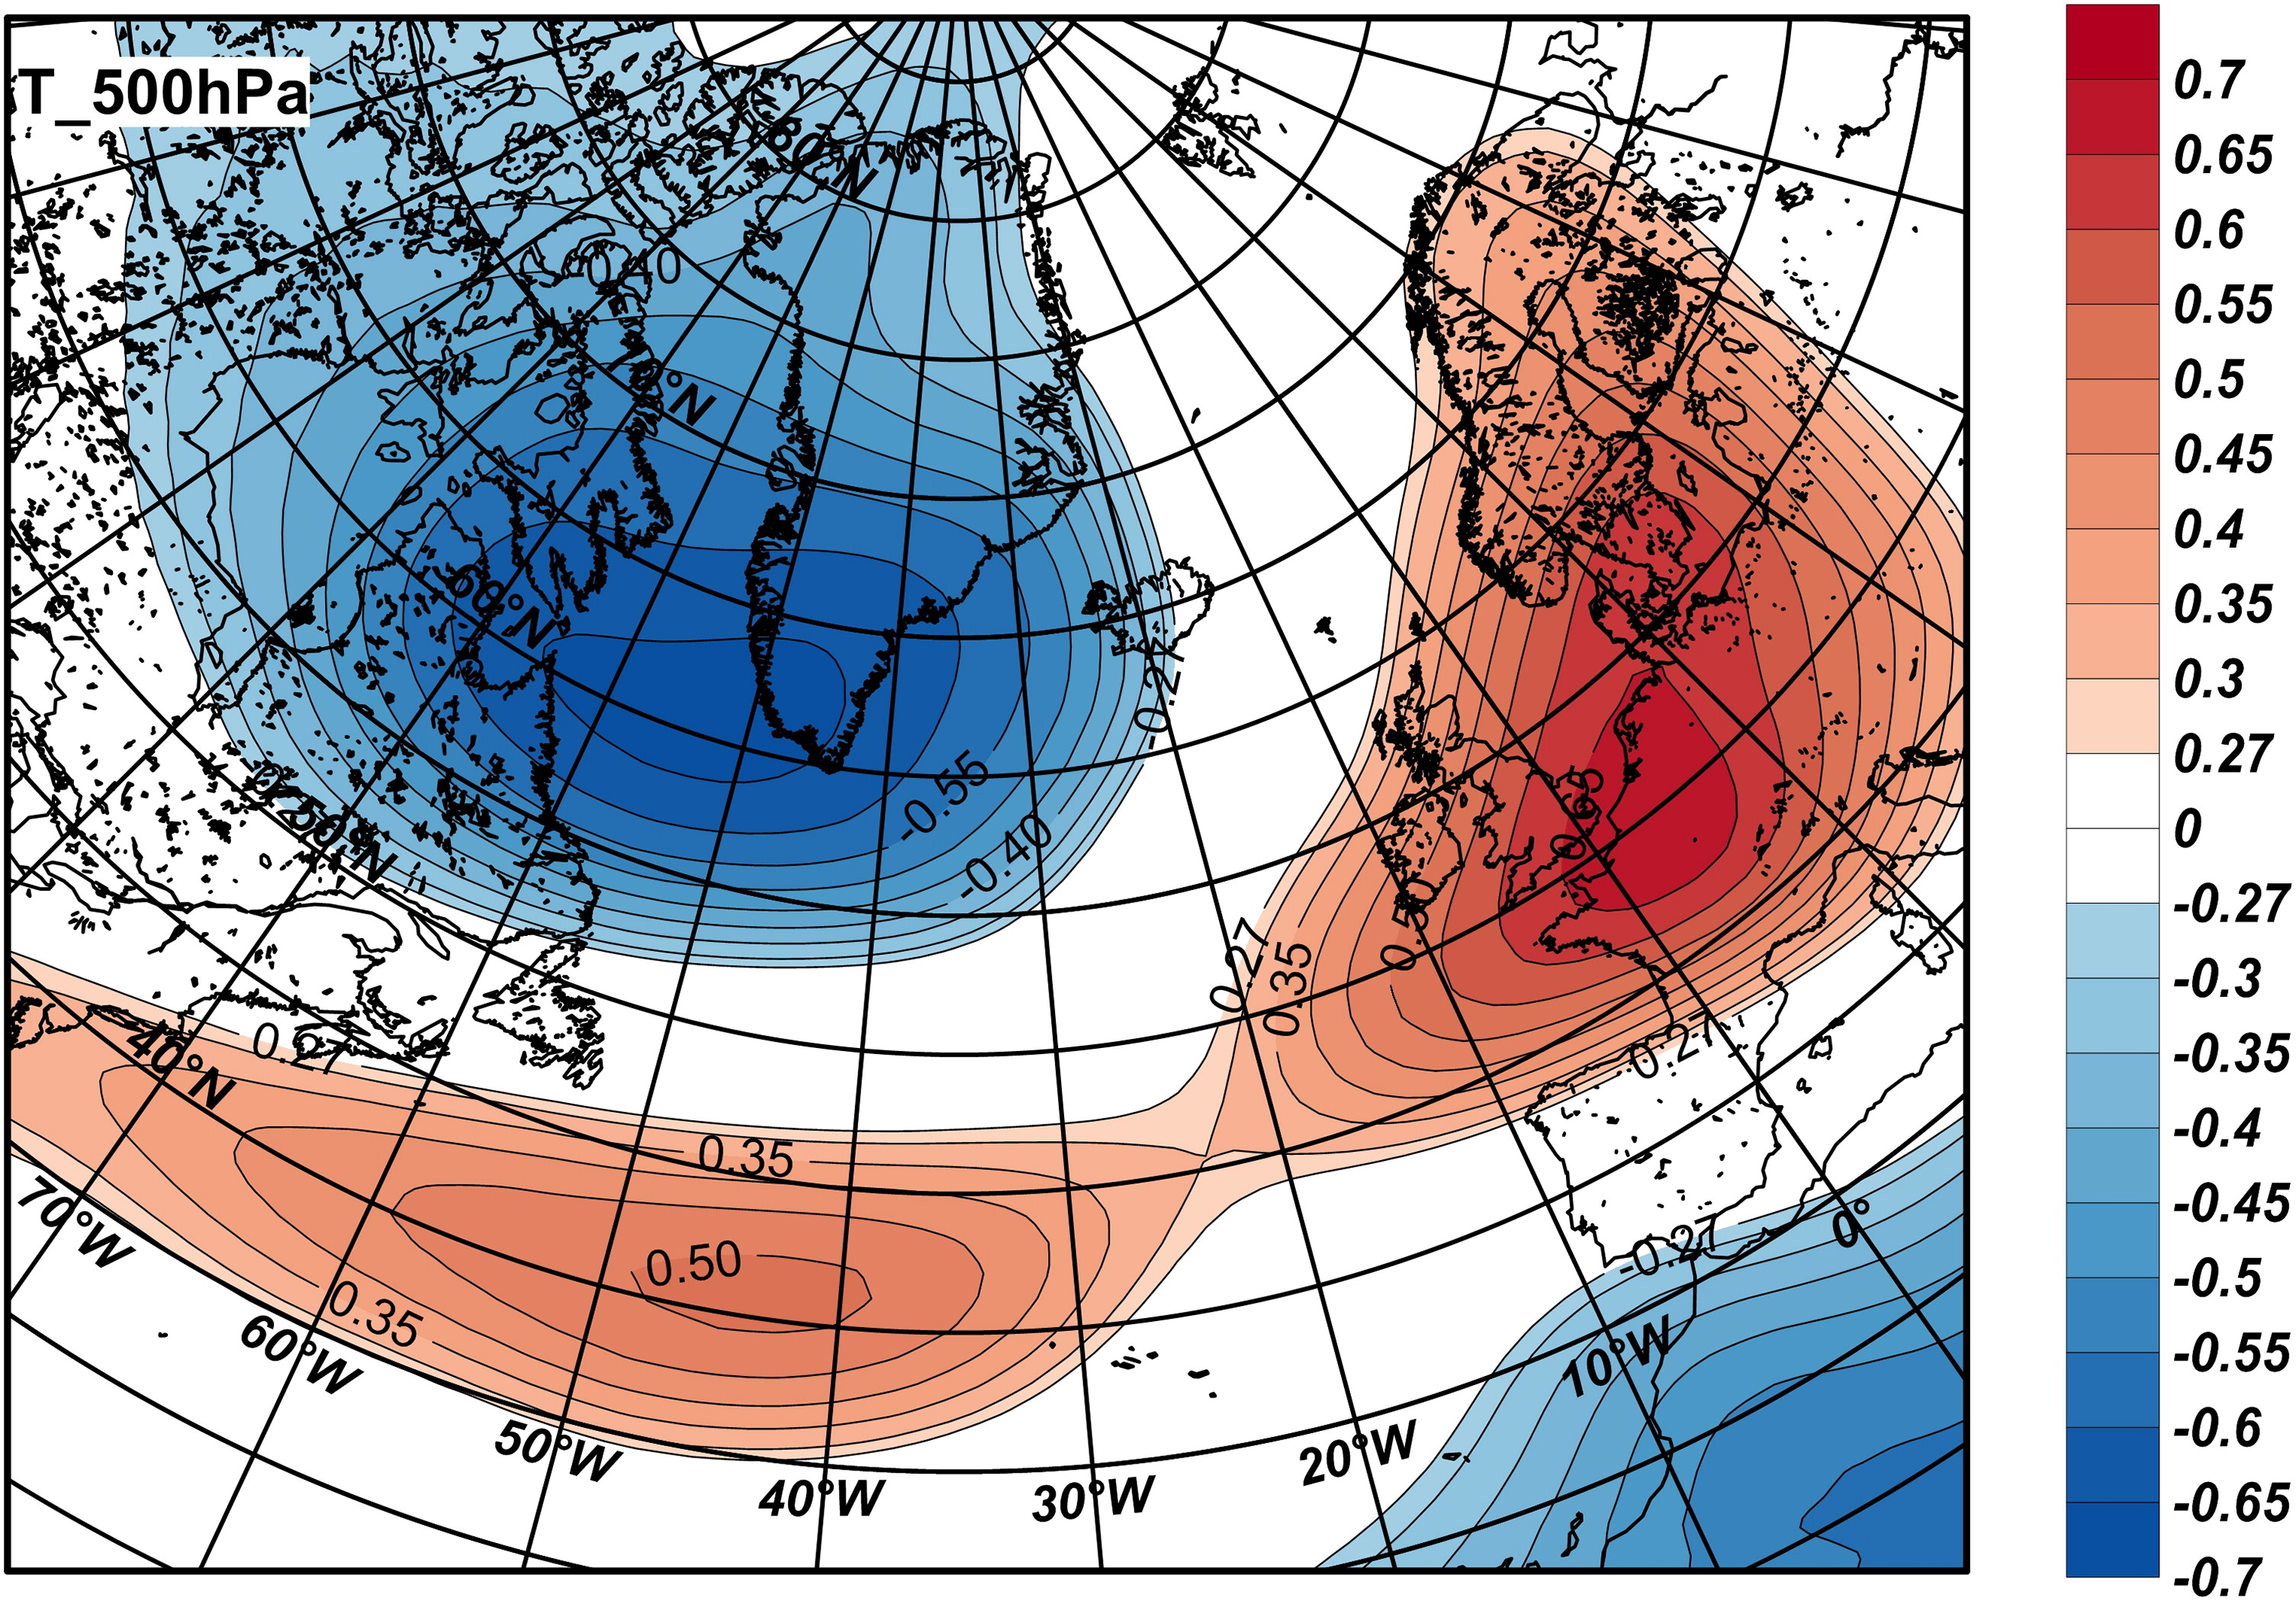
Fig. 10.
Correlation coefficient of air temperature at 500 hPa and the AOI.
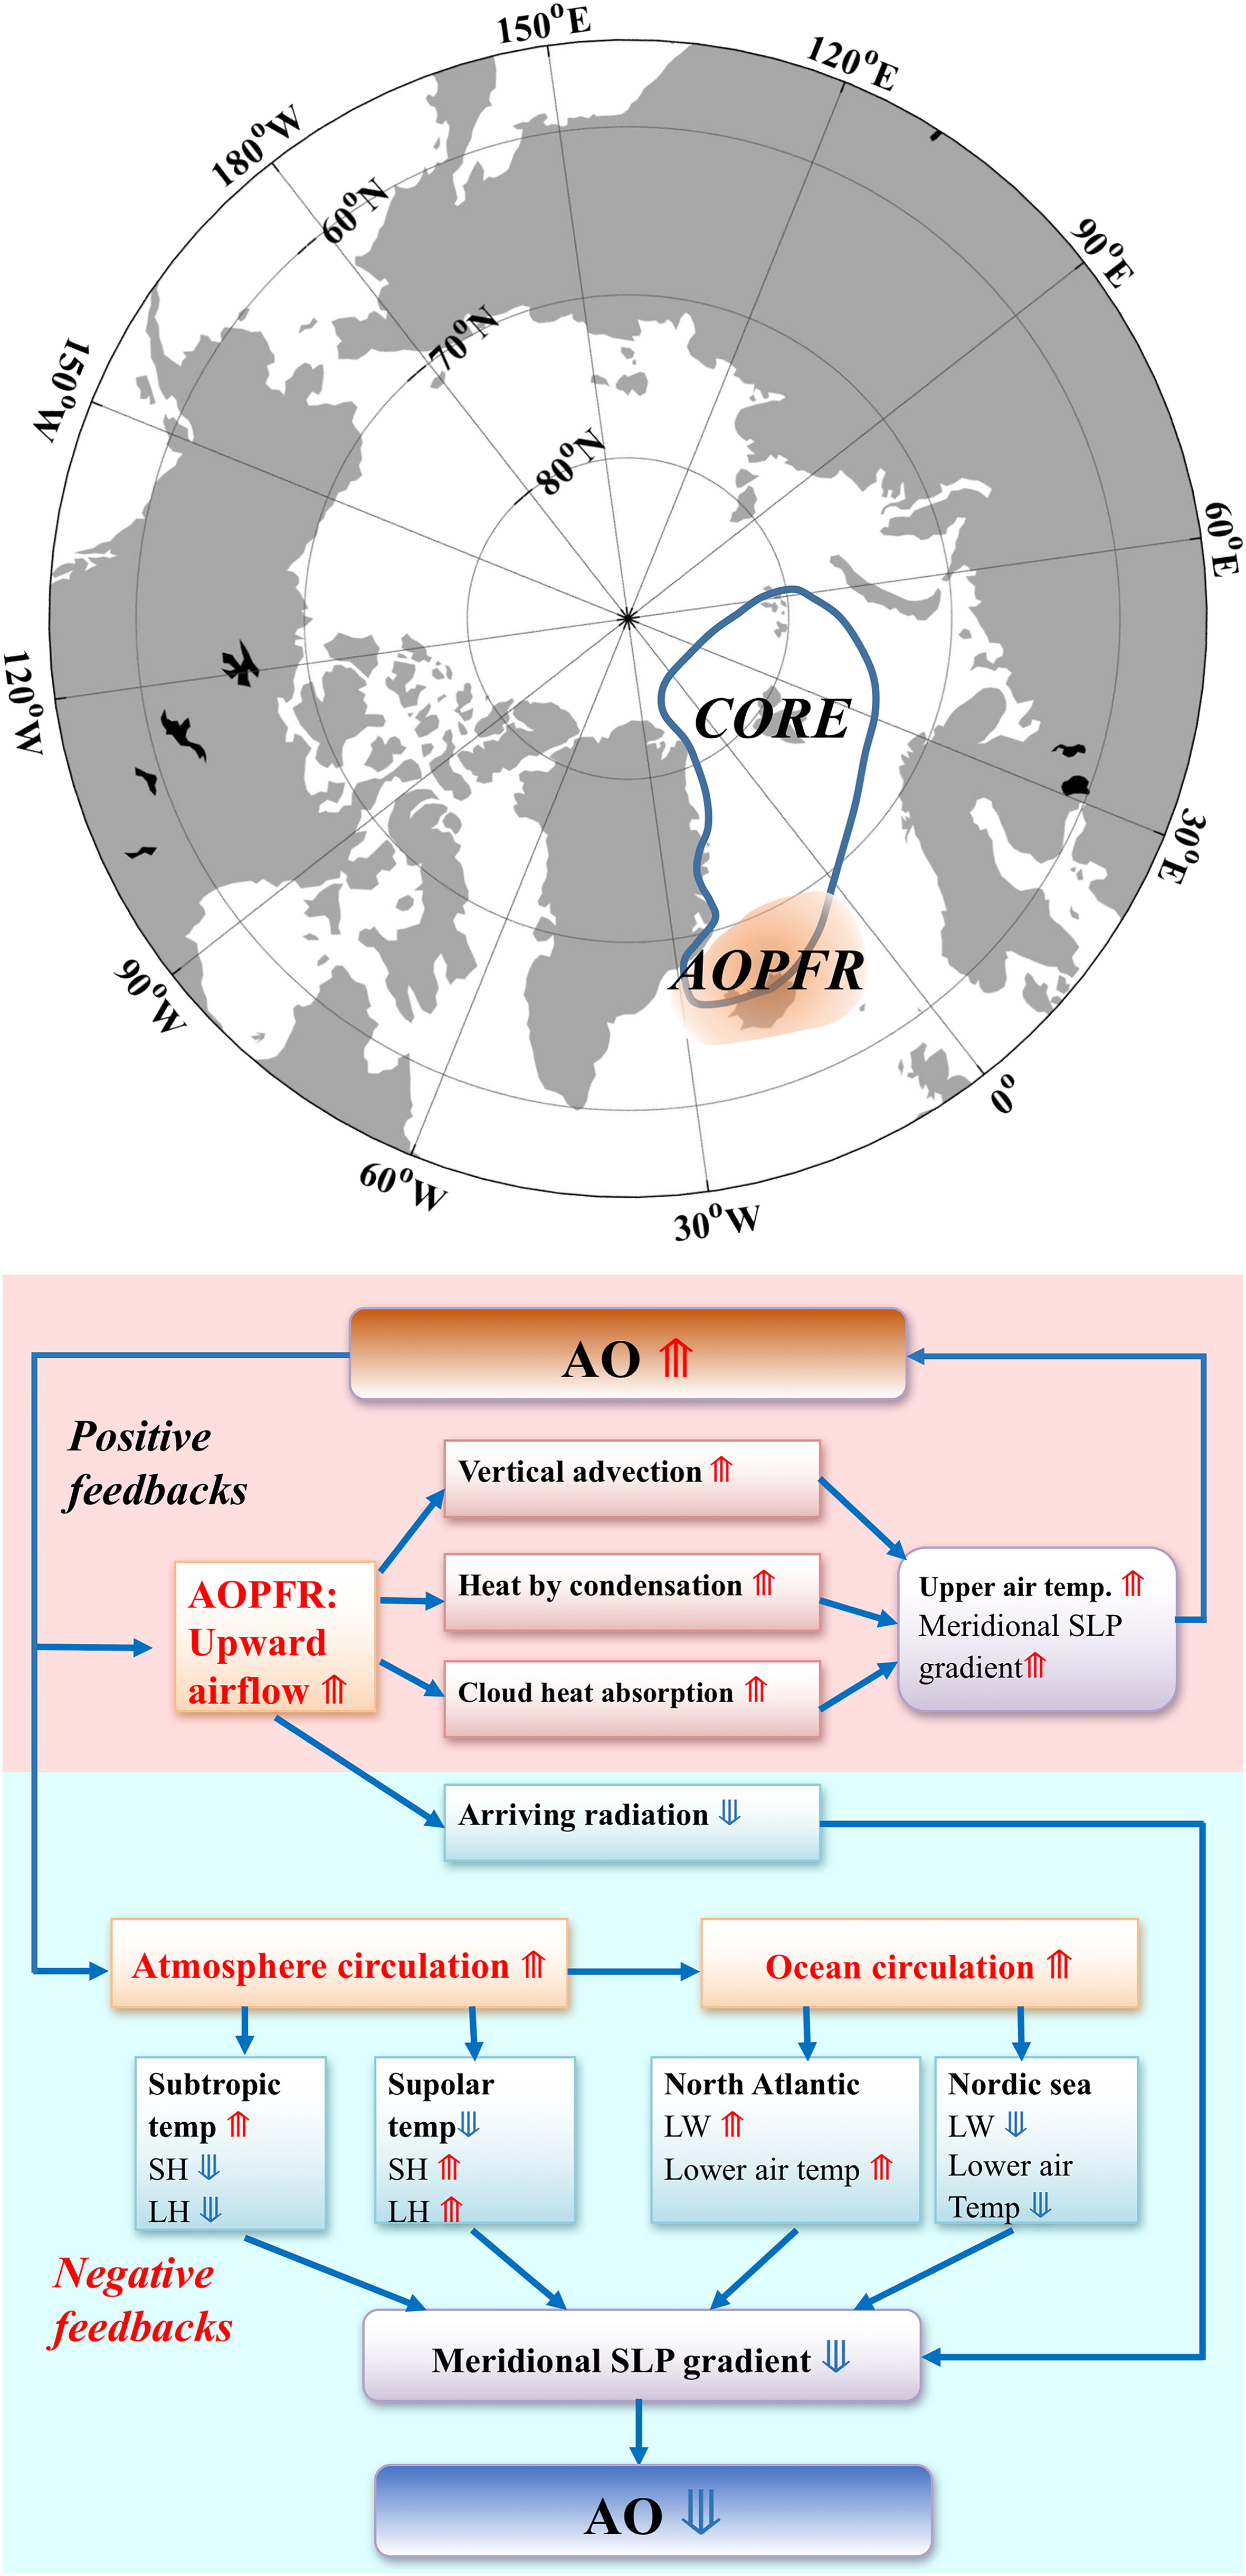
Fig. 11.
(a) Sketch of Arctic Oscillation Positive Feedback Region (AOPFR). (b) Sketch of positive and negative feedback processes of surface heat fluxes to the AO. Pink and blue shaded scopes show positive and negative feedbacks, respectively. The abbreviated symbols are as follows. ‘AO’: Arctic Oscillation; AOPFR: Arctic Oscillation positive feedback region; ‘temp.’: temperature; ‘LW’: long-wave radiation; ‘SH’: sensible heat; ‘LH’: latent heat; ‘SLP’: sea level pressure; ‘ ’: increase; ‘
 ’: decrease.
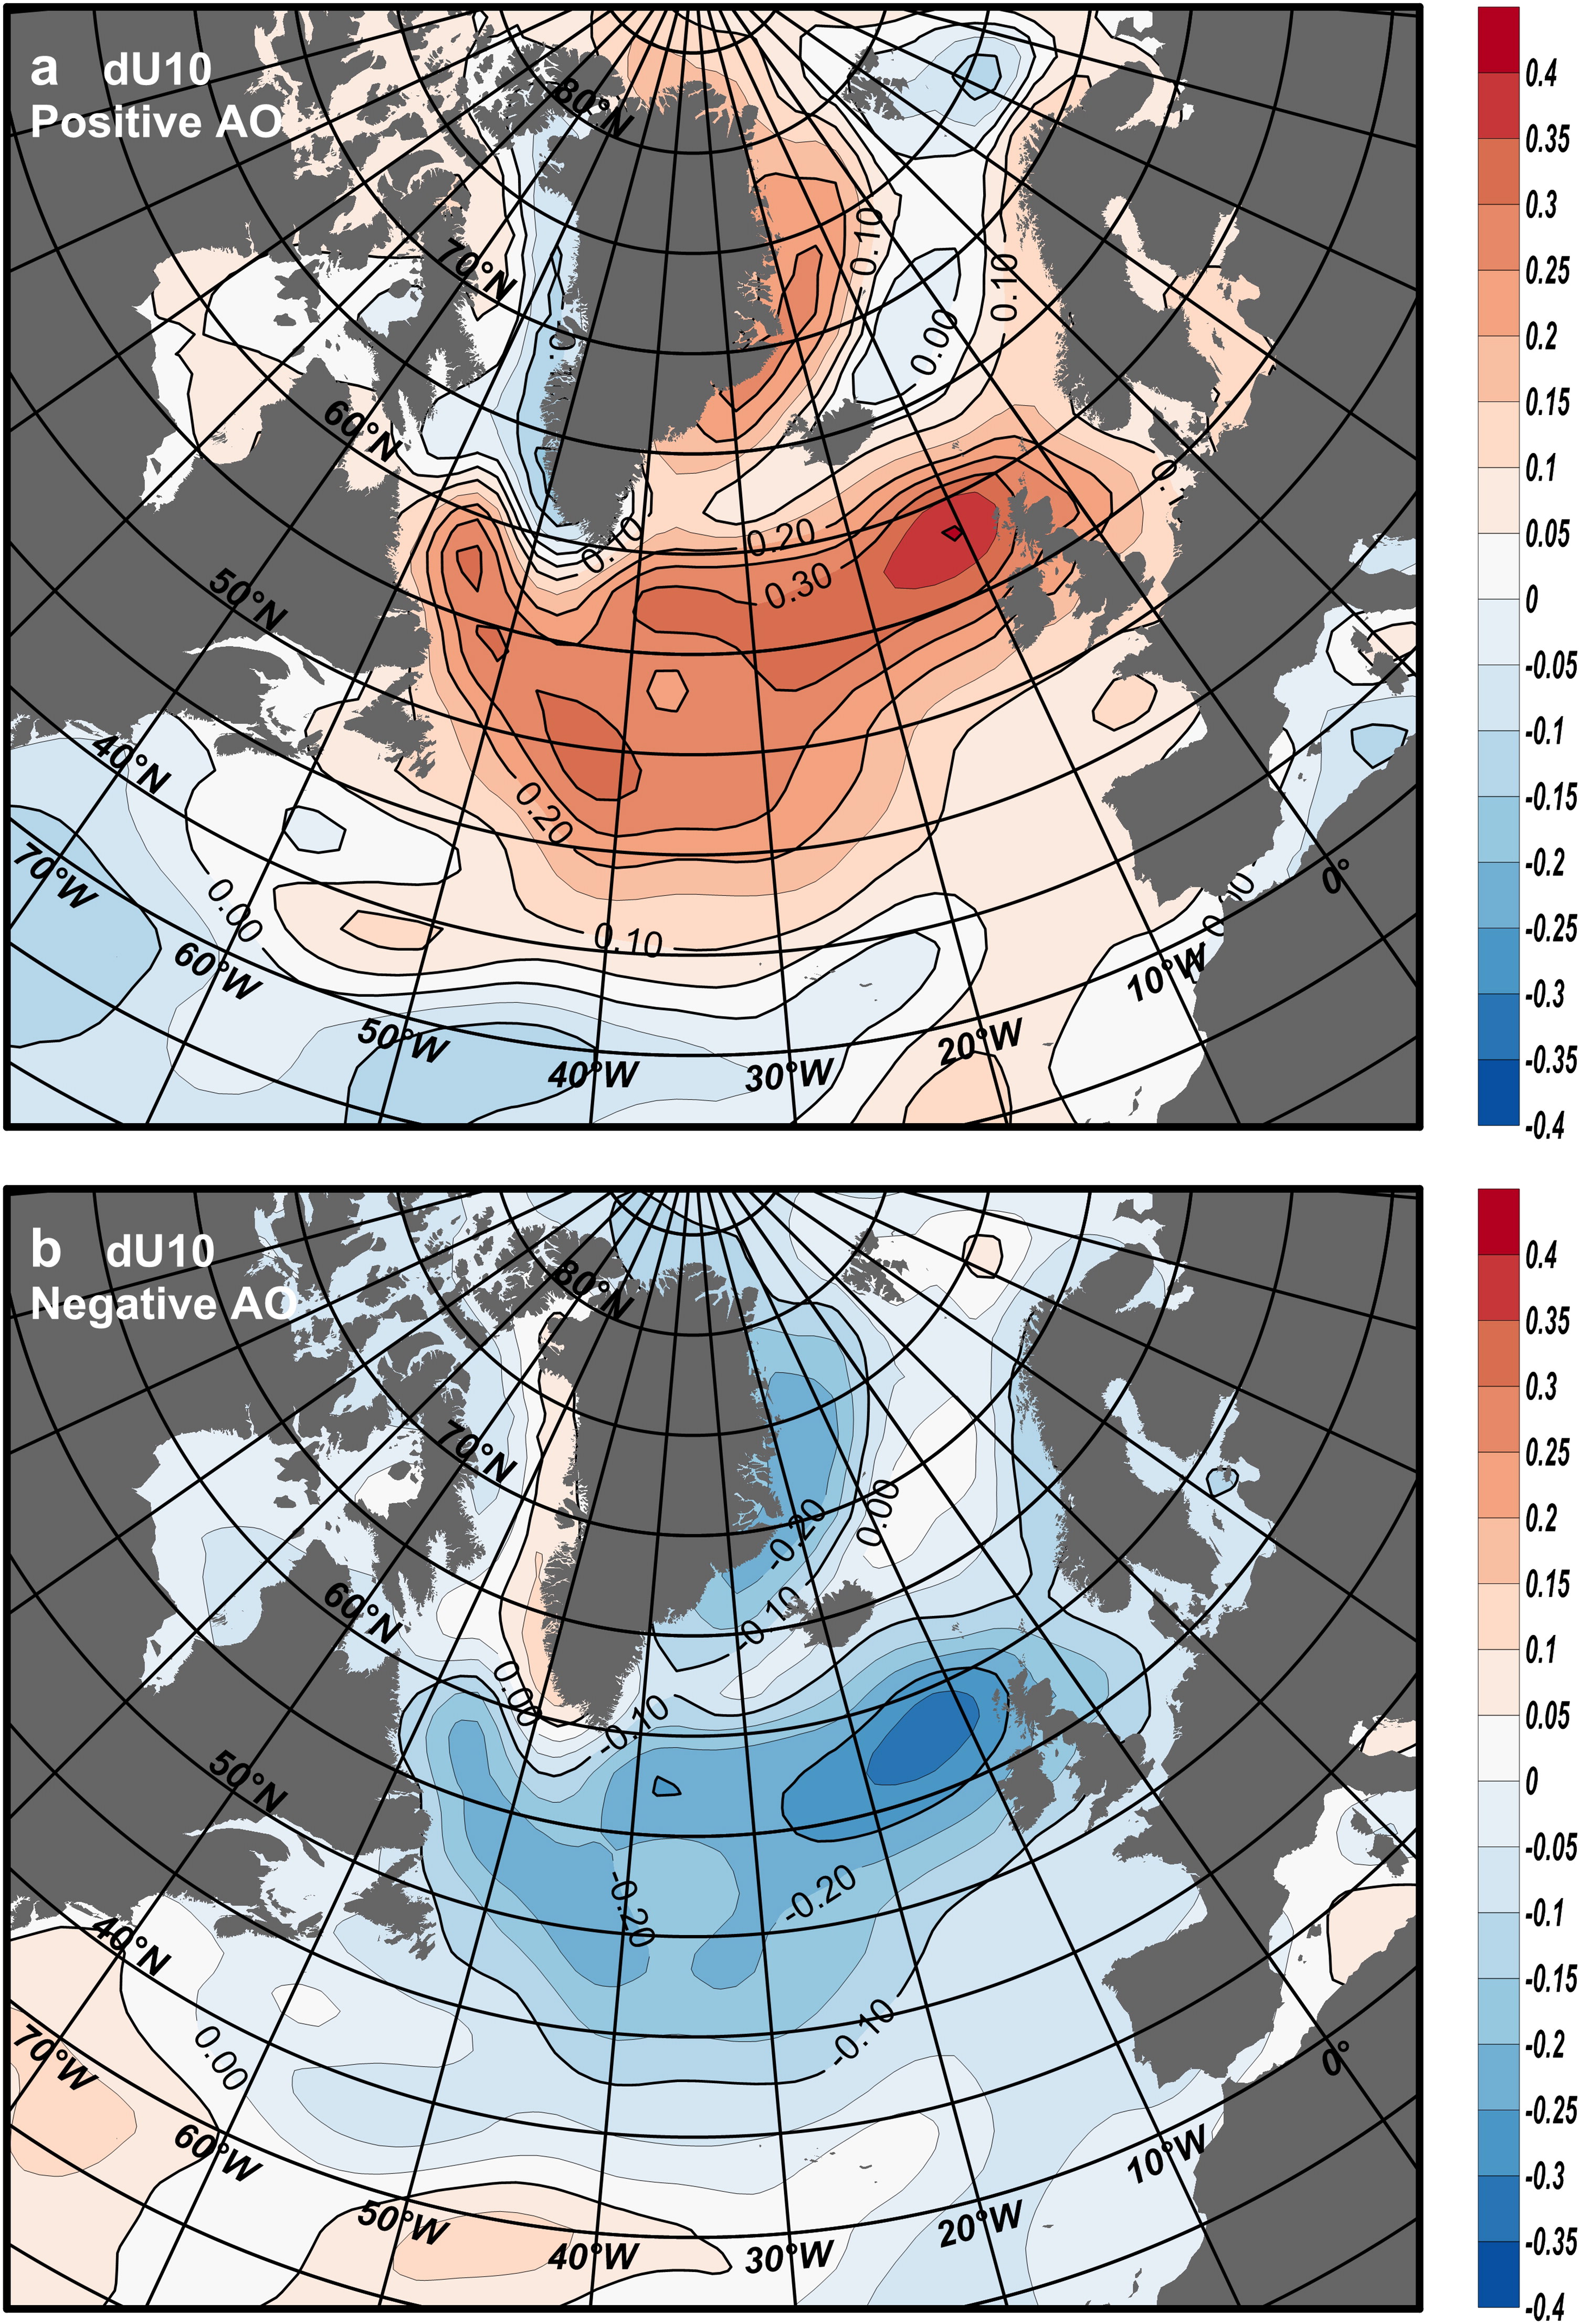
Fig. 12.
Spatial distribution of averaged wind speed anomaly when AO is positive (a) and negative (b). The pattern was average by wind fields with AOI > 0 and AOI < 0.