
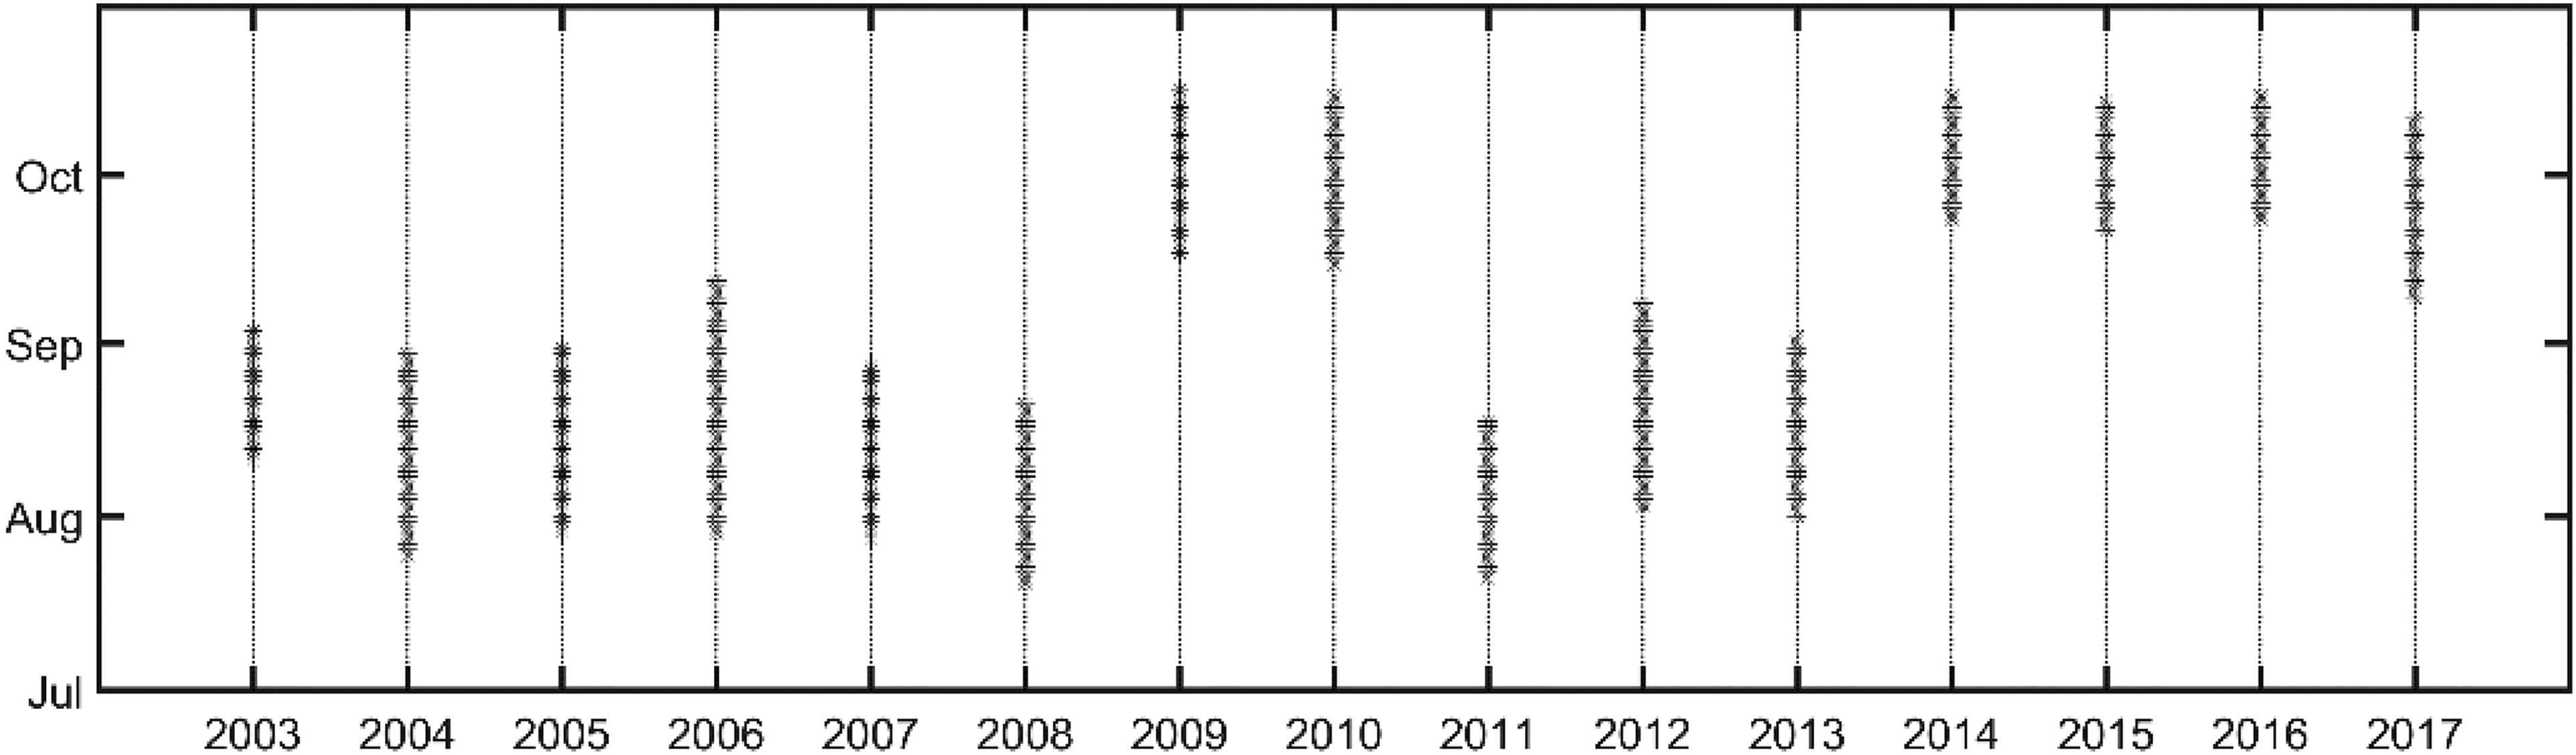
Fig. 1.
LSSL expedition time during 2003 to 2017.
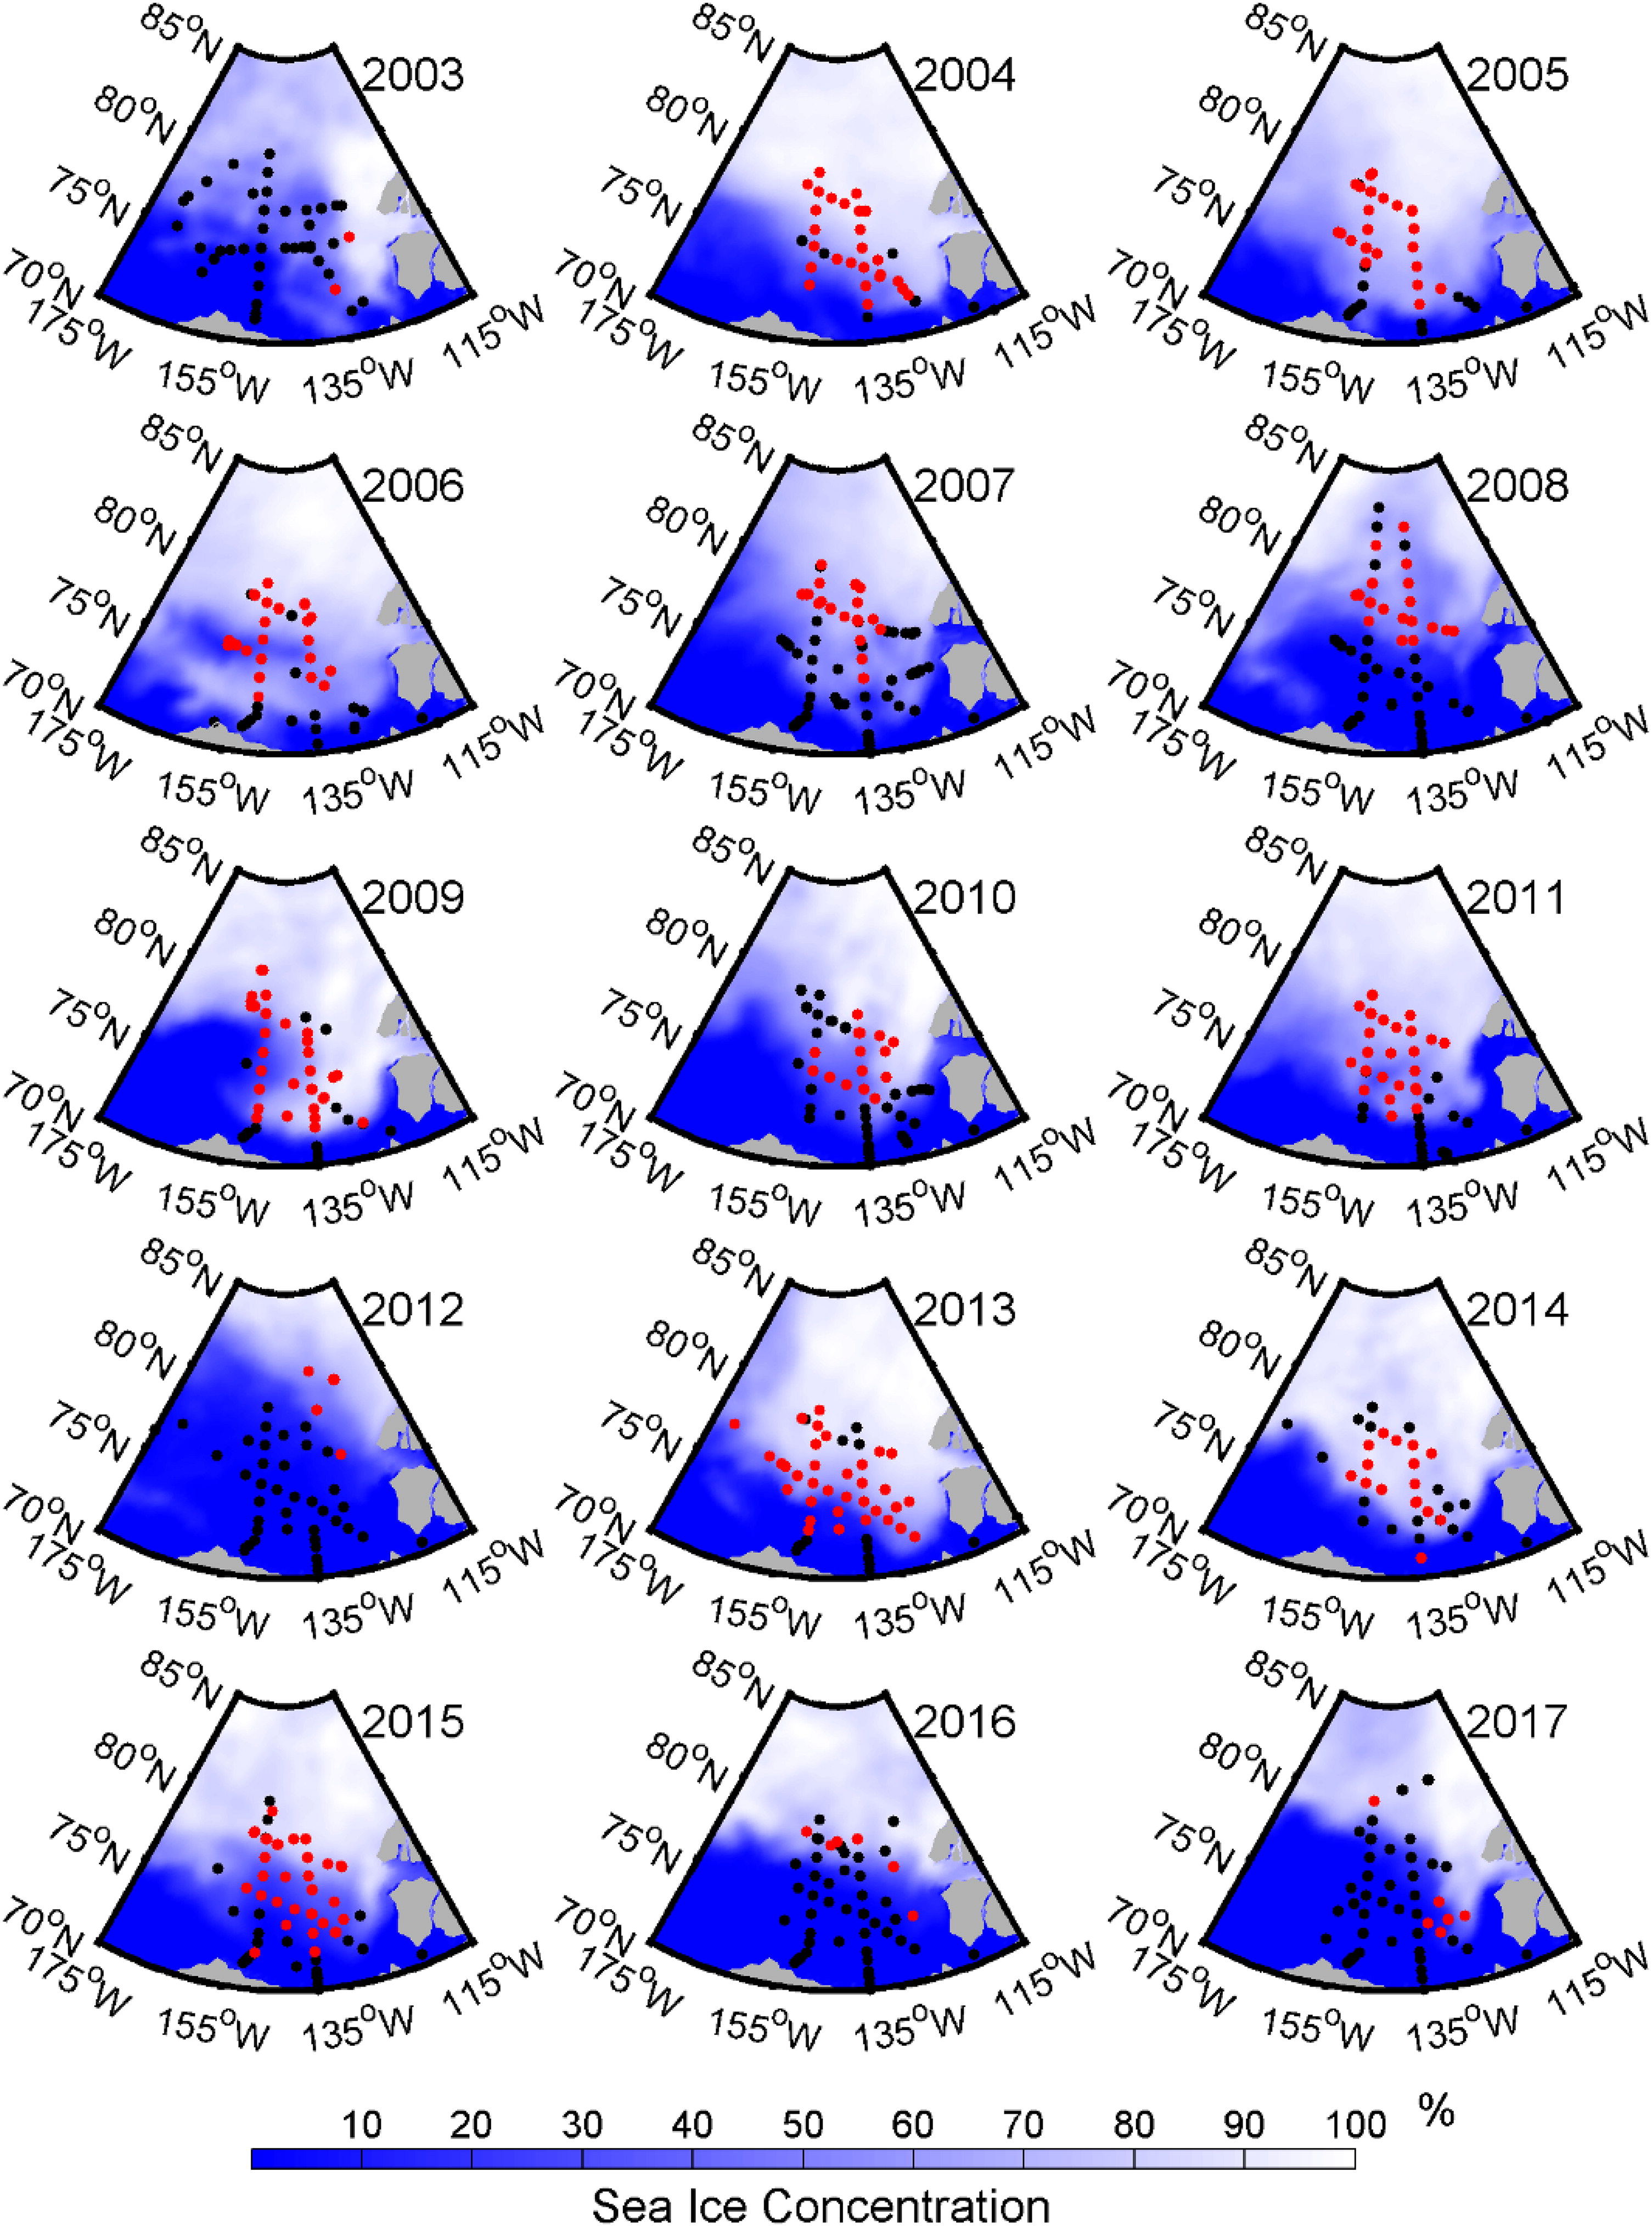
Fig. 2.
Distribution of summer NSTM during 2003–2017. Red dots represent the stations where NSTM existed, while black dots represent the stations without NSTM. The background represents the mean sea ice concentration during the expedition time.
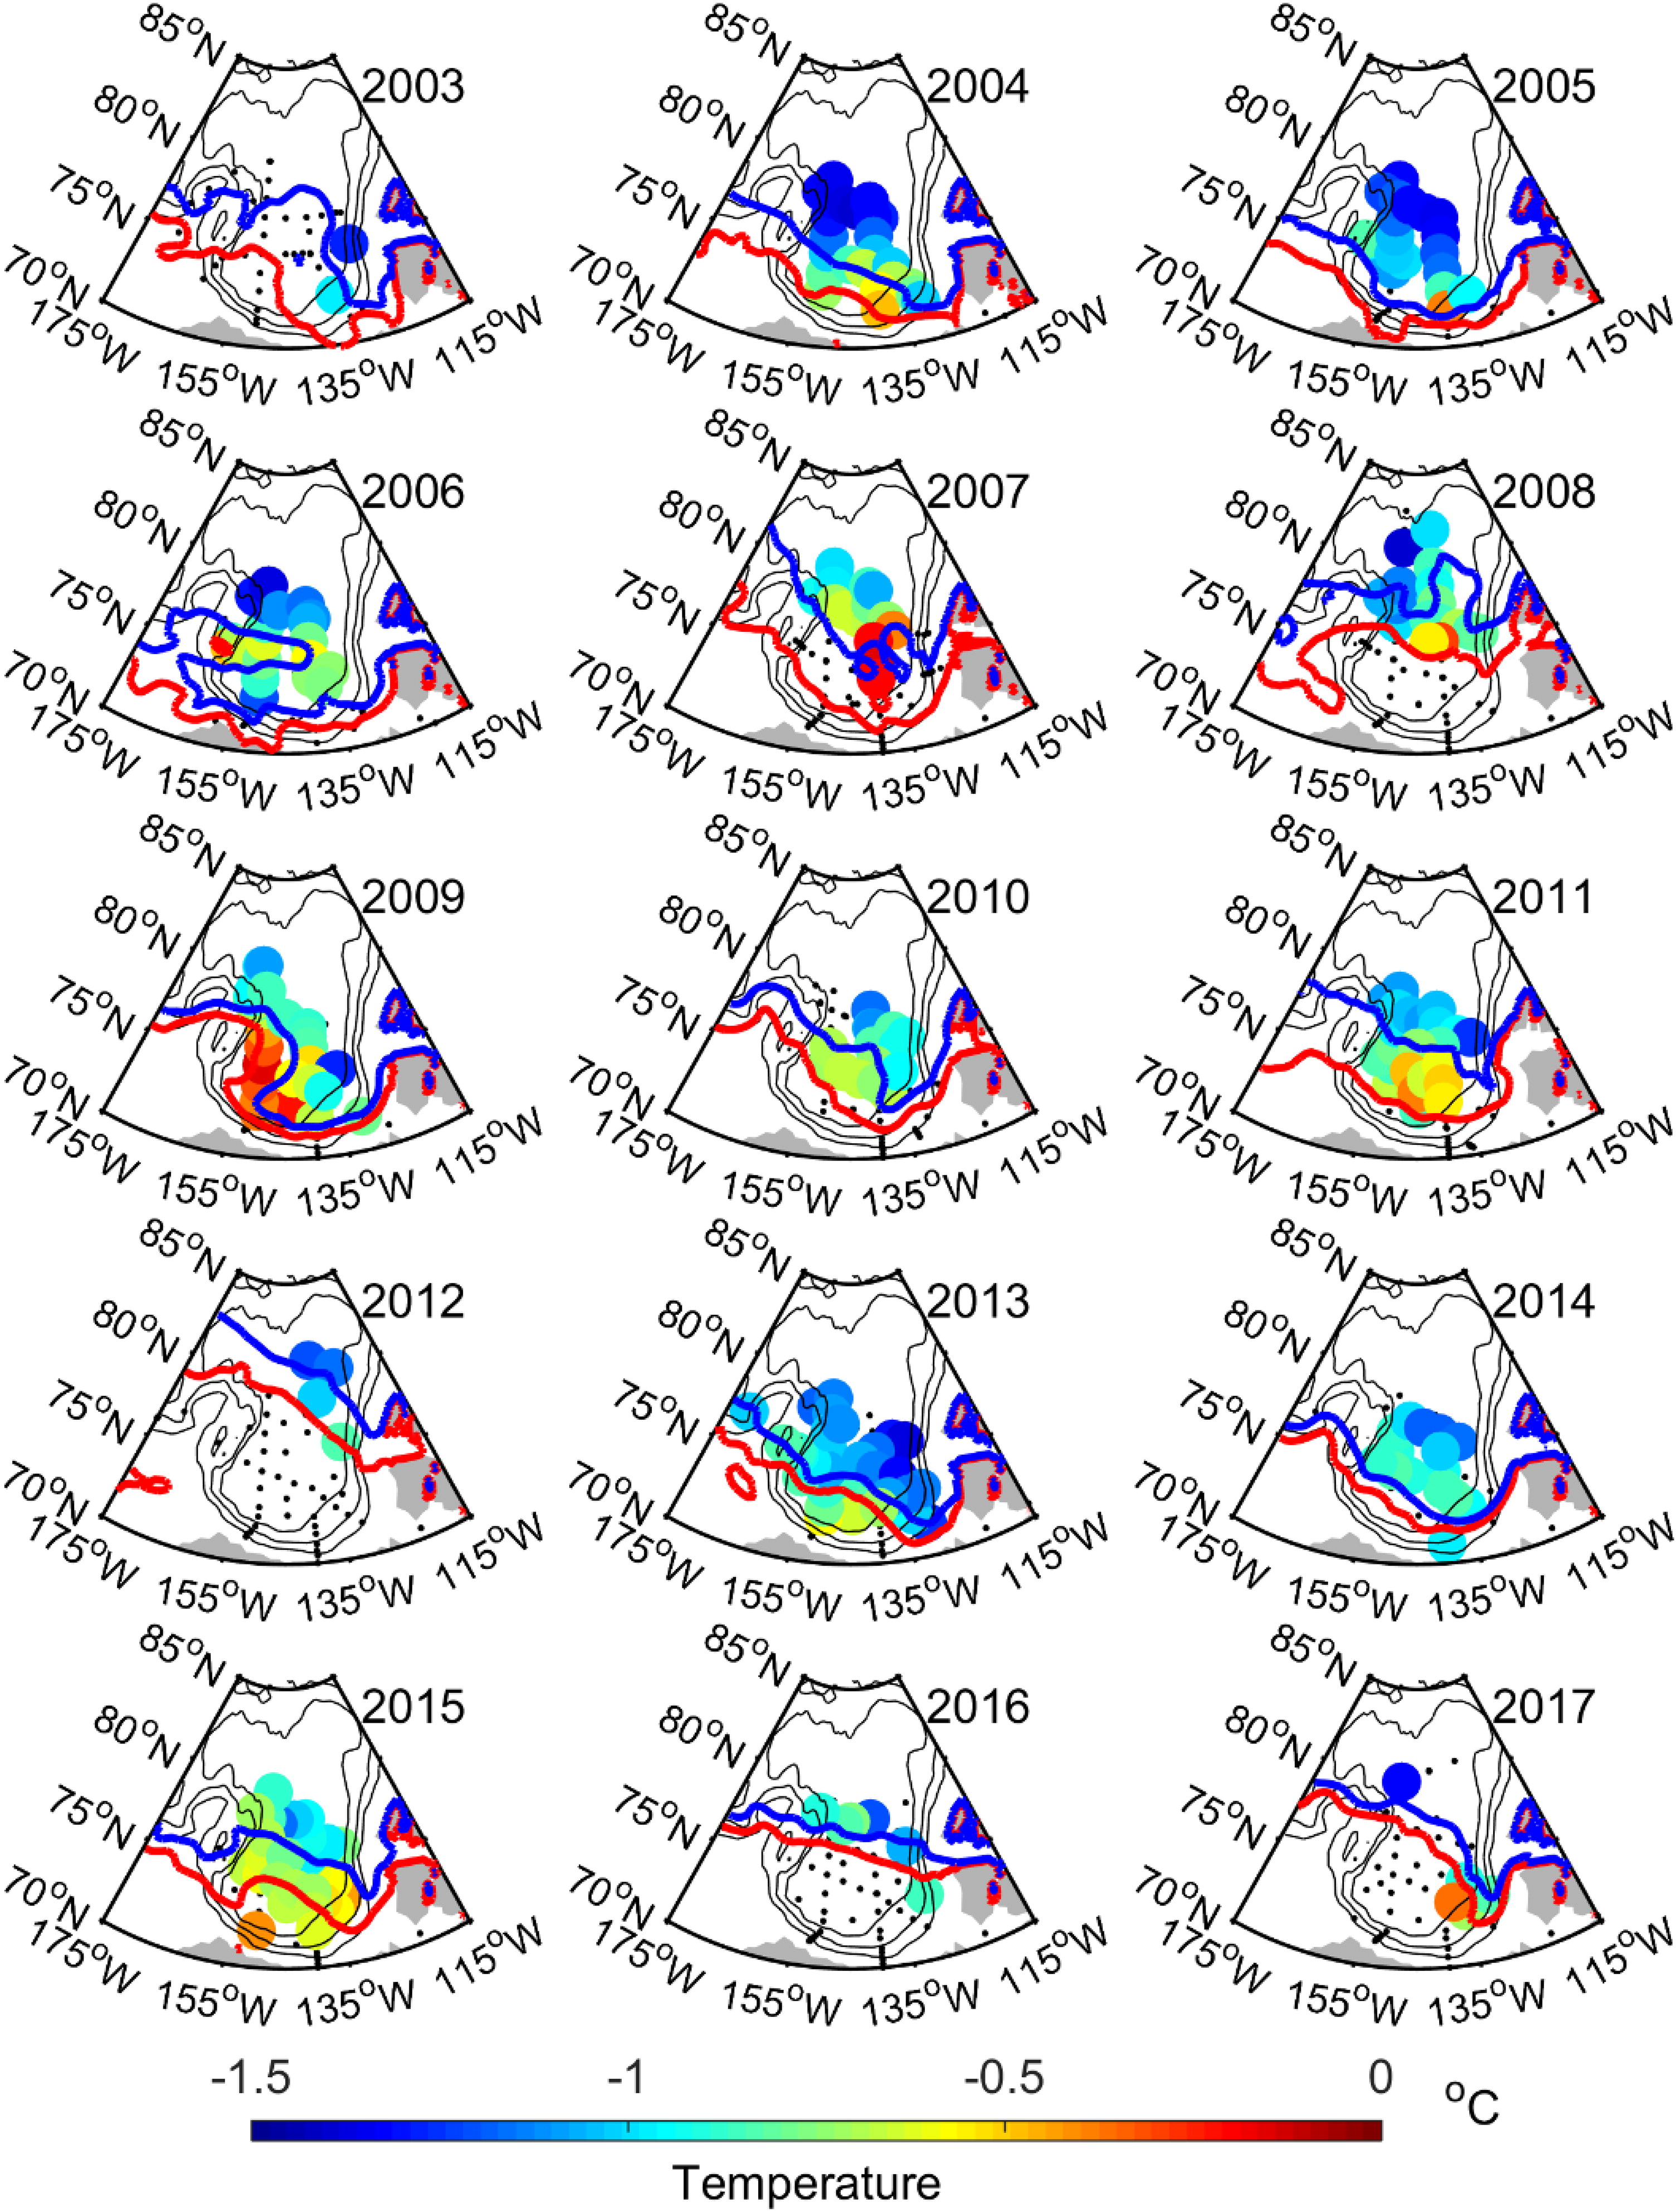
Fig. 3.
Distributions of the summer NSTM temperature. Shaded circles represent the NSTM temperature, and black dots indicate the CTD stations without NSTM. The red line displays the contour of 15% sea ice concentration (sea ice edge), and the blue line is for 50% sea ice concentration.
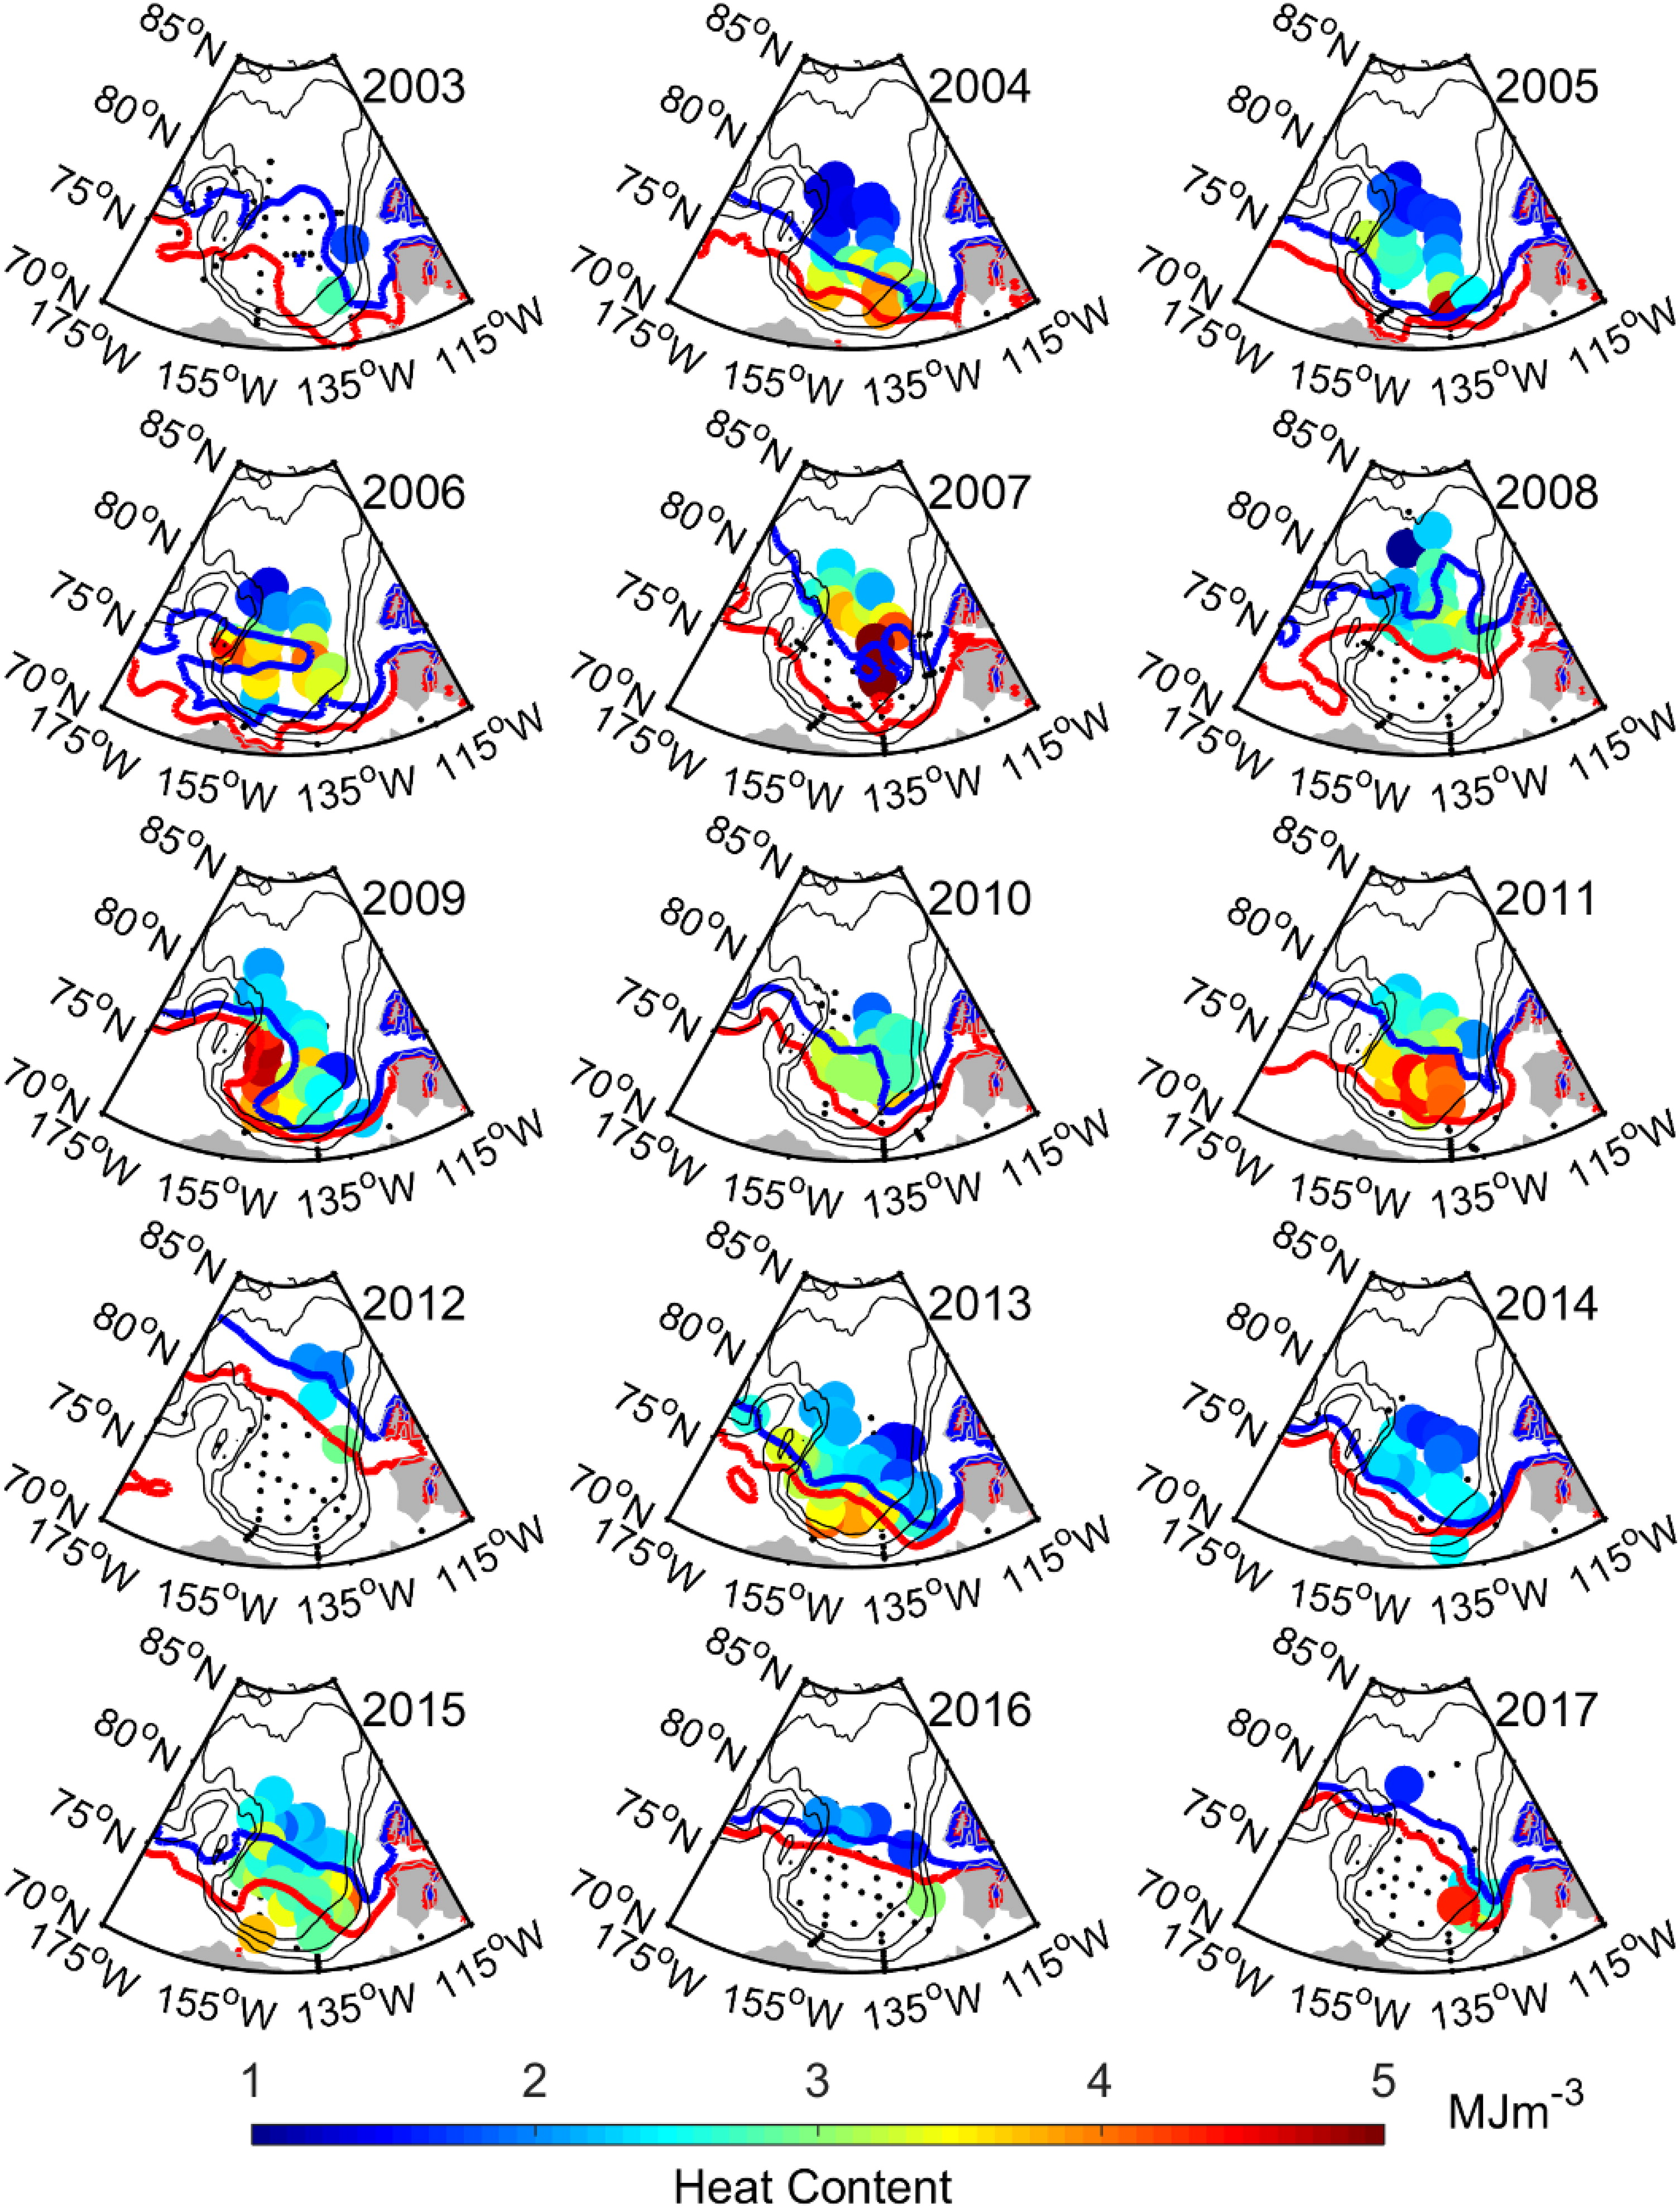
Fig. 4.
Distributions of the summer NSTM heat content. Shaded circles represent the NSTM heat content, and black dots indicate the CTD stations without NSTM. The red line displays the contour of the 15% sea ice concentration (sea ice edge), and the blue line is for 50% sea ice concentration.

Fig. 5.
The relationship of the summer NSTM temperature and heat content with sea ice concentration (SIC), Julian day, latitude, and wind speed.
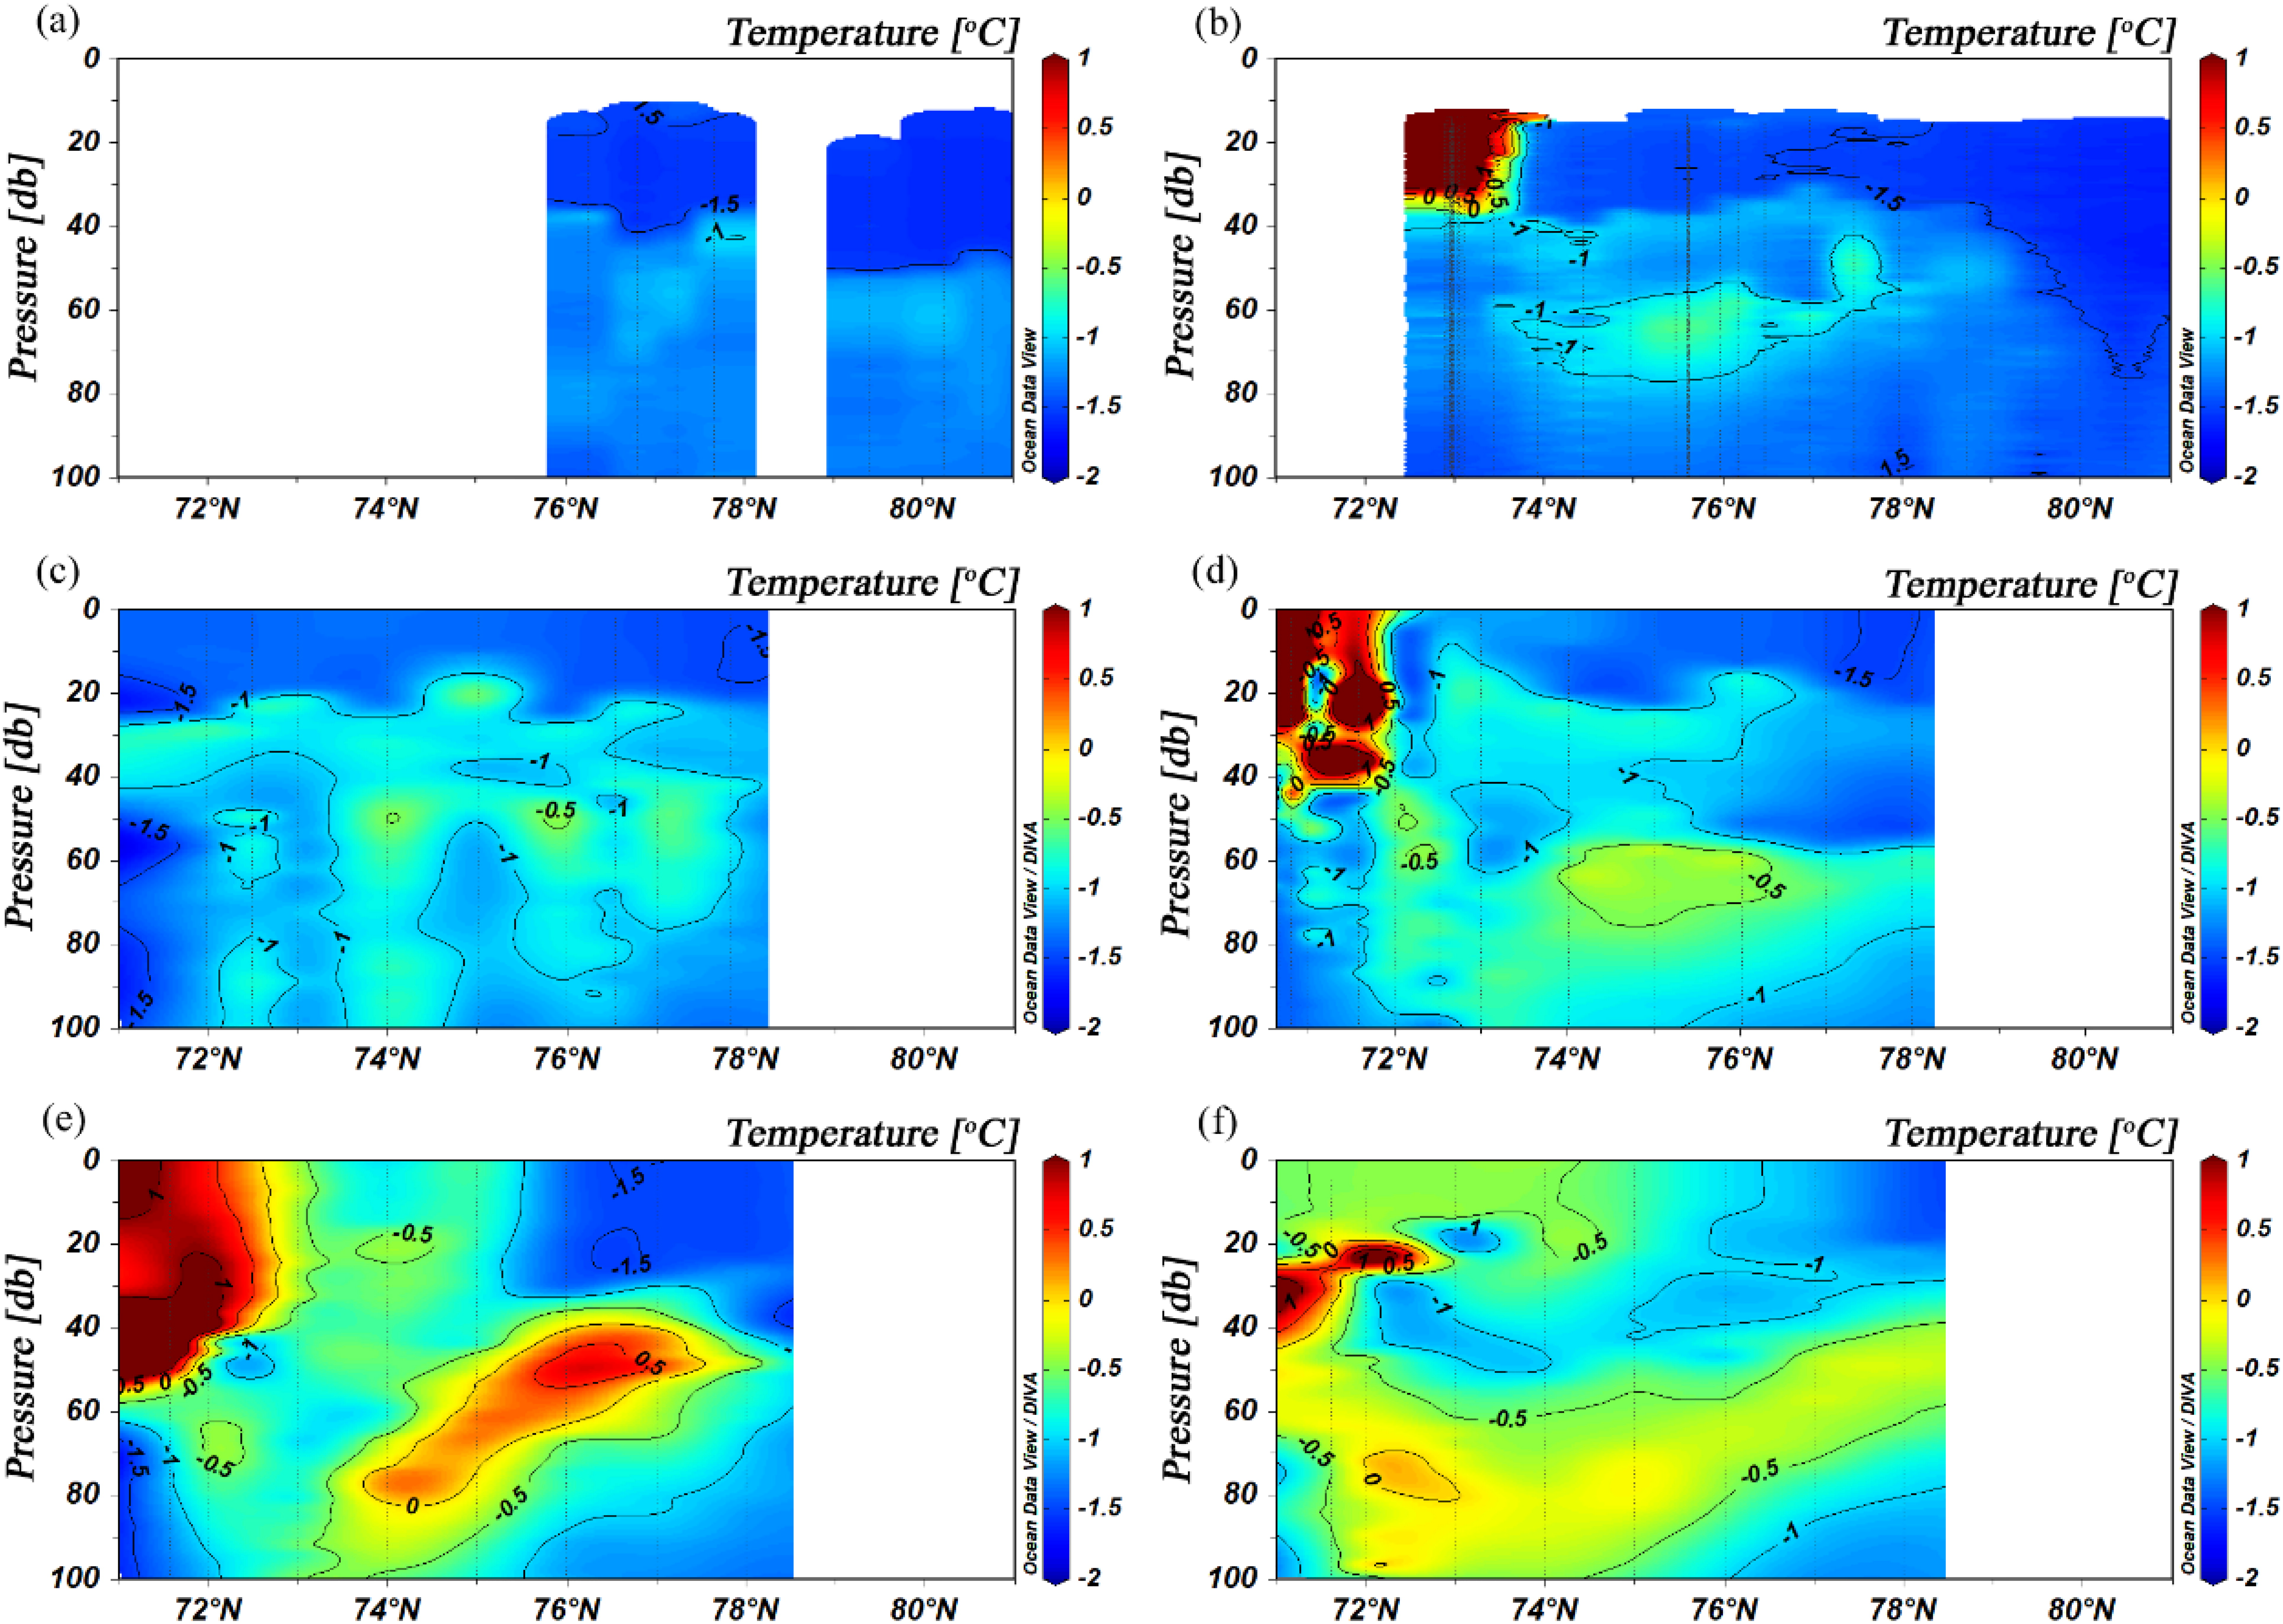
Fig. 6.
Meridional September temperature sections in the upper ocean of the Canada Basin. (a) 1996, (b) 1997, (c) 2009, (d) 2010, (e) 2016, (f) 2017. Sections (b), (c), (d), (e) and (f) were located along 140°W, while section (a) was slightly slanted.
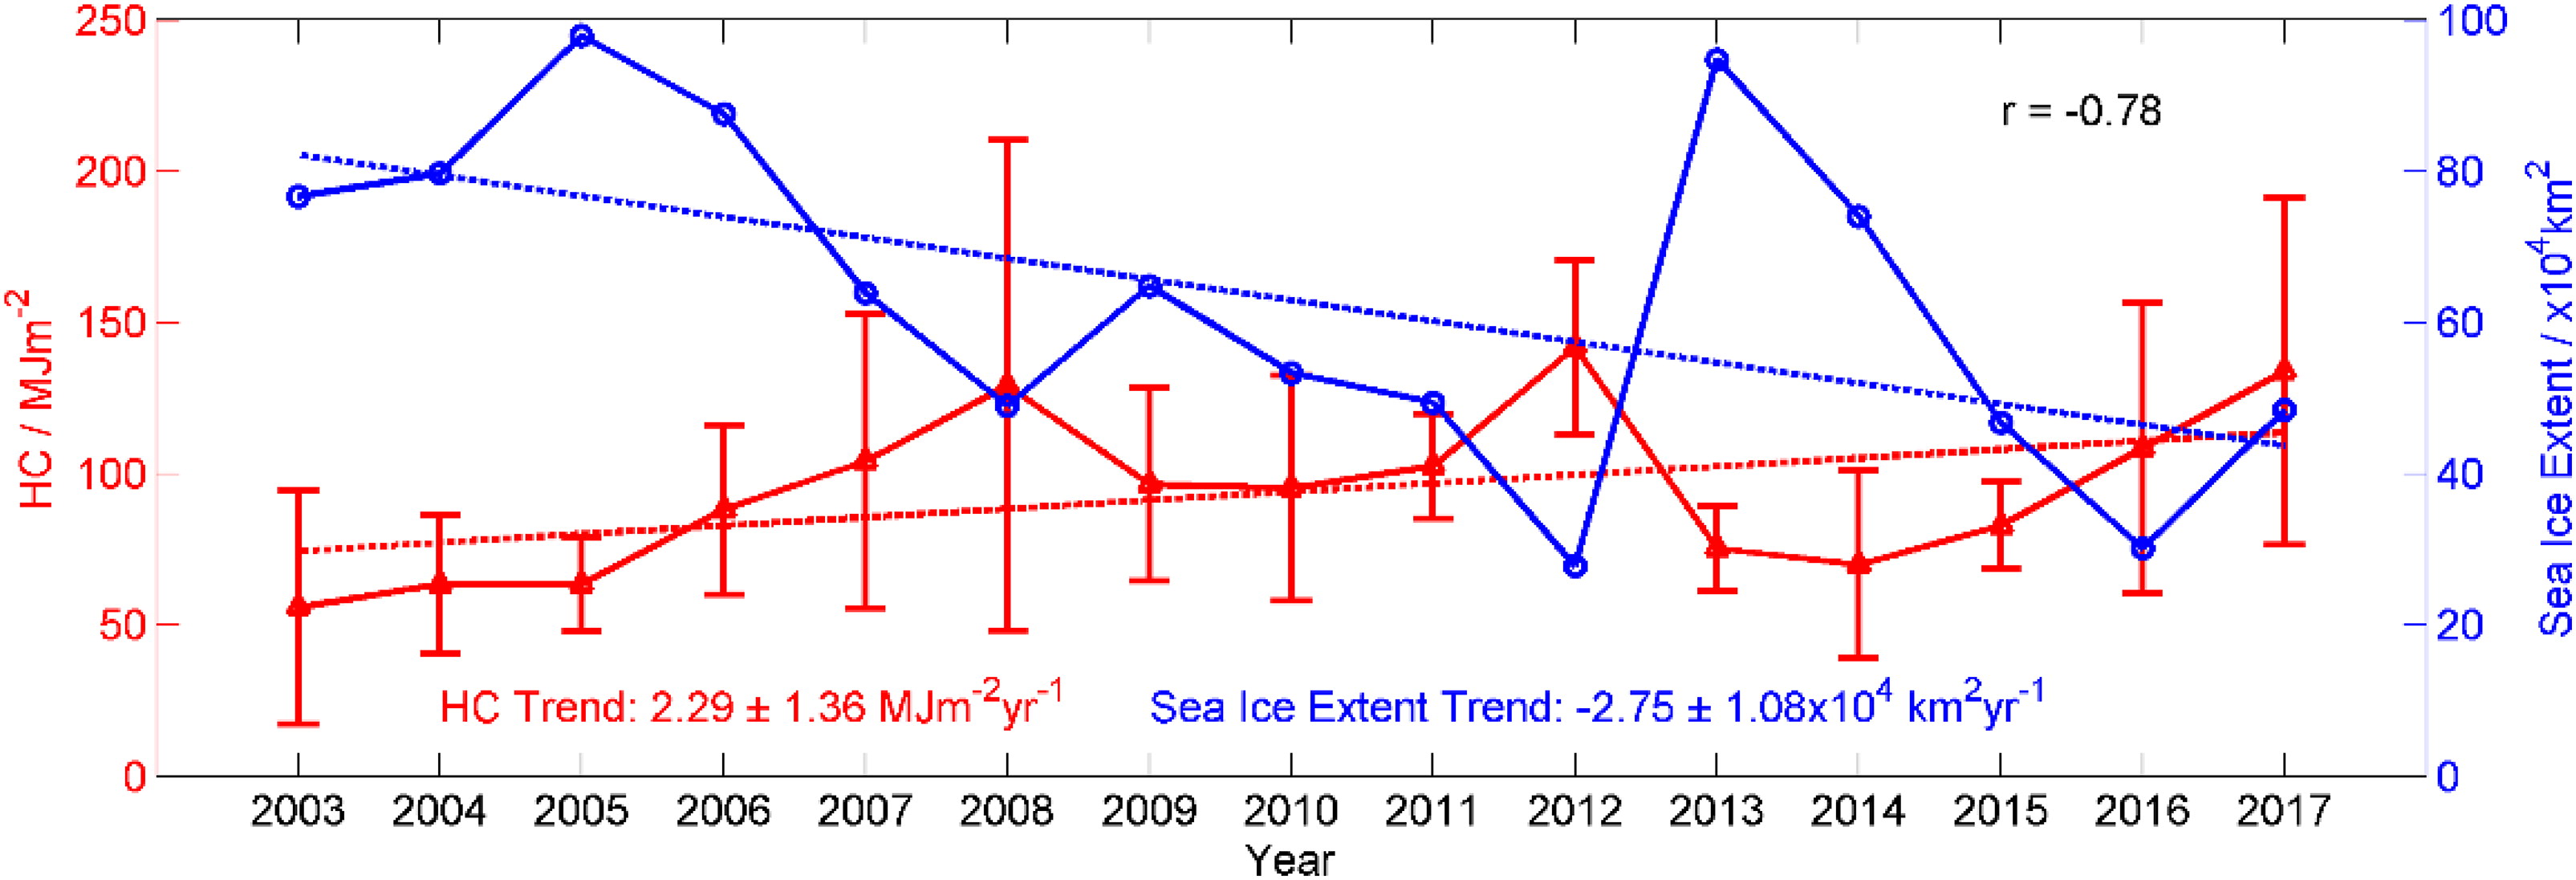
Fig. 7.
Linear trend of HC in the CCB (red) and September minimum sea ice extent in the Canada Basin (blue).