
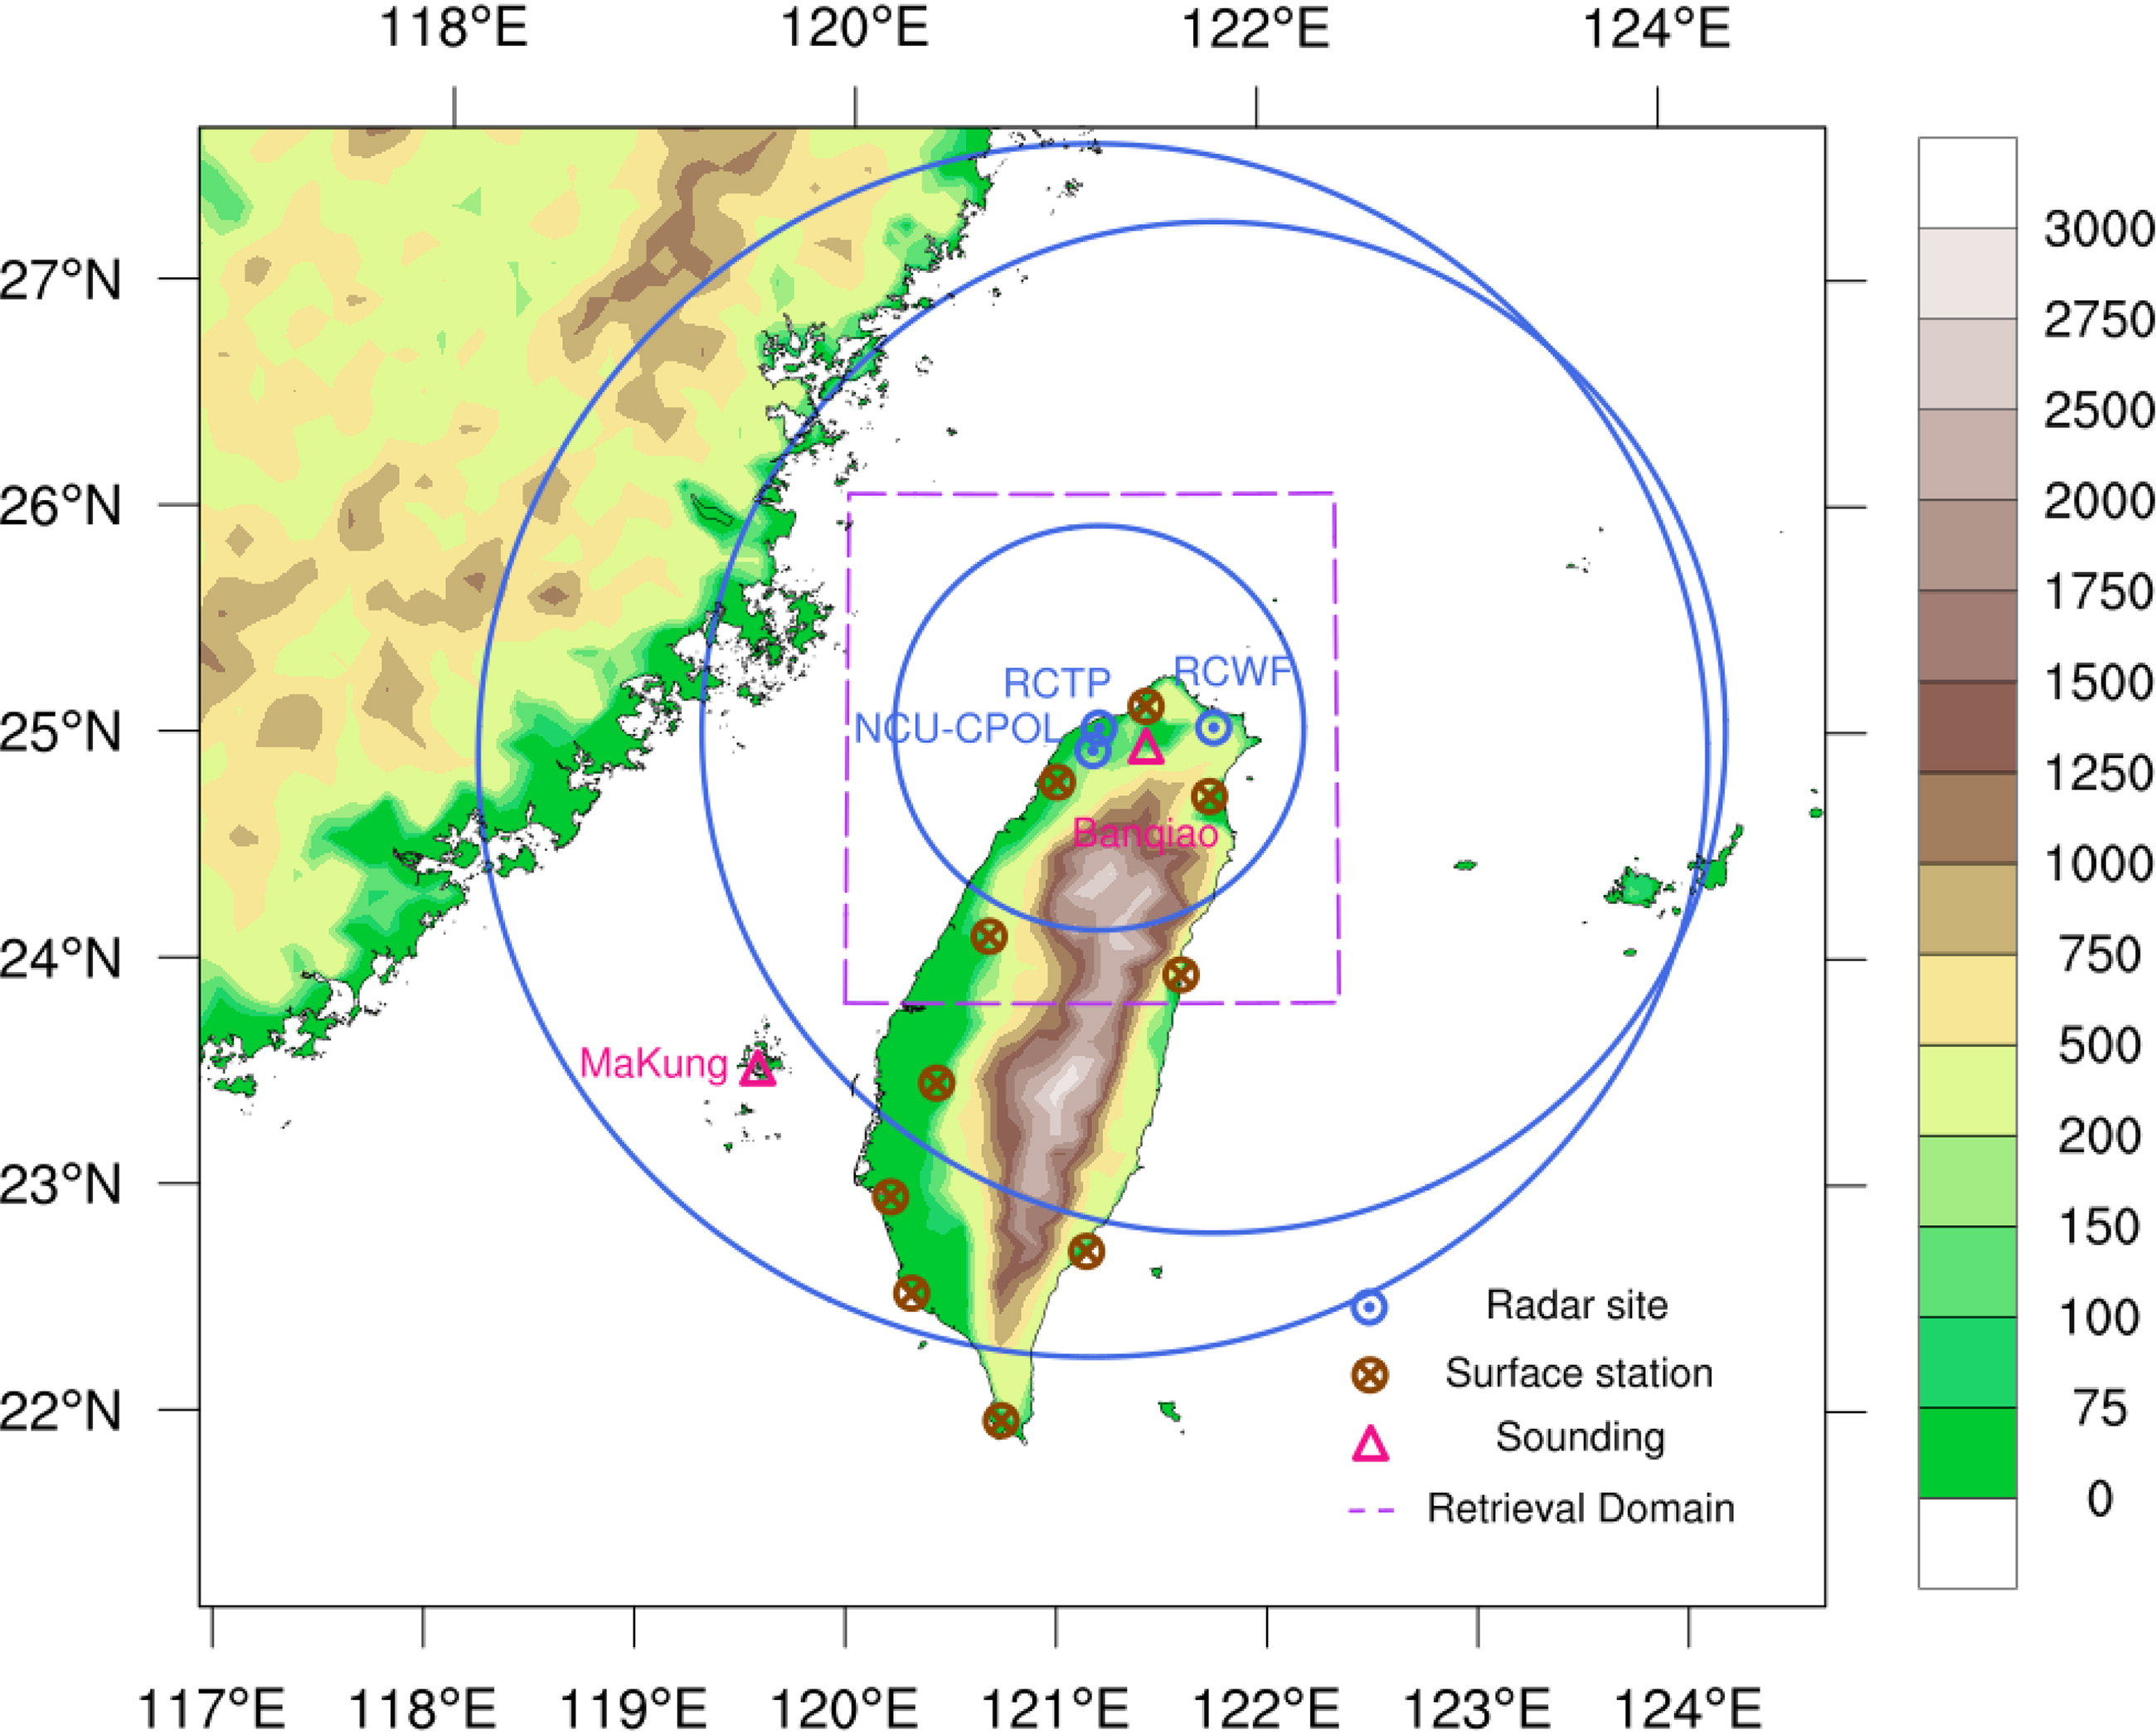
Fig. 1.
Map of observations and retrieval domain utilized in the study: shown are surface observations (brown), sounding observations (pink) and analysis domain (purple dash line). The locations of three radar sites (RCWF, RCTP, and NCU-CPOL) and maximum observation range over northern Taiwan (blue) are also presented.
Table 1.
Information of the three radar sites.
Table 2.
Observation time of radar data for the analysis time of retrieval algorithm.
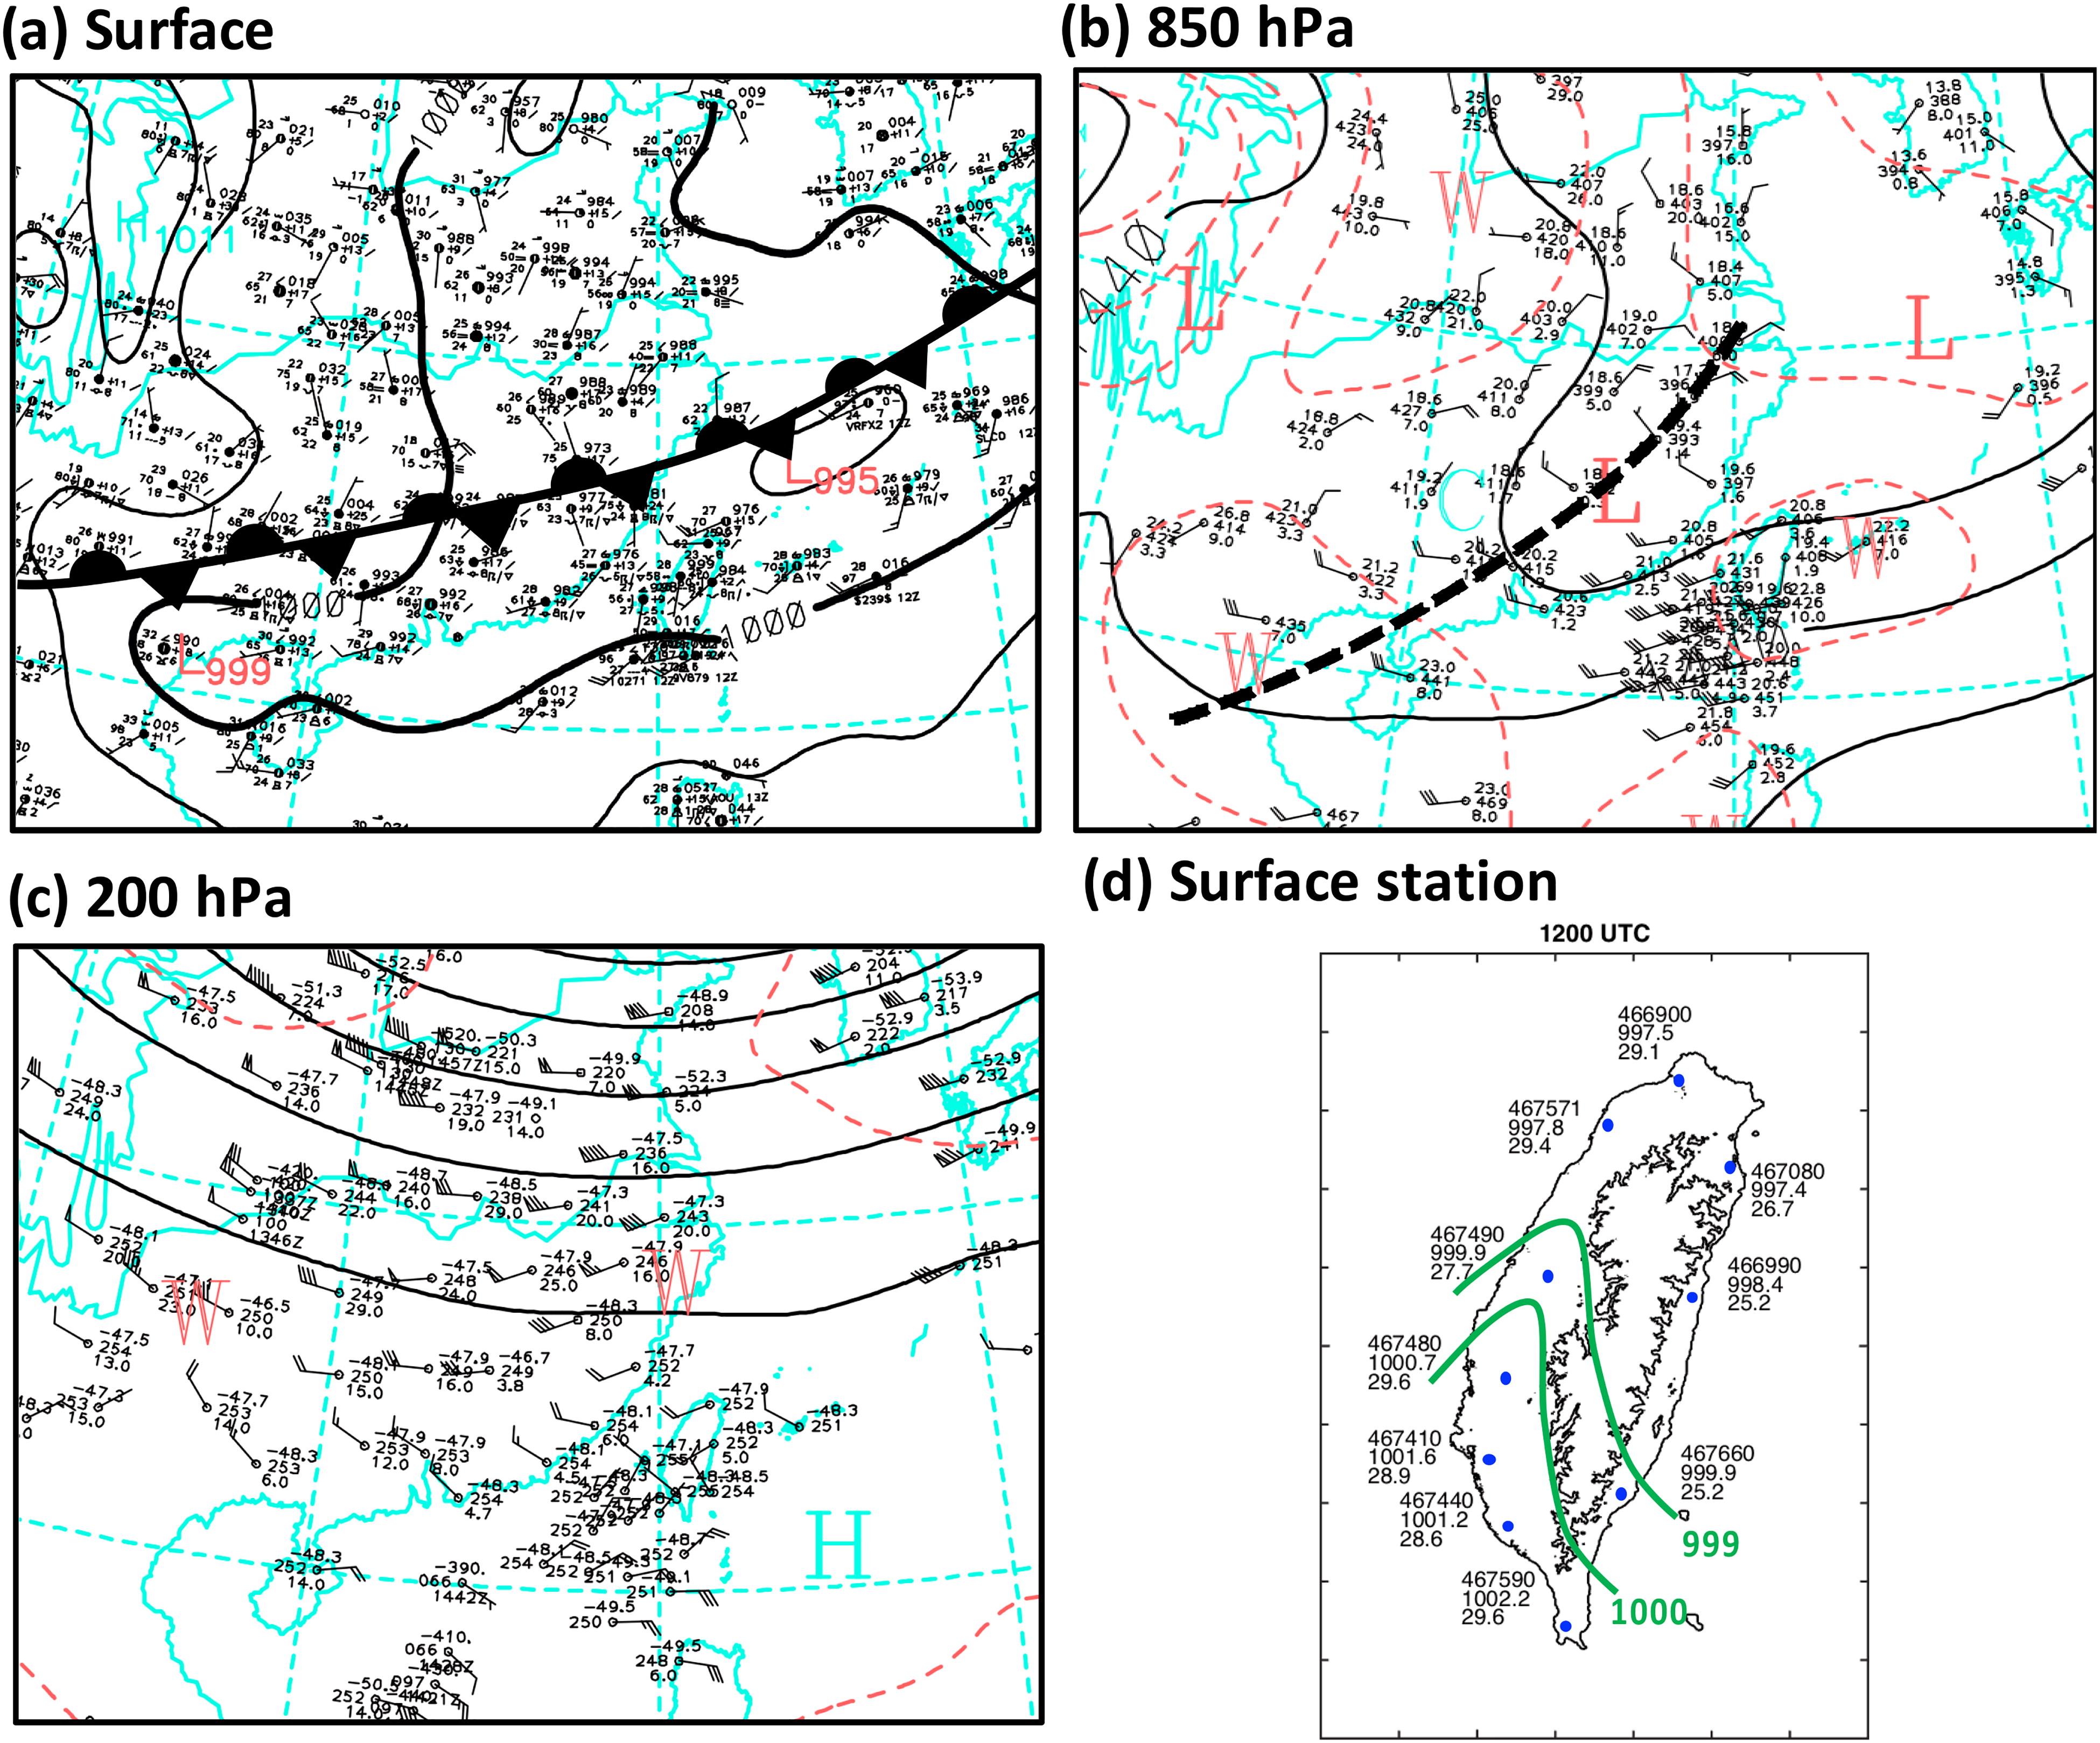
Fig. 2.
Weather maps at 1200 UTC 11 June 2012: (a) surface; (b) 850-hPa; (c) 200-hPa; (d) observed surface pressure at different stations over Taiwan. The values in each station are: station number (first row), surface pressure (second row, unit: hPa), and surface temperature (third row, unit: Celsius degree). Green lines are the surface pressure contour of 999 and 1000 hPa.
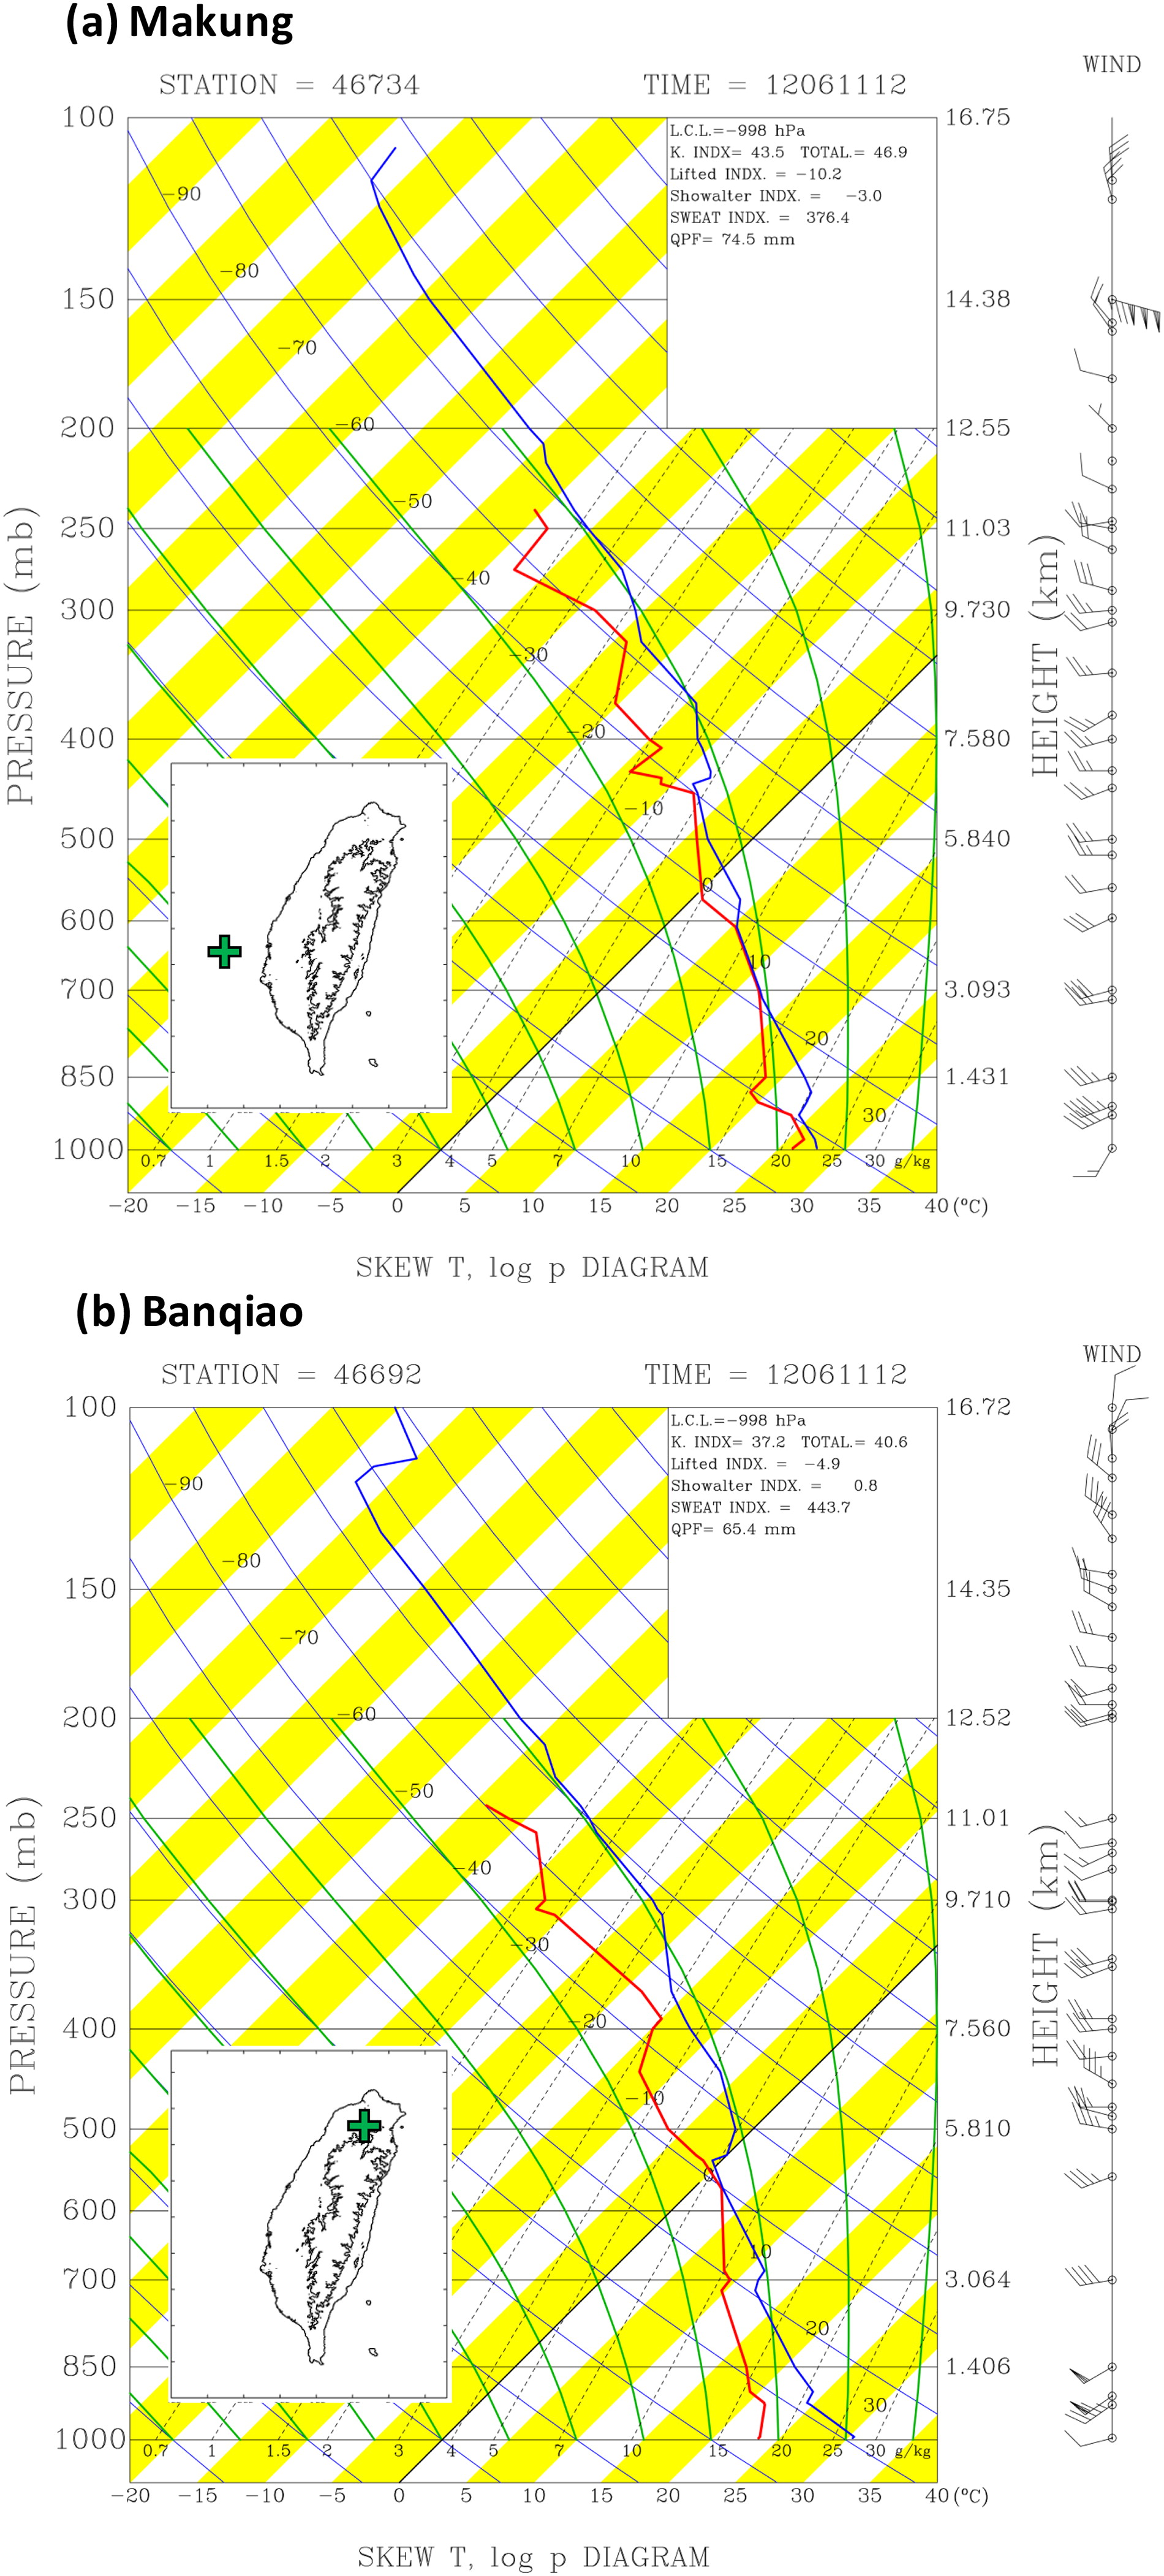
Fig. 3.
Radiosonde profile of (a) Makung station (119.56°E, 23.56°N, 46734) and (b) Banqiao station (121.44°E, 24.99°N, 46692) at 1200 UTC 11 June 2012.
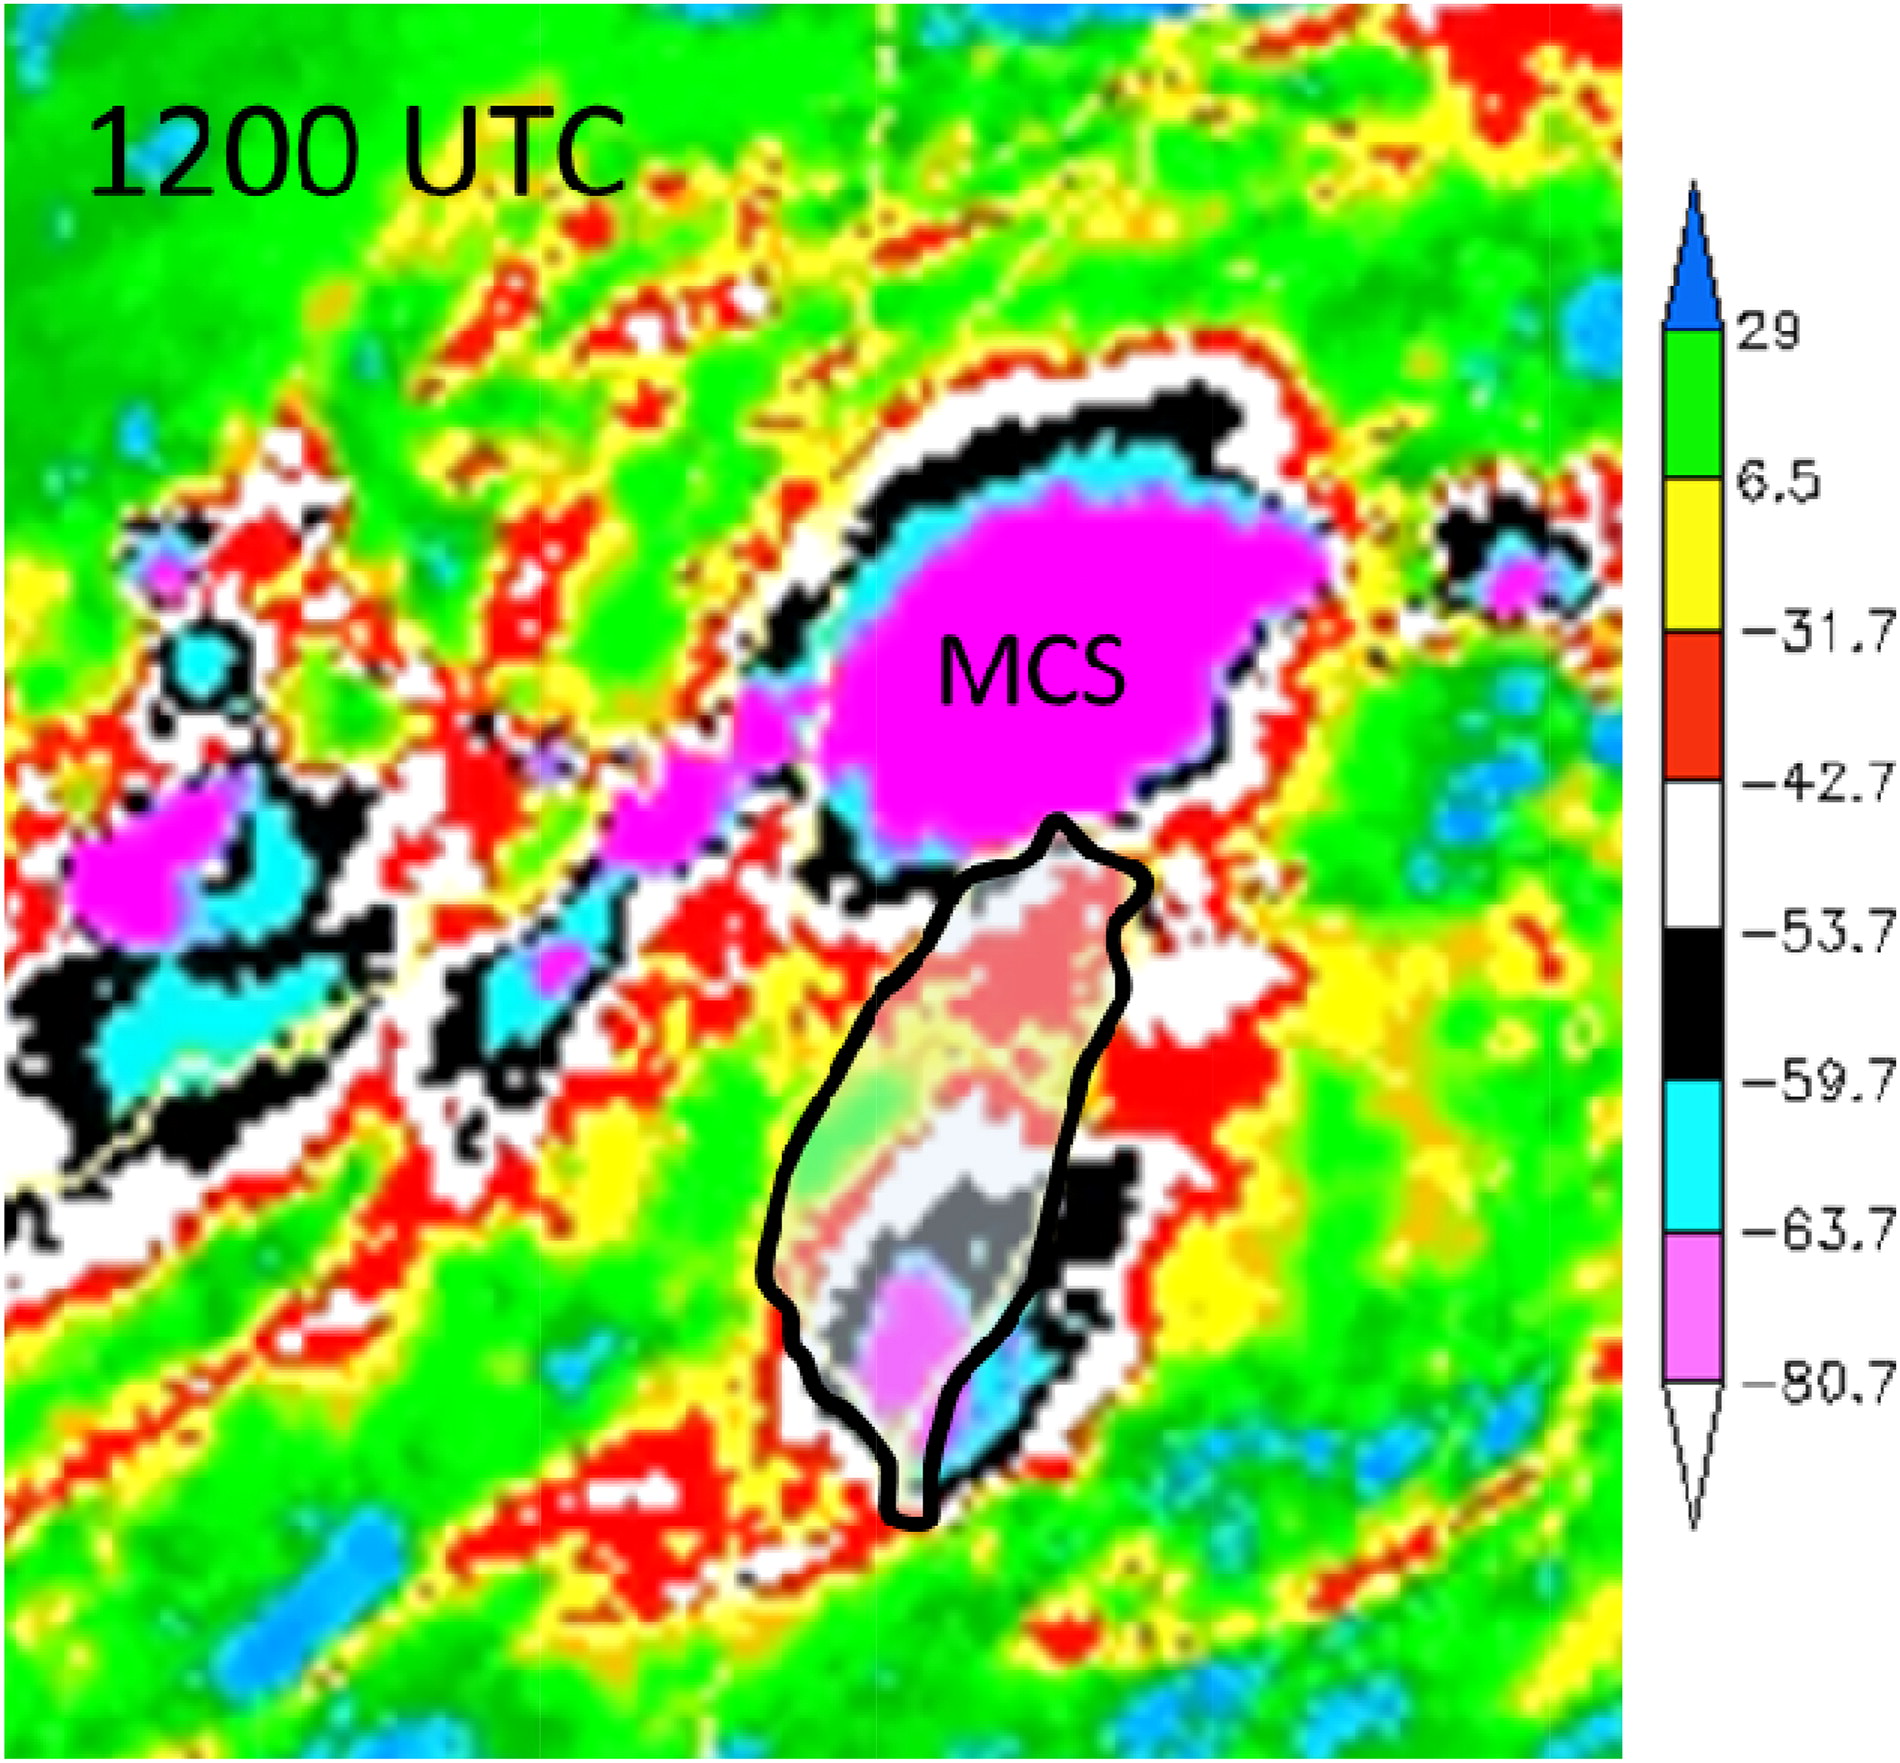
Fig. 4.
Infrared imagery of brightness temperature (unit: °C) the from Multifunctional Transport Satellite (MTSAT) on 11 June 2012 at 1200 UTC. The pink colour indicates the location of the MCS.
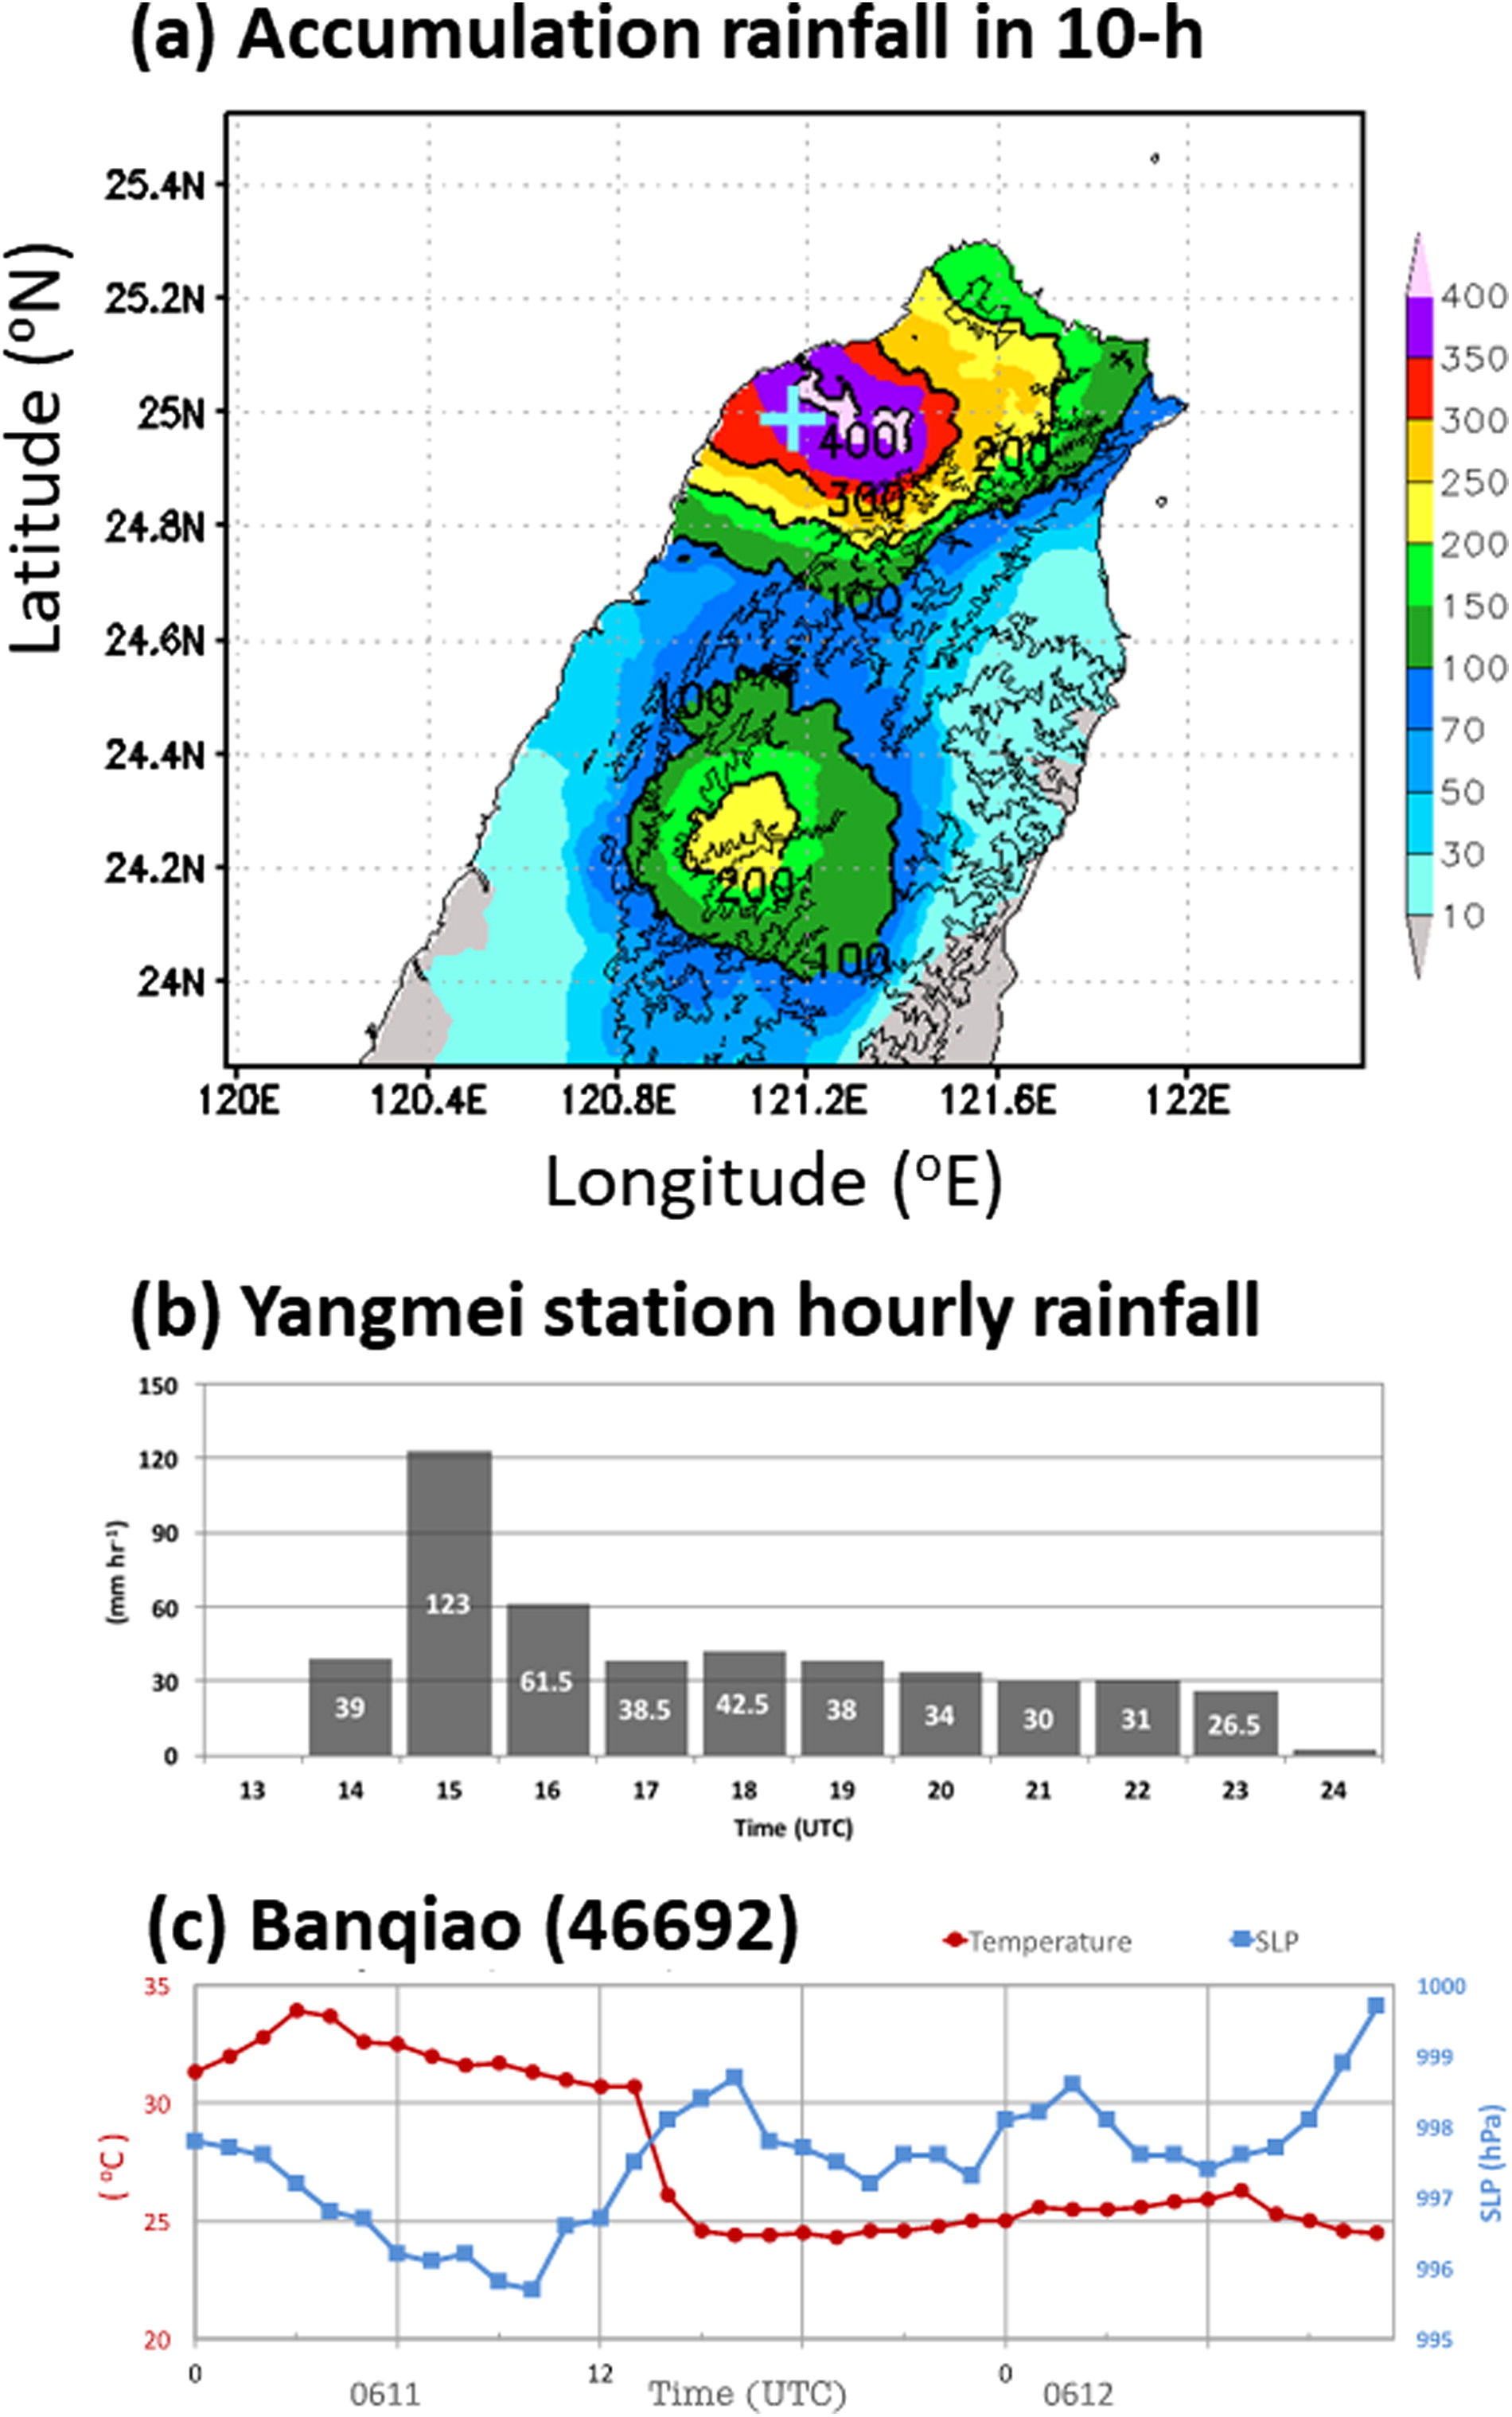
Fig. 5.
(a) accumulated rainfall within 10-h over the analysis domain from 1400 UTC 11 June to 0000 UTC 12 June 2012; (b) the hourly rainfall (grey bar) from 1300 UTC to 0000 UTC 12 June at Yangmei station (121.14°E, 24.92°N, blue cross in Fig. 4a); (c) Banqiao station (121.44°E, 24.99°N, 46692) surface temperature and sea level pressure from 0000 UTC 11 June to 1200 UTC 12 June.
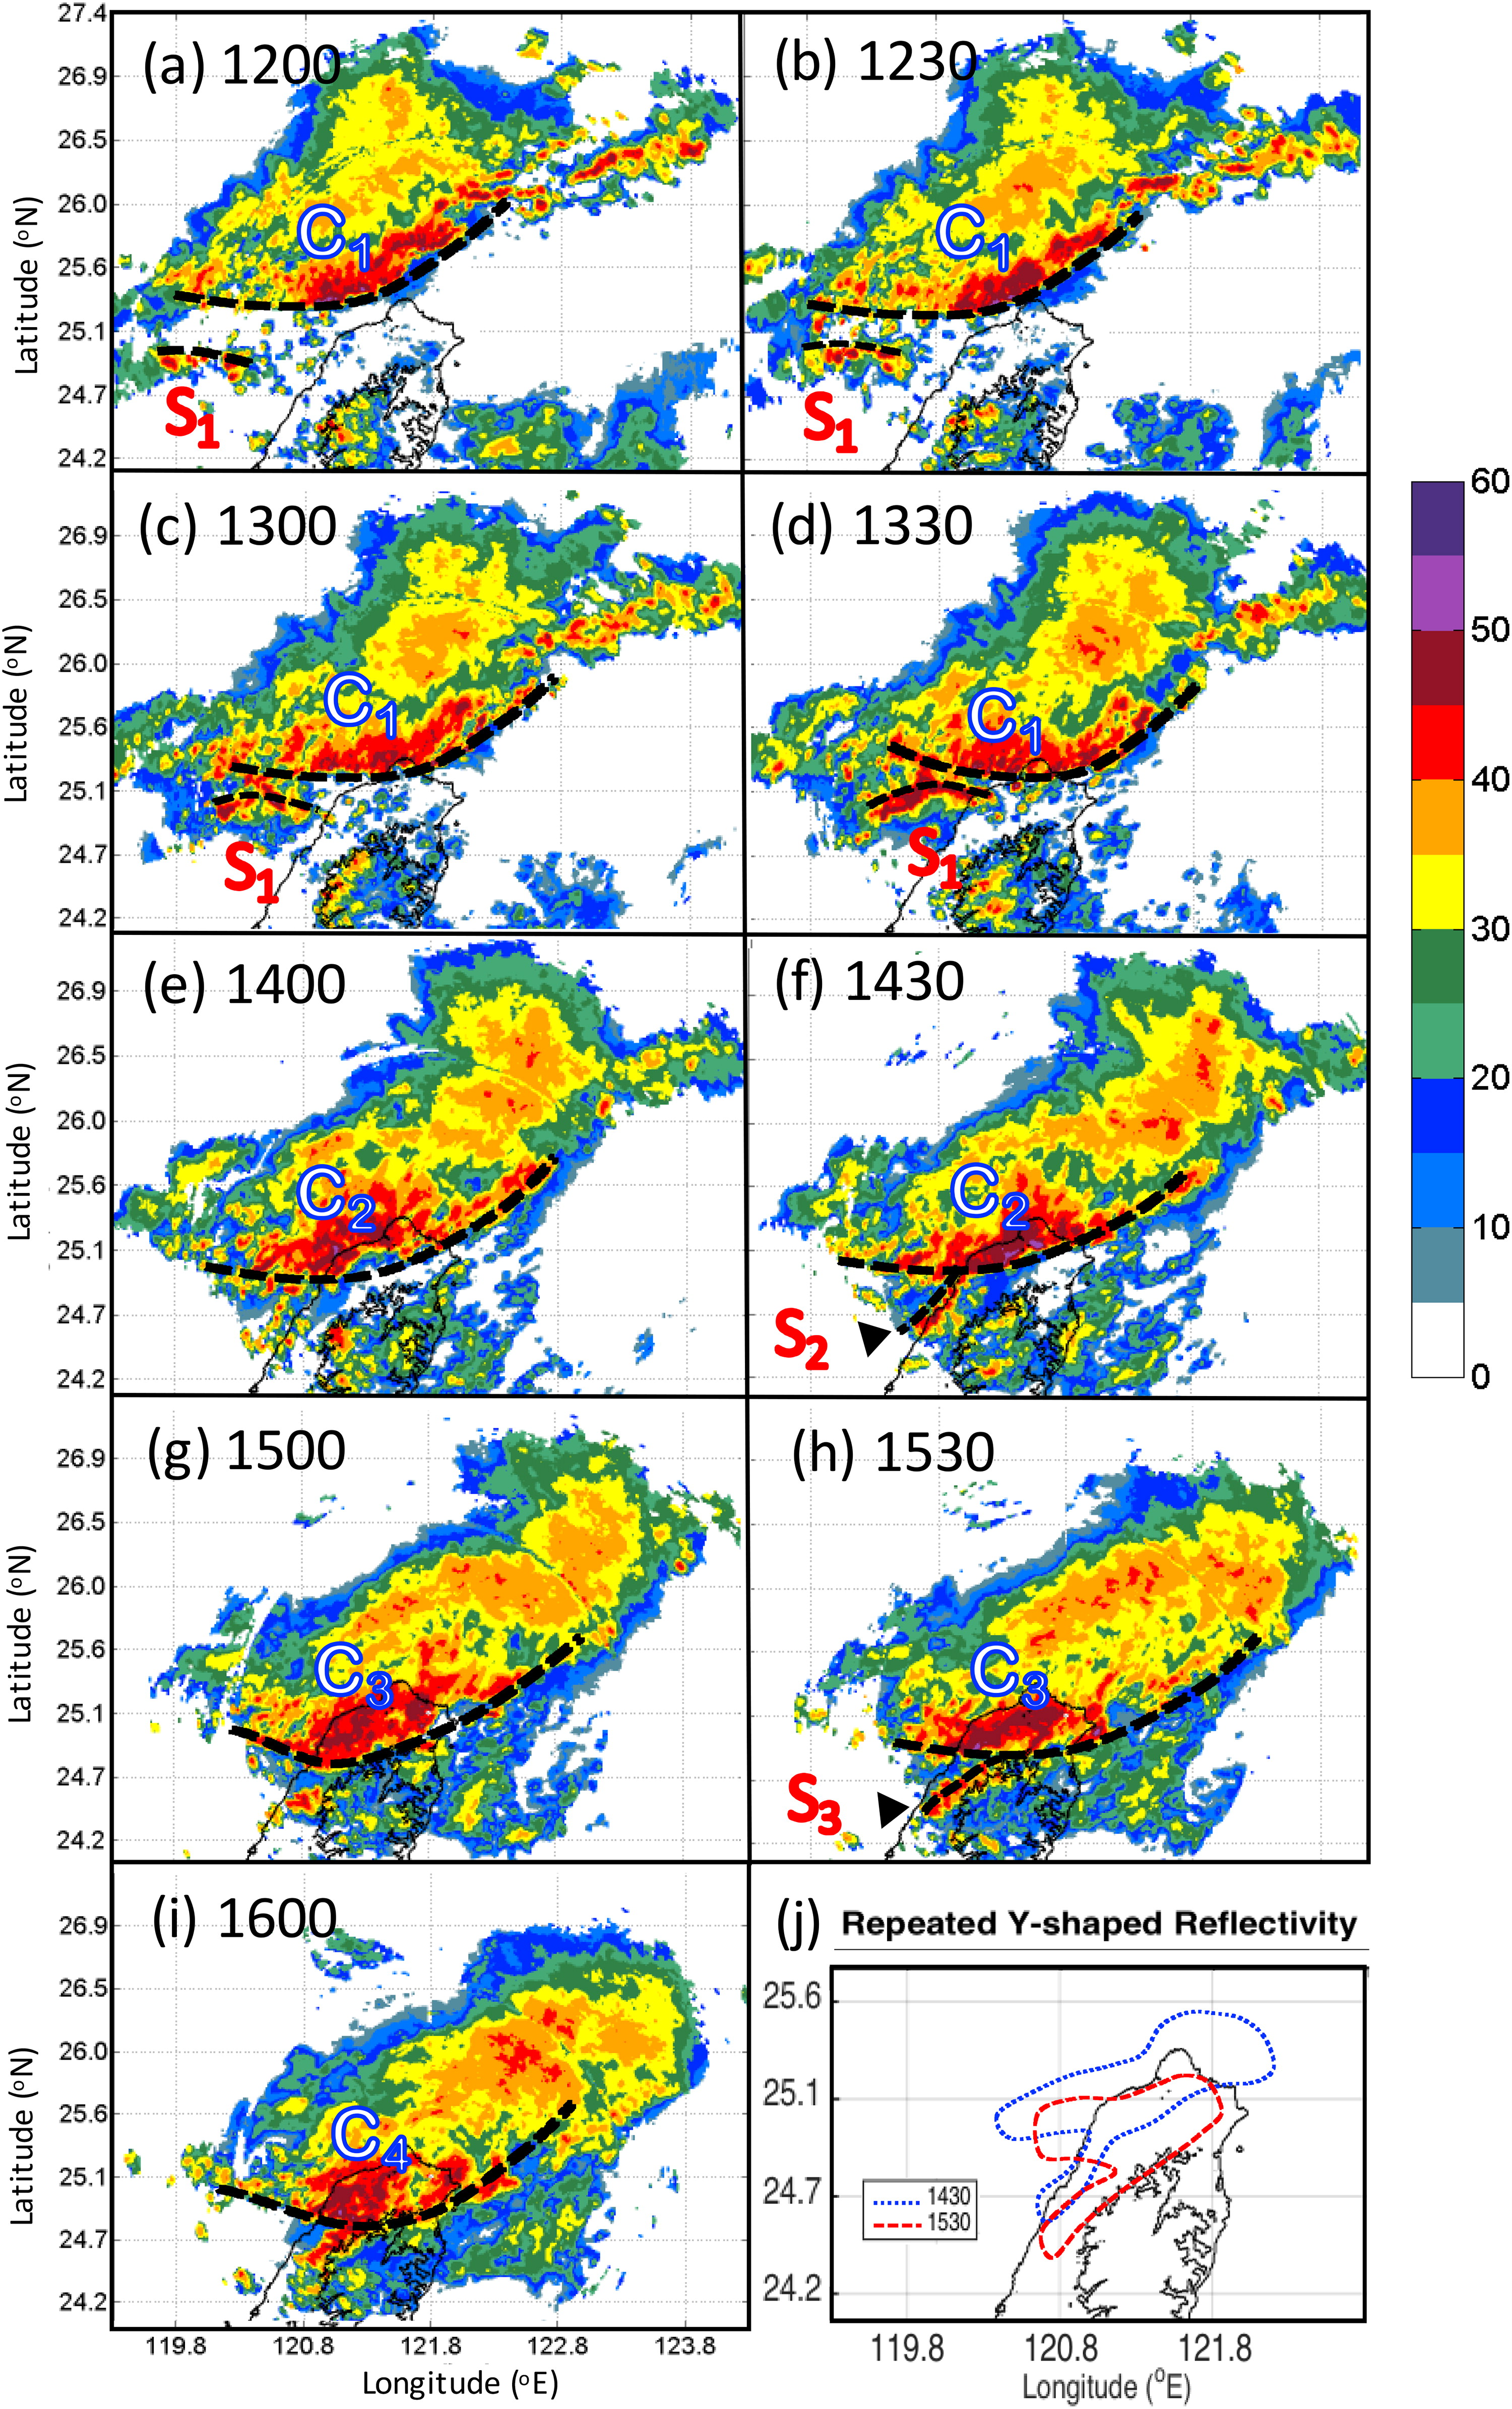
Fig. 6.
The maximum reflectivity of RCWF radar on 11 June 2012 at: (a) 1200 UTC; (b) 1230 UTC; (c) 1300 UTC; (d) 1330 UTC; (e) 1400 UTC; (f) 1430 UTC; (g) 1500 UTC; (h) 1530 UTC; (i) 1600 UTC. C1, C2, C3 and C4 indicate the main convection of the precipitation system (reflectivity ≥ 40 dBZ) in different stages. S1, S2 and S3 are the line convection that occurred in different stages. (j) The contours of 40 dBZ shows repeated Y-shaped reflectivity at 1430 UTC and 1530 UTC.
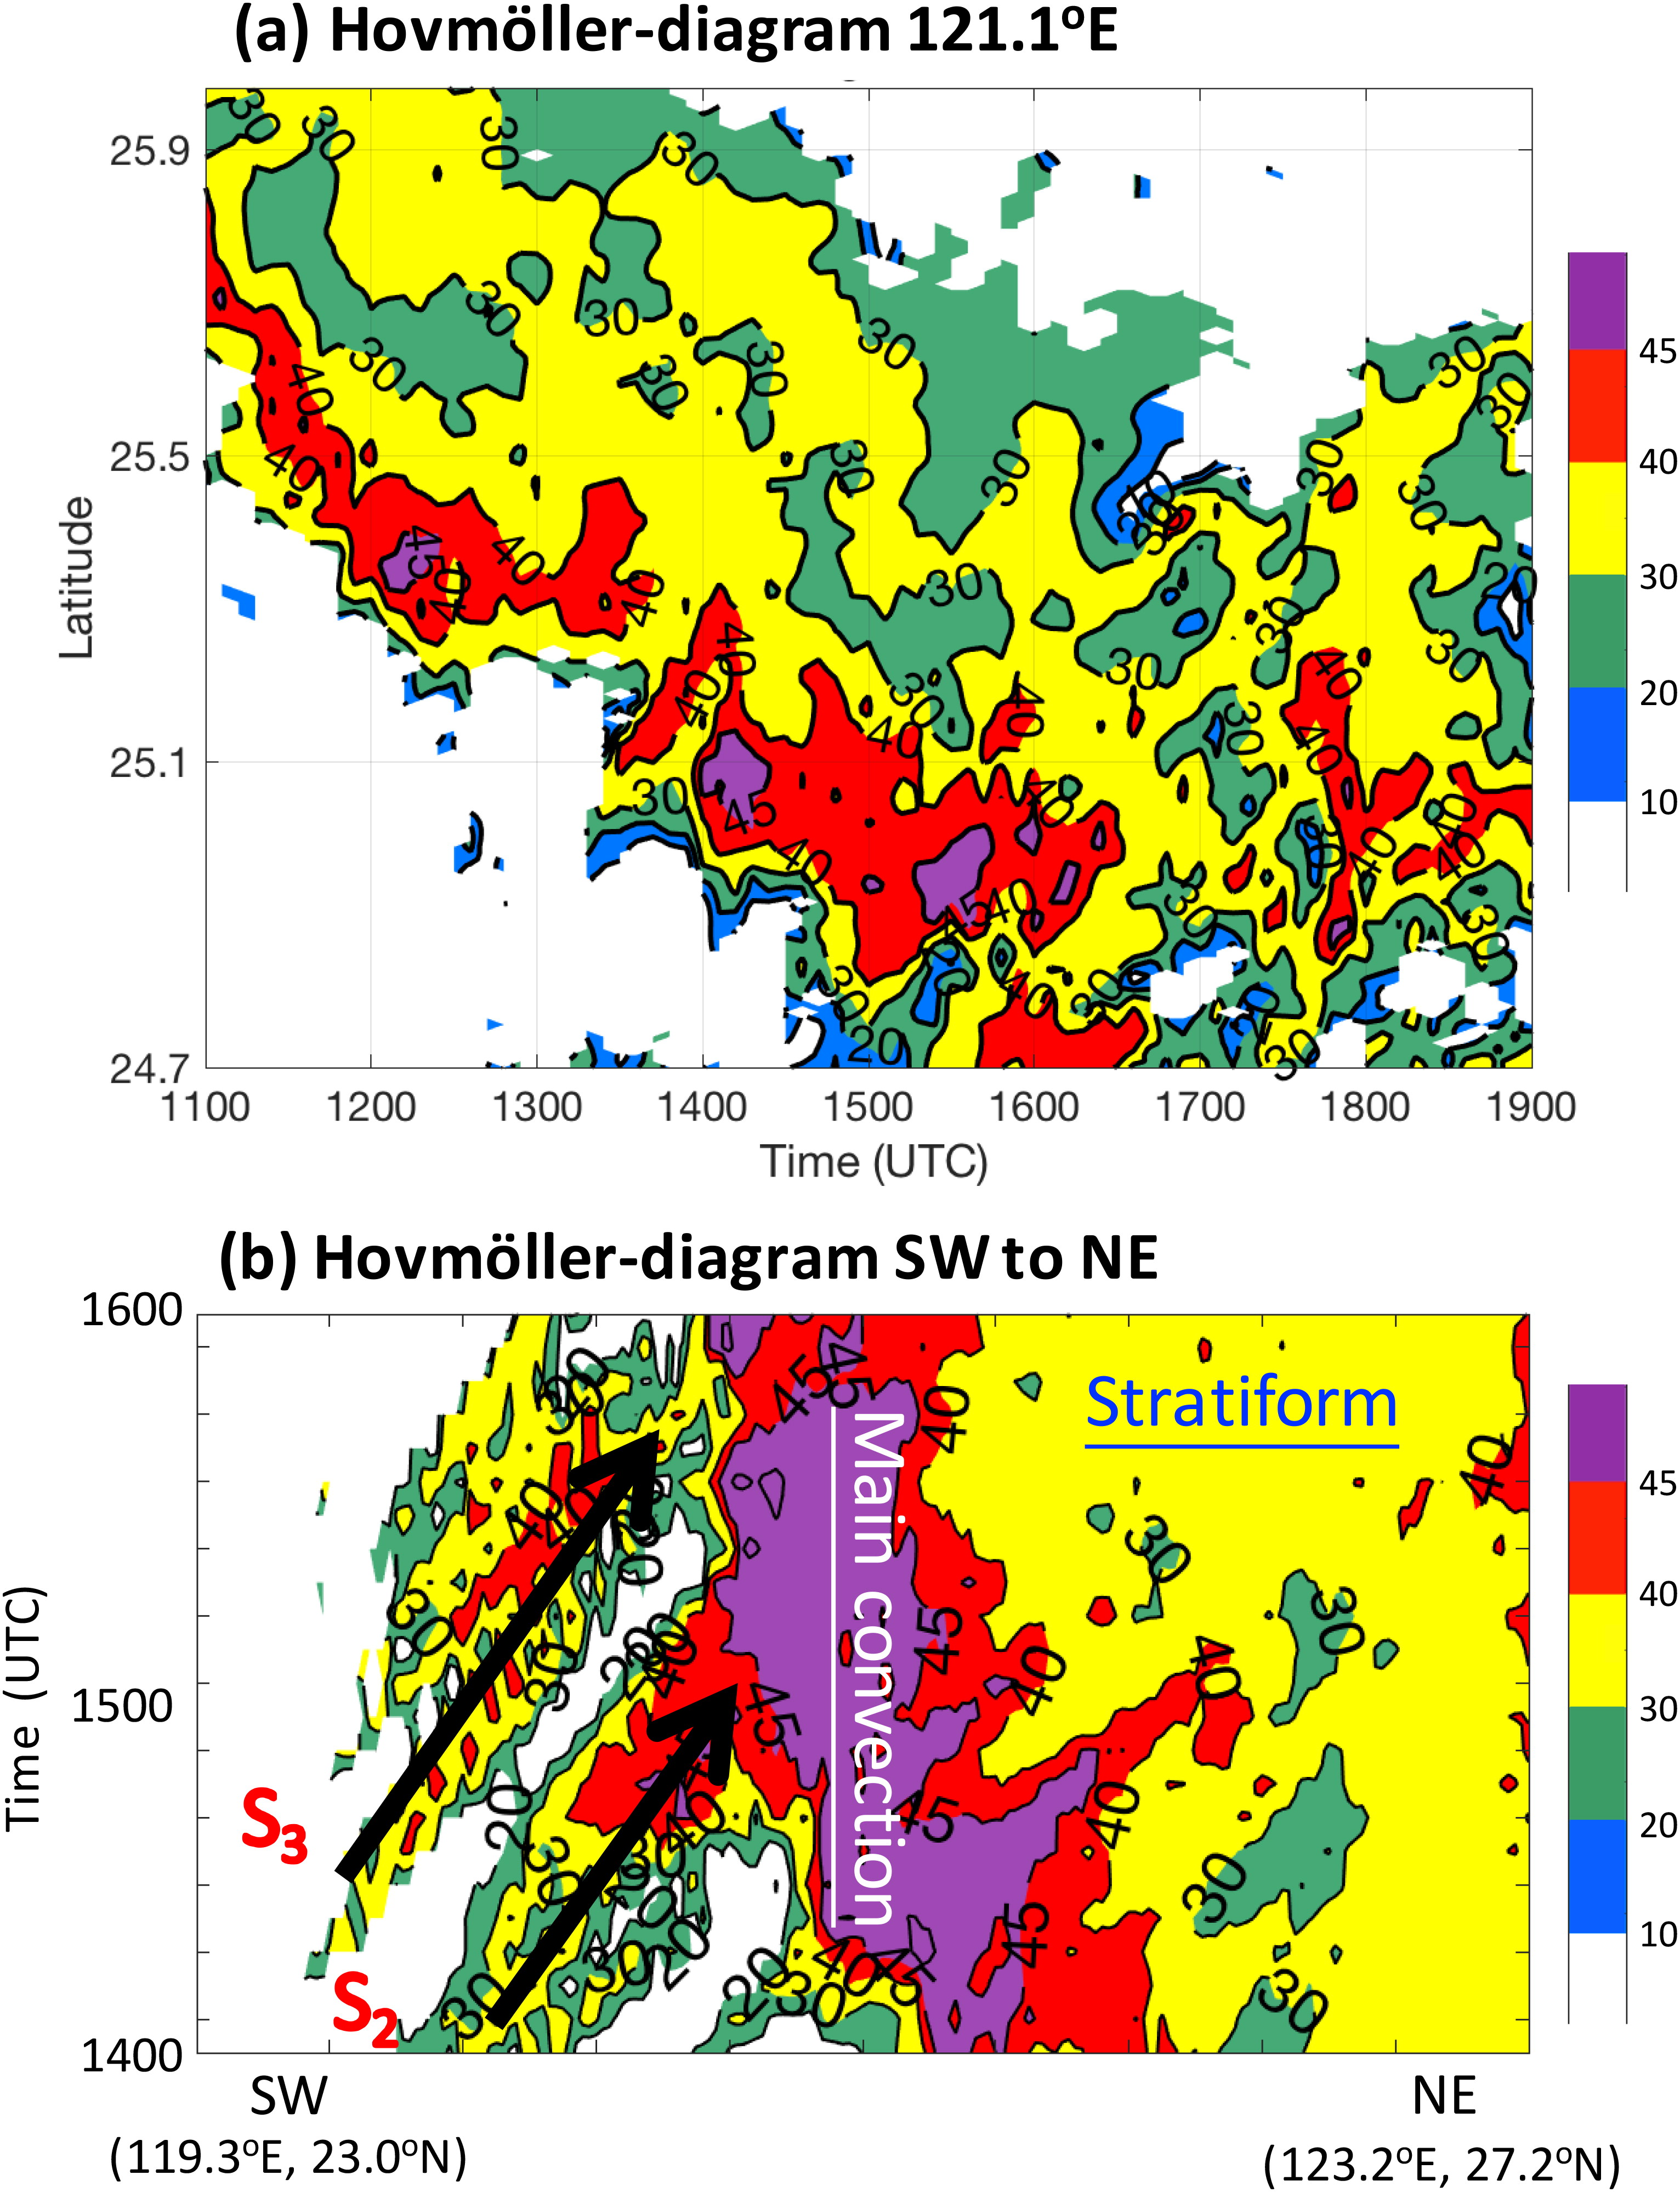
Fig. 7.
Hovmöller time series (every 6-min) of radar reflectivity (contours are 20, 30, 40, 45dBZ): (a) Averaged within 10-km in the longitudinal (121.1°E), and the latitudinal range between 24.7°N and 26°N from 1100 to 1900 UTC on 11 June 2012; (b) Zoomed detail in between 1400 and 1600 UTC and averaged within 10-km from south-west (latitudinal: 23.0°N, longitudinal: 119.3°E) to north-east (latitudinal: 27.2°N, longitudinal: 123.2°E).
Table 3.
Features on the precipitation system in three stages.
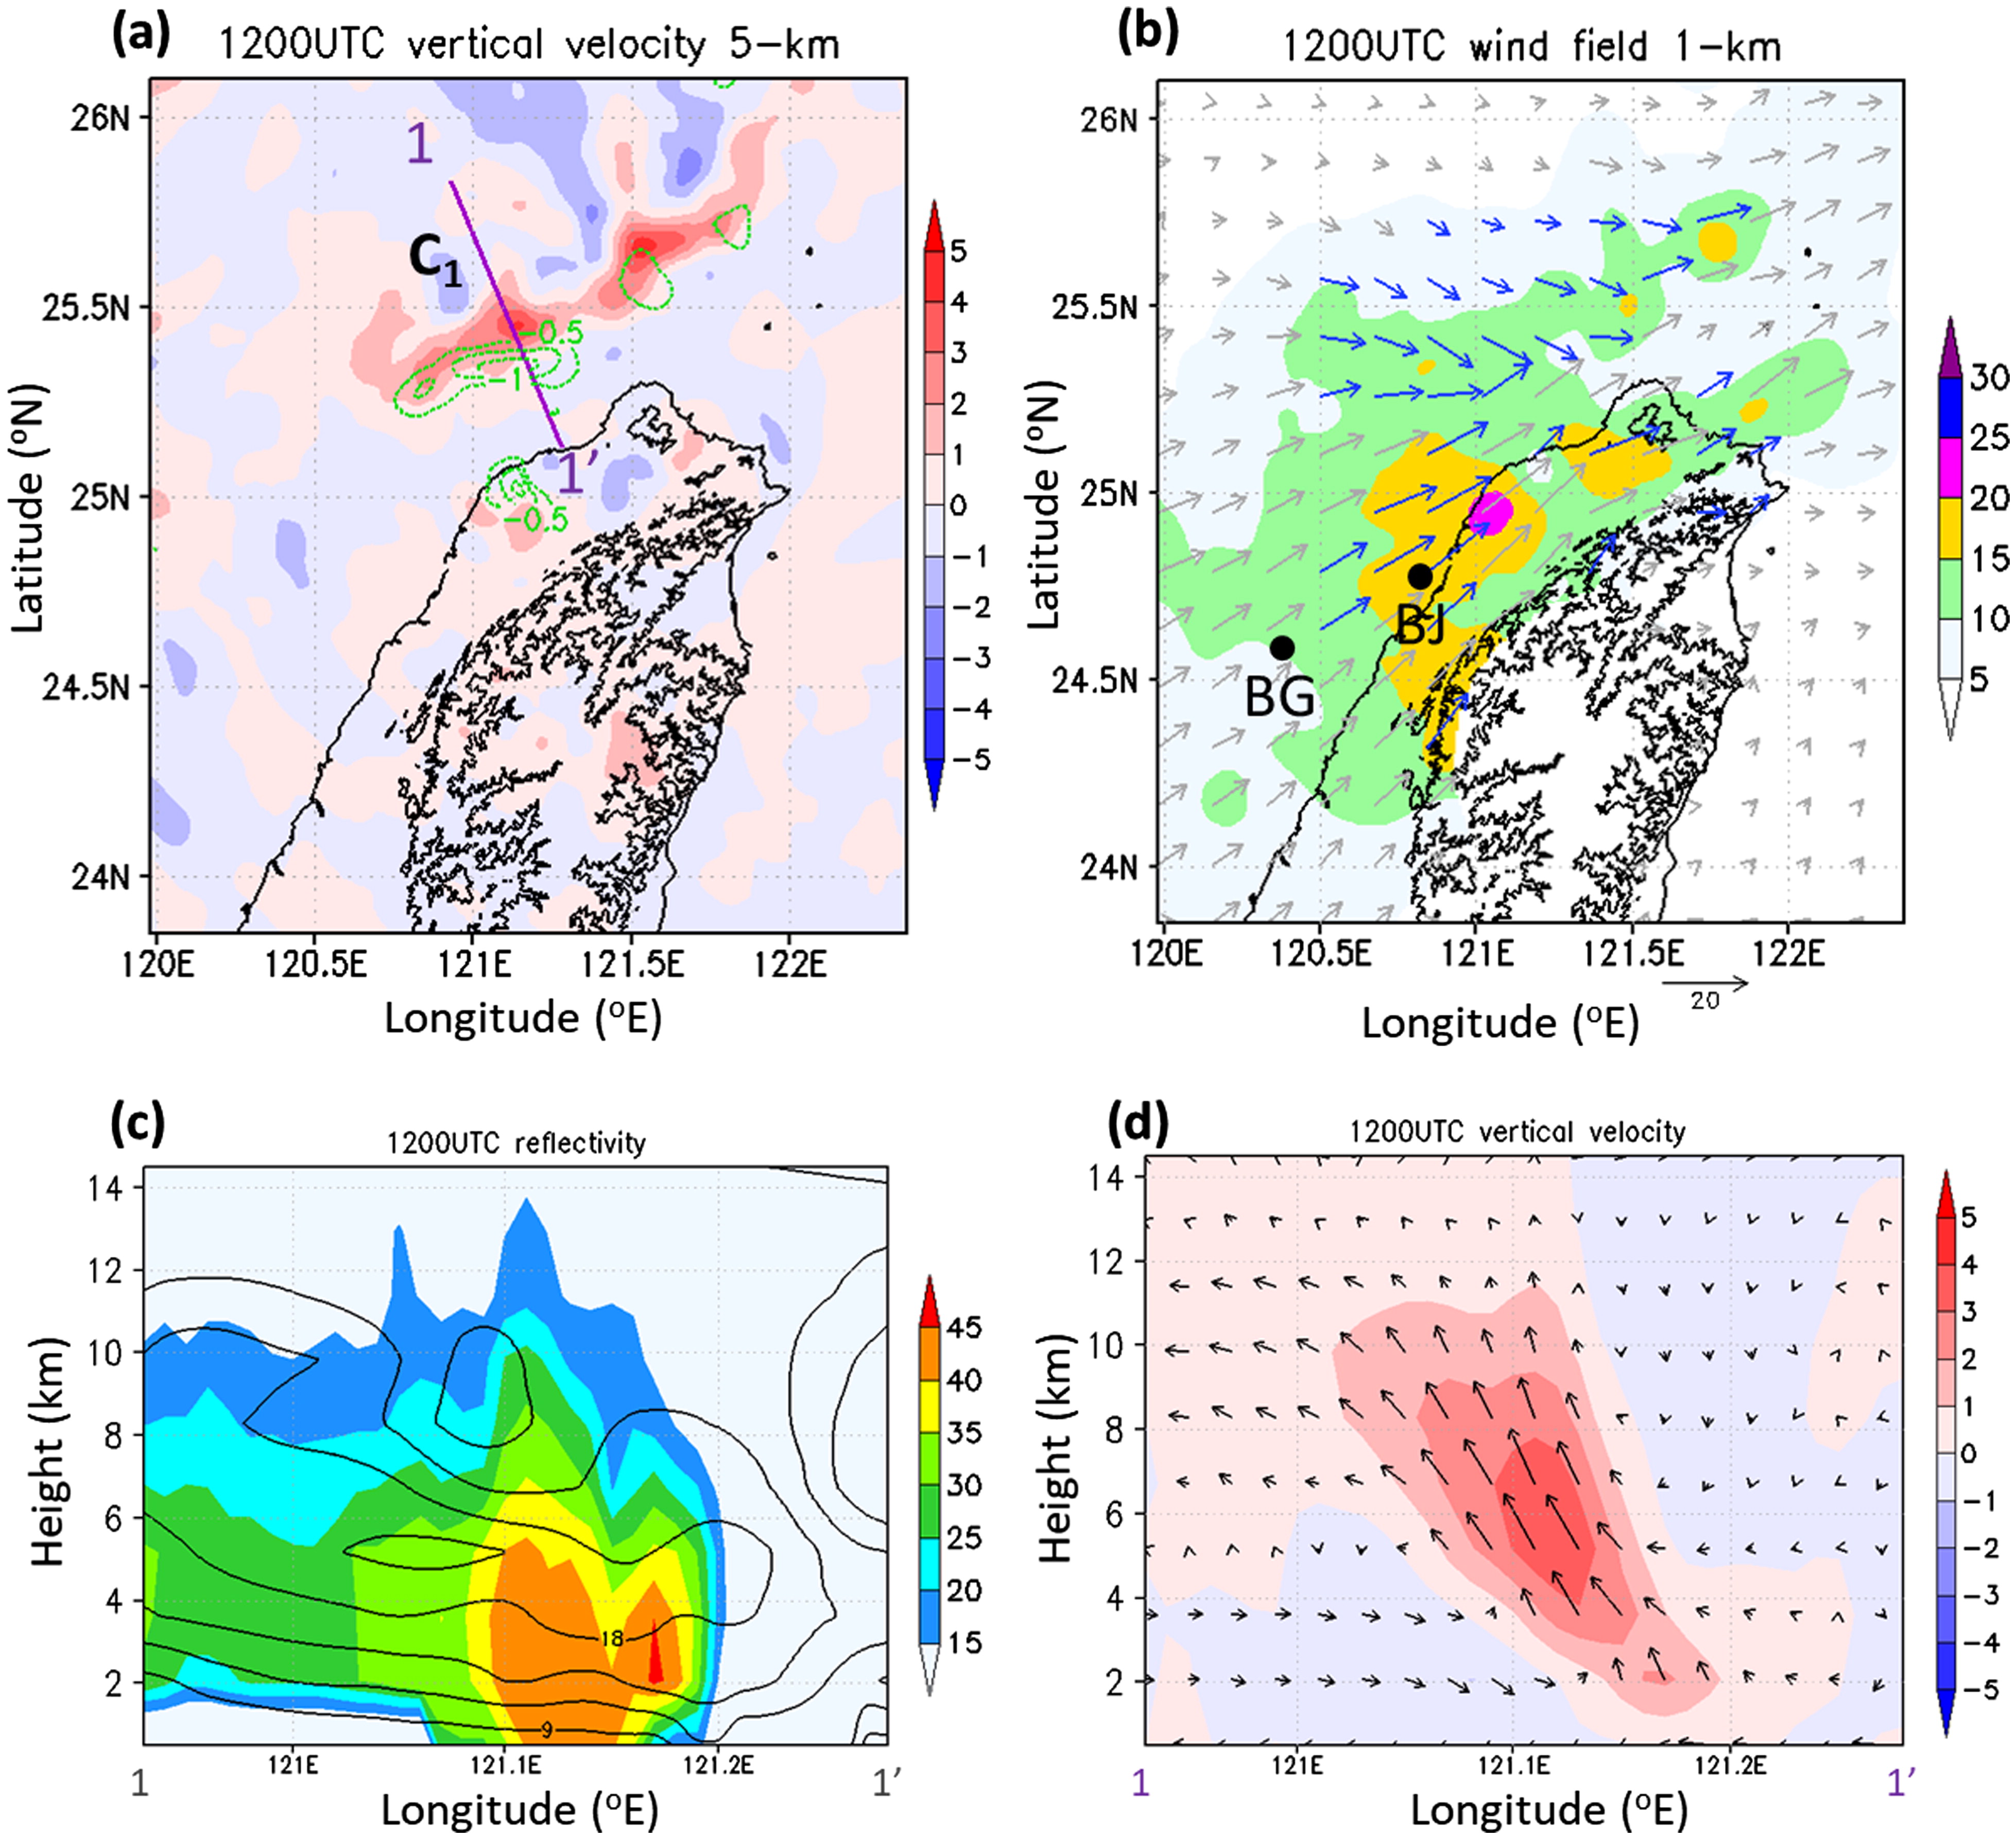
Fig. 8.
Retrieved result at 1200 UTC 11 June 2012: (a) vertical velocity (colour shaded, unit: m s−1) at 5 km and convergence area (green contour, interval is 0.5 × 10⁻³ s−1) at 1 km; (b) horizontal wind speed (unit: m s−1) and wind vector at 1 km height (blue colour shows wind retrieved with radar observations, and grey colour indicates retrieved wind beyond radar observations); (c) vertical cross-section (see Fig. 8a) of radar reflectivity (colour shaded, unit: dBZ) and the horizontal wind speed (contour lines); (d) cross-section of vertical wind (colour shaded, unit: m s−1) and wind vector relative to the system motion.
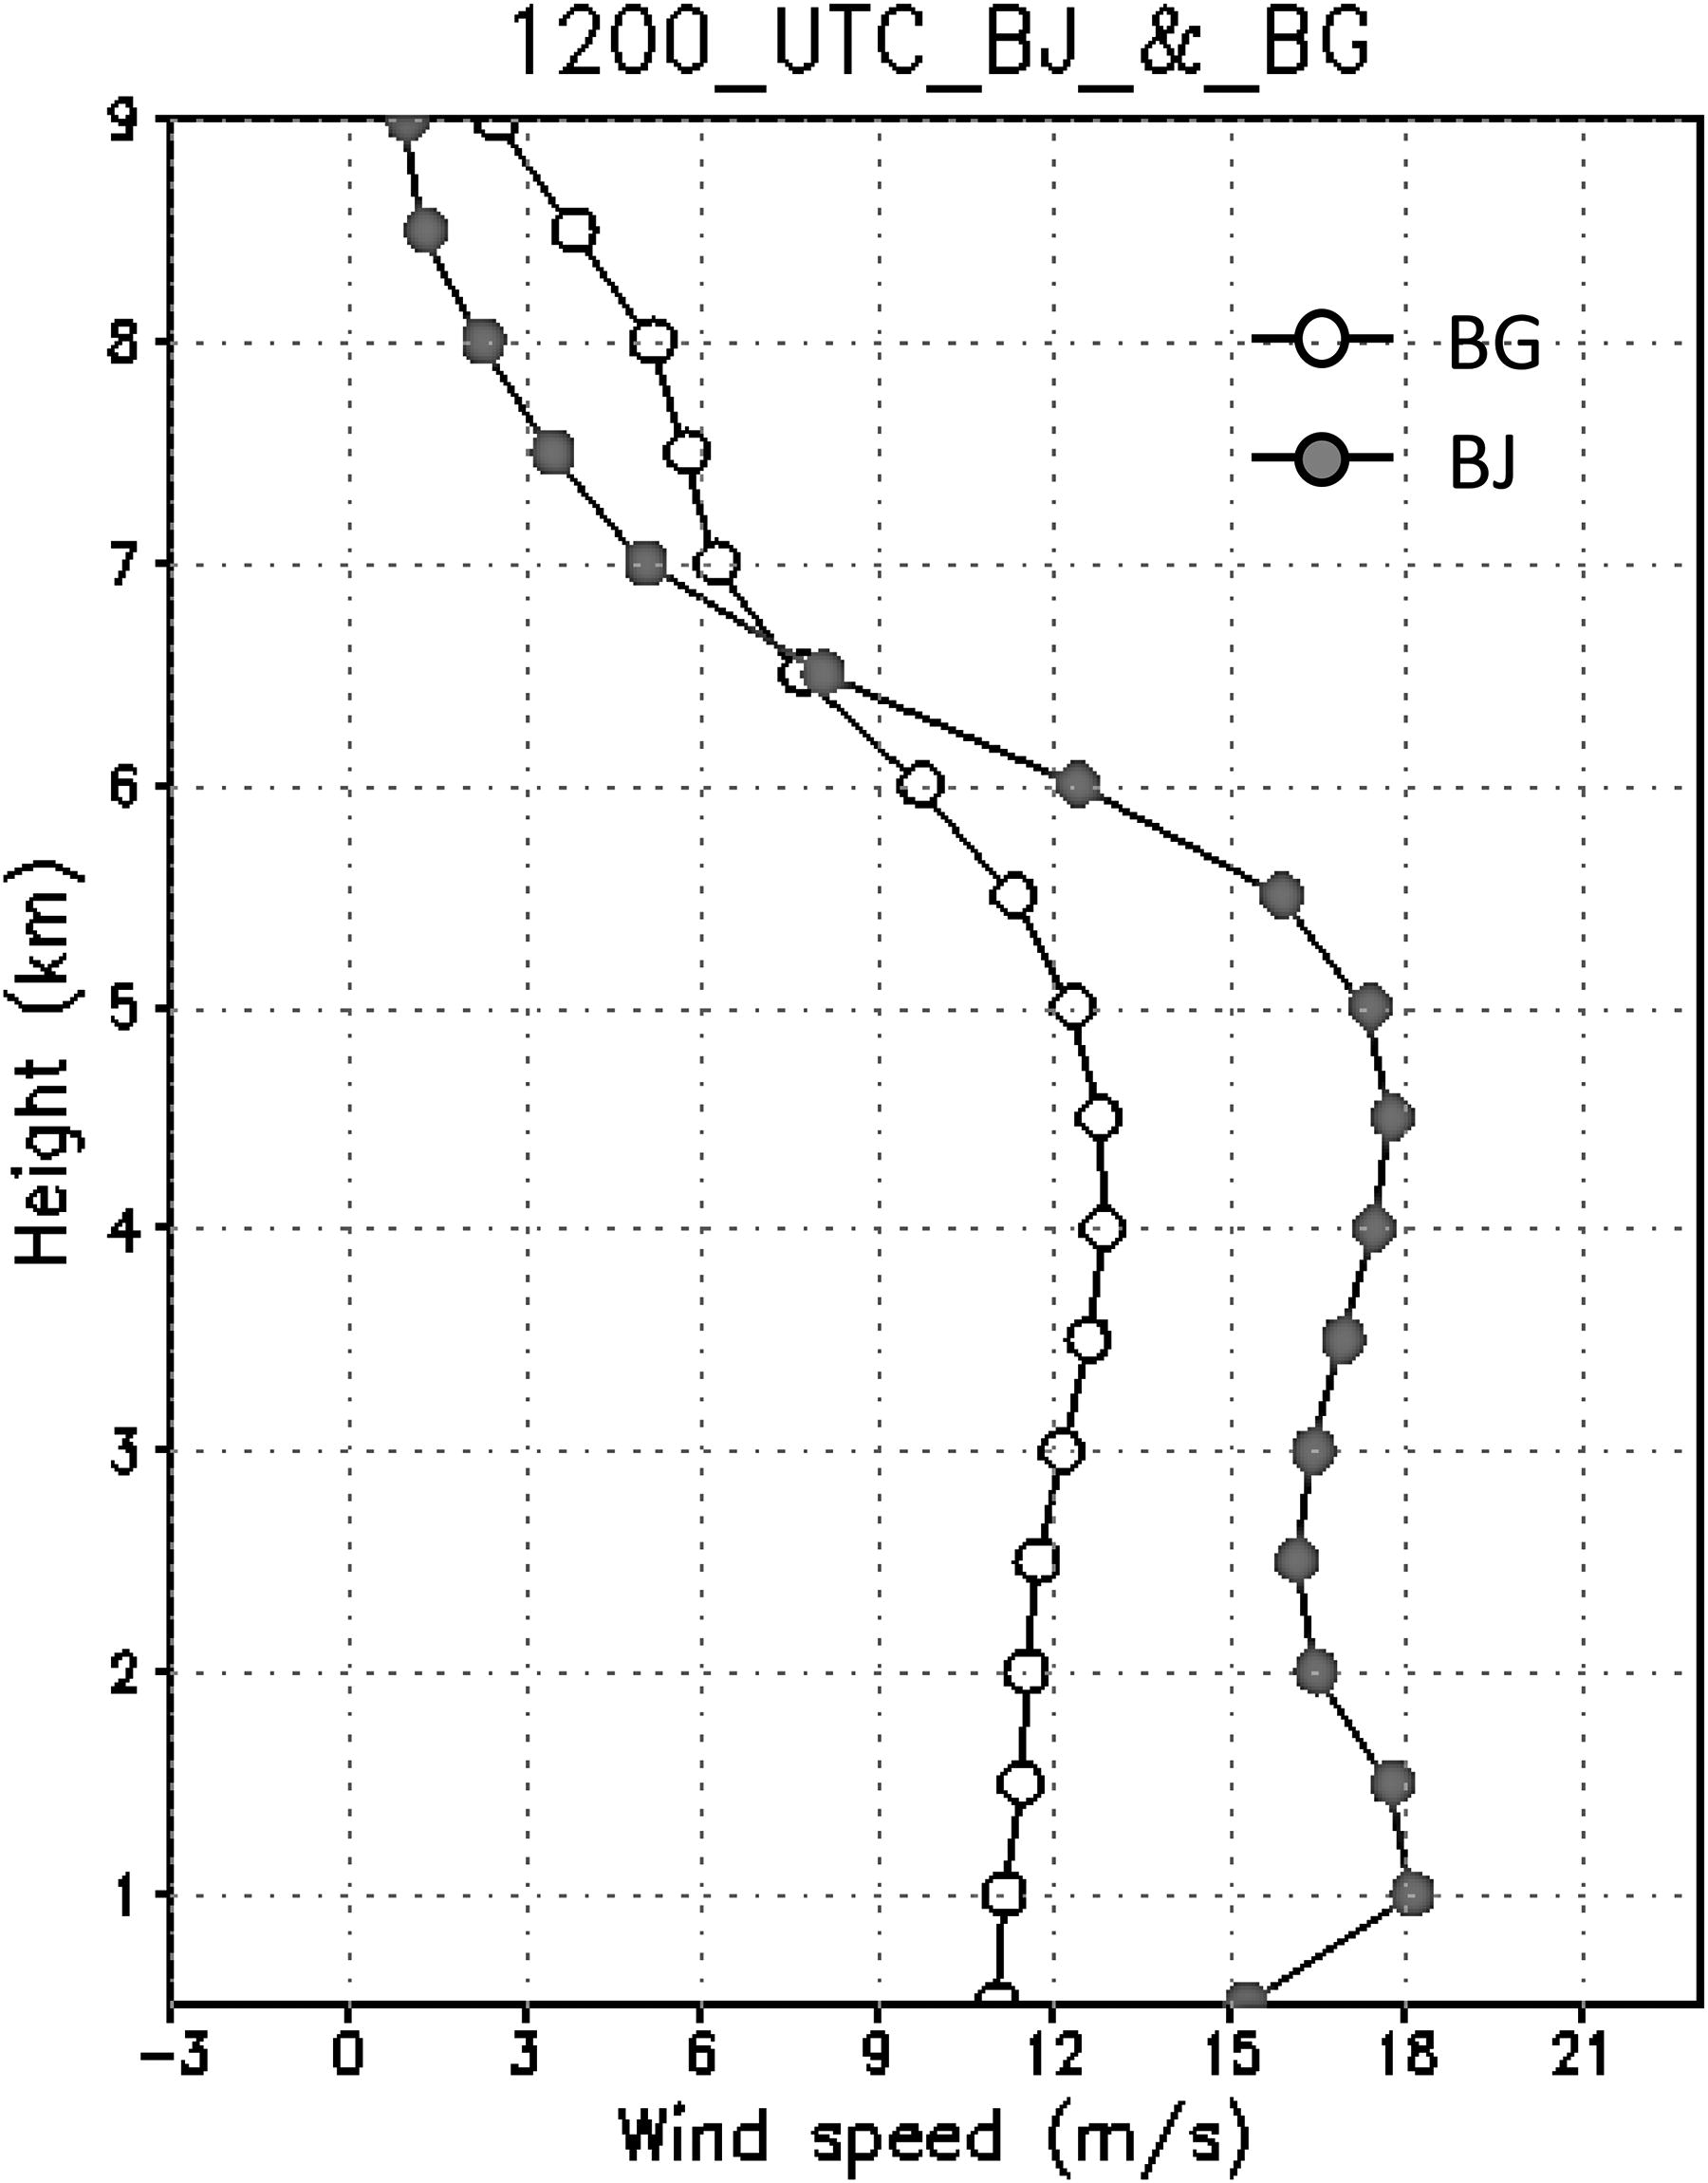
Fig. 9.
Profile of the wind speed at the location of environment flow (BG, latitude: 24.6°N, longitude: 120.4°E) and maximum of barrier jet (BJ, latitude: 24.8°N, longitude: 120.8°E) at 1200 UTC. The location of BG and BJ is shown in Fig. 8b.
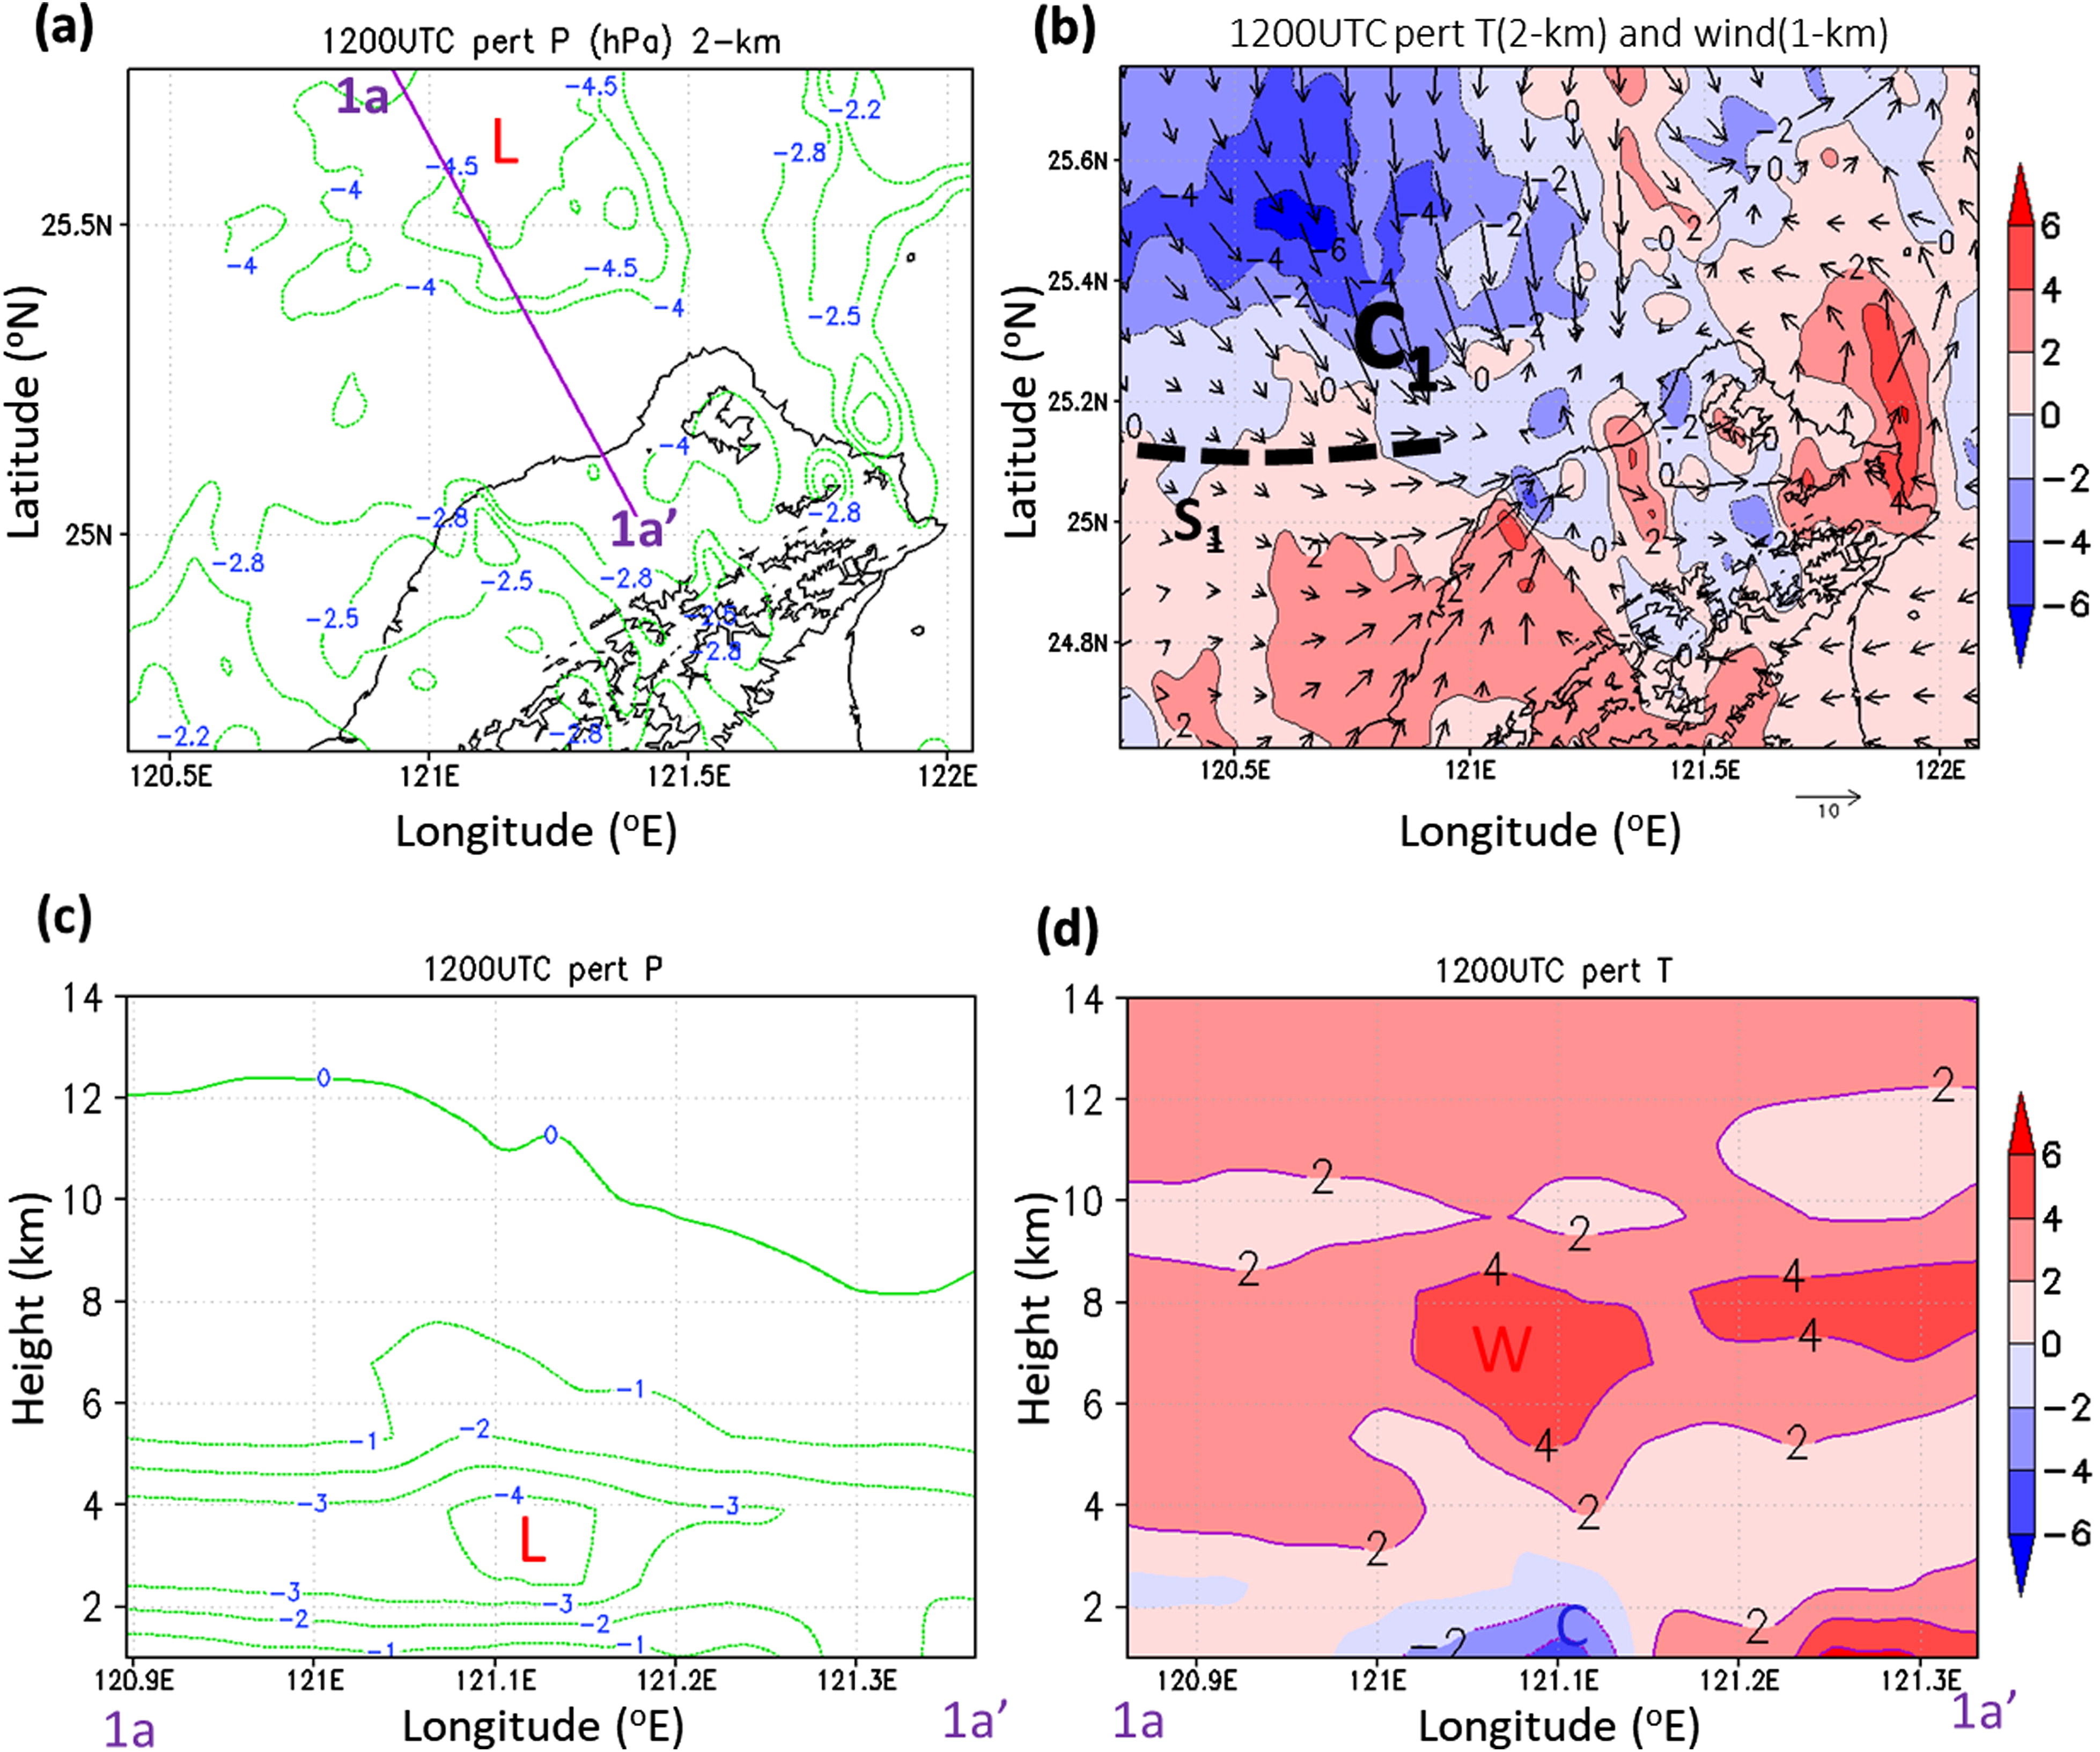
Fig. 10.
Retrieved thermodynamic perturbations at 1200 UTC 11 June 2012: (a) pressure at 2 km; (b) temperature at level 2 km (shaded), and wind direction of relative background at 1-km height (vector); (c) cross-section (see Fig. 10a) of pressure; (d) cross-section of temperature. (unit of pressure: hPa, unit of temperature: K) Horizontal wind vector in (b) is relative to southwesterly flow of Makung station and the dashed line indicates the location of cold outflow boundary at 1-km height.
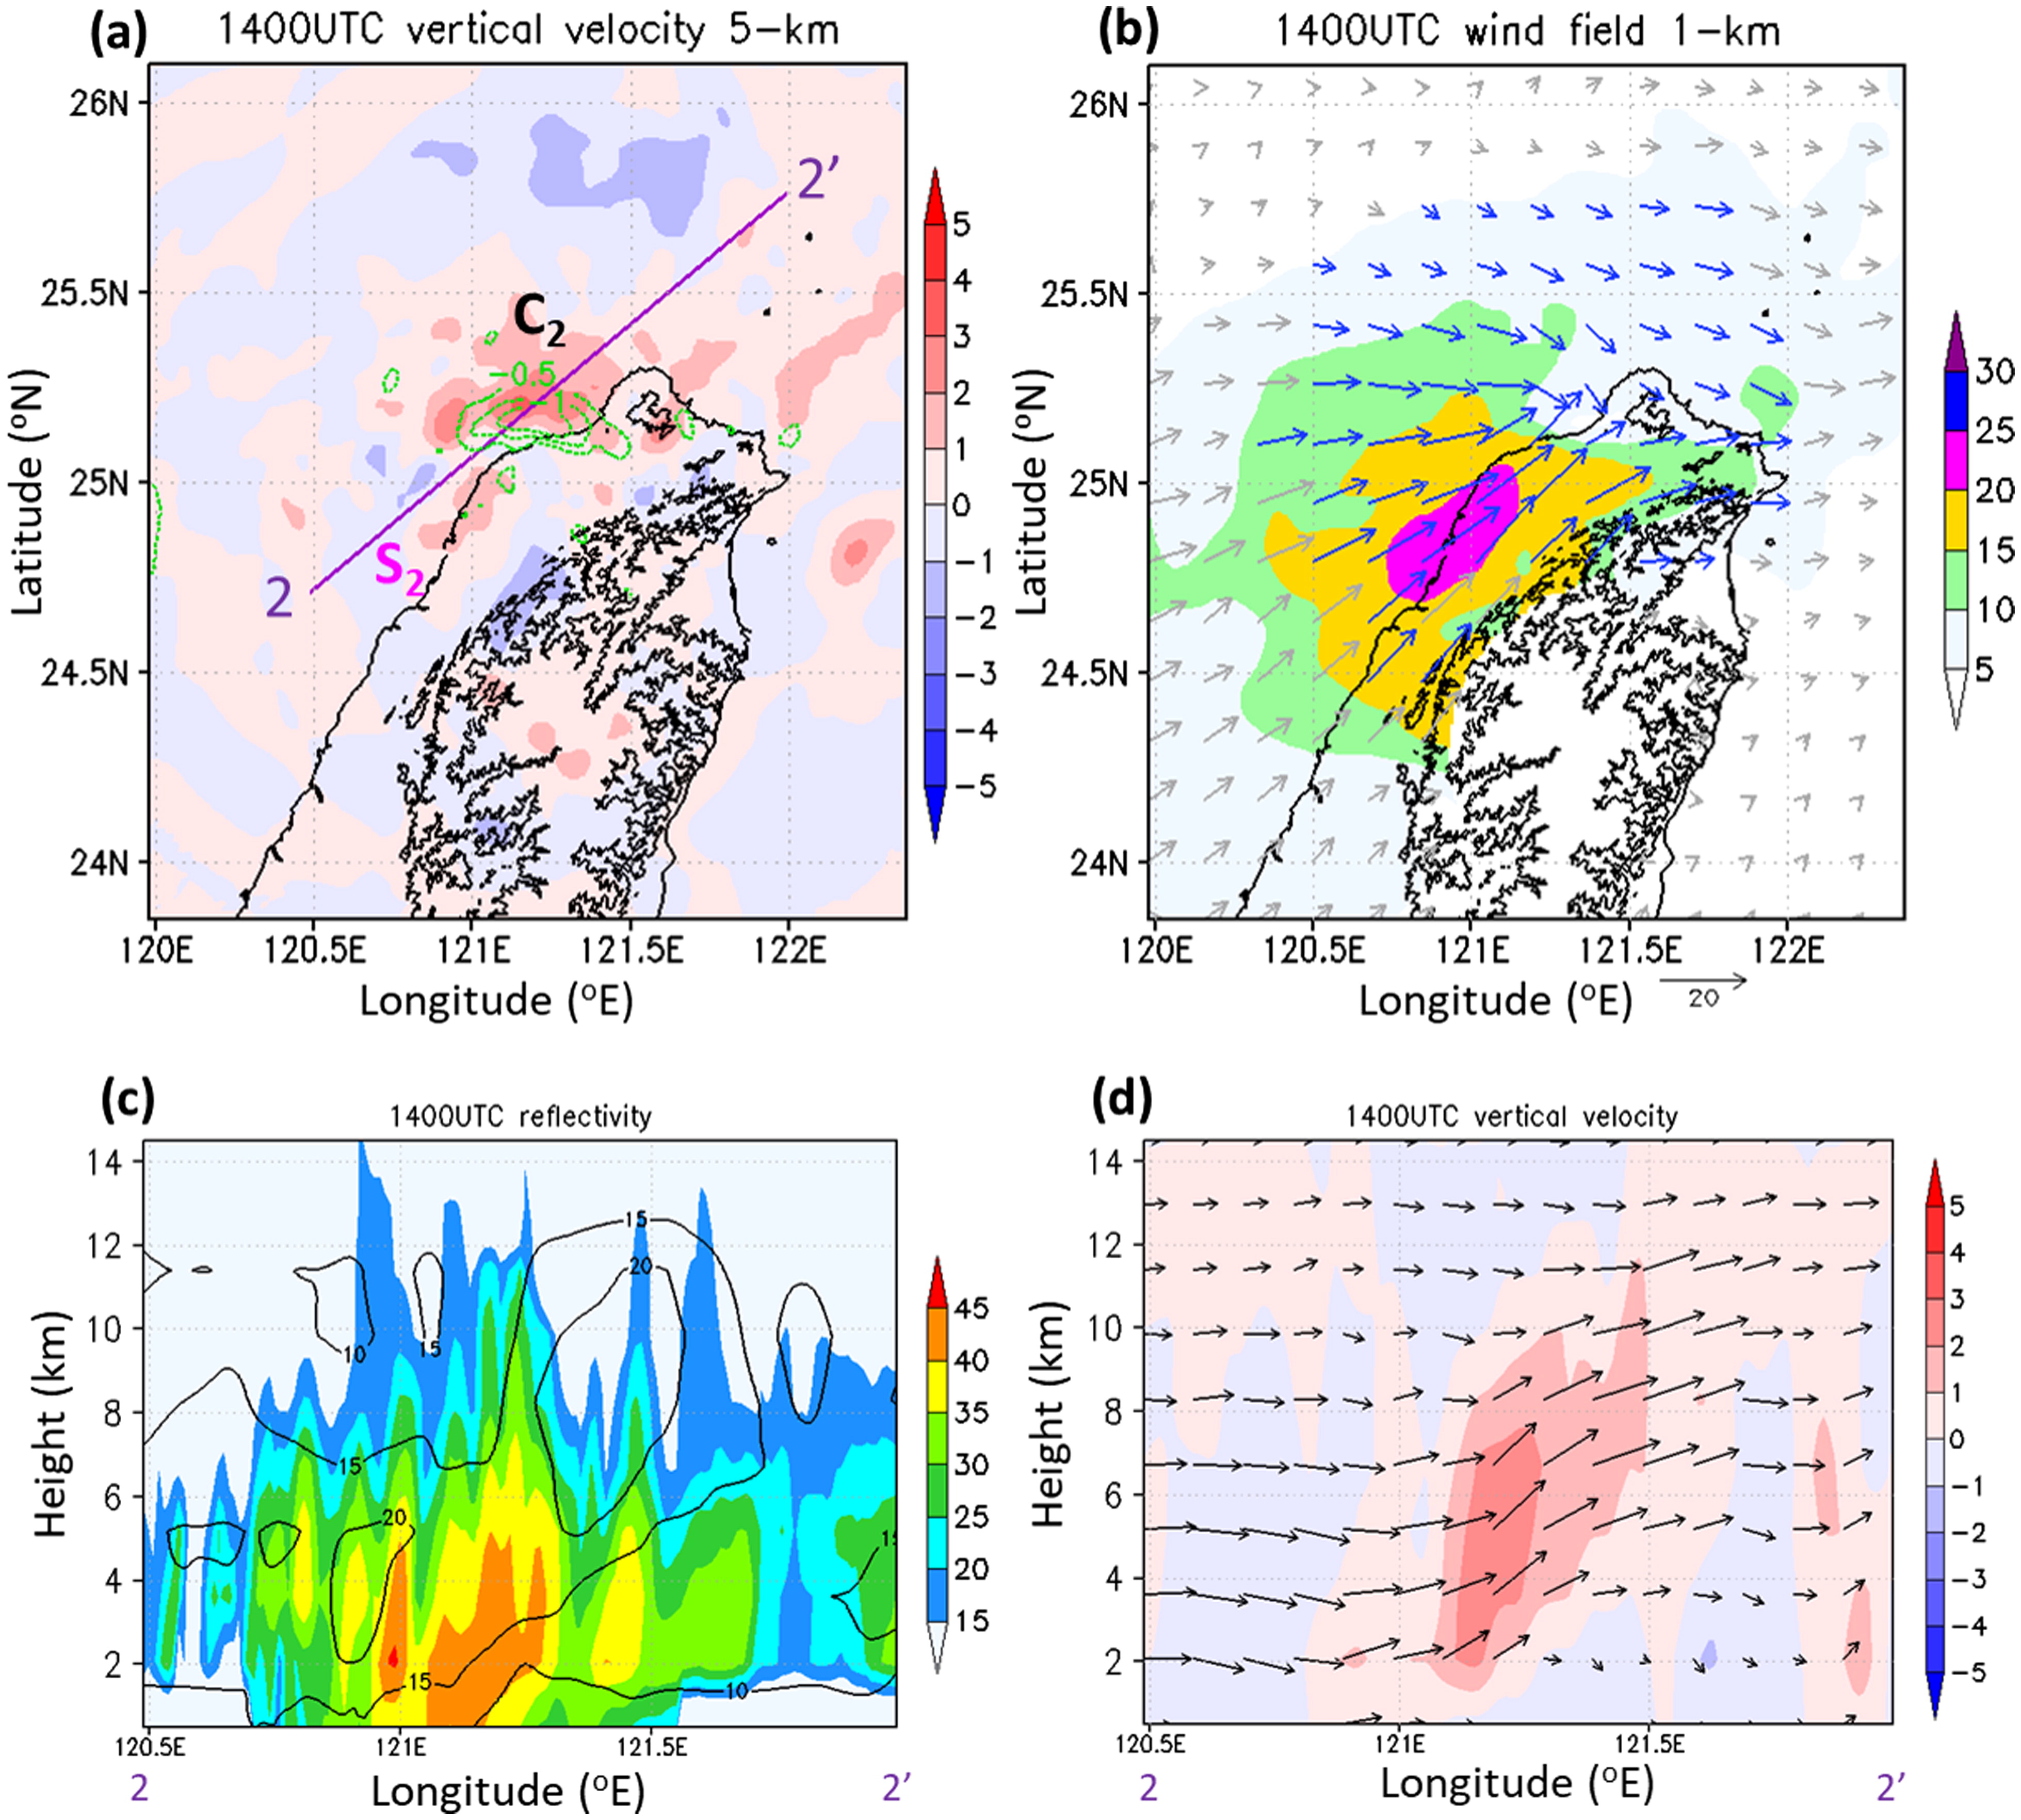
Fig. 11.
Same as Fig. 8 but at 1400 UTC 11 June 2012. The location of cross-section of (c) and (d) is in Fig. 11a.
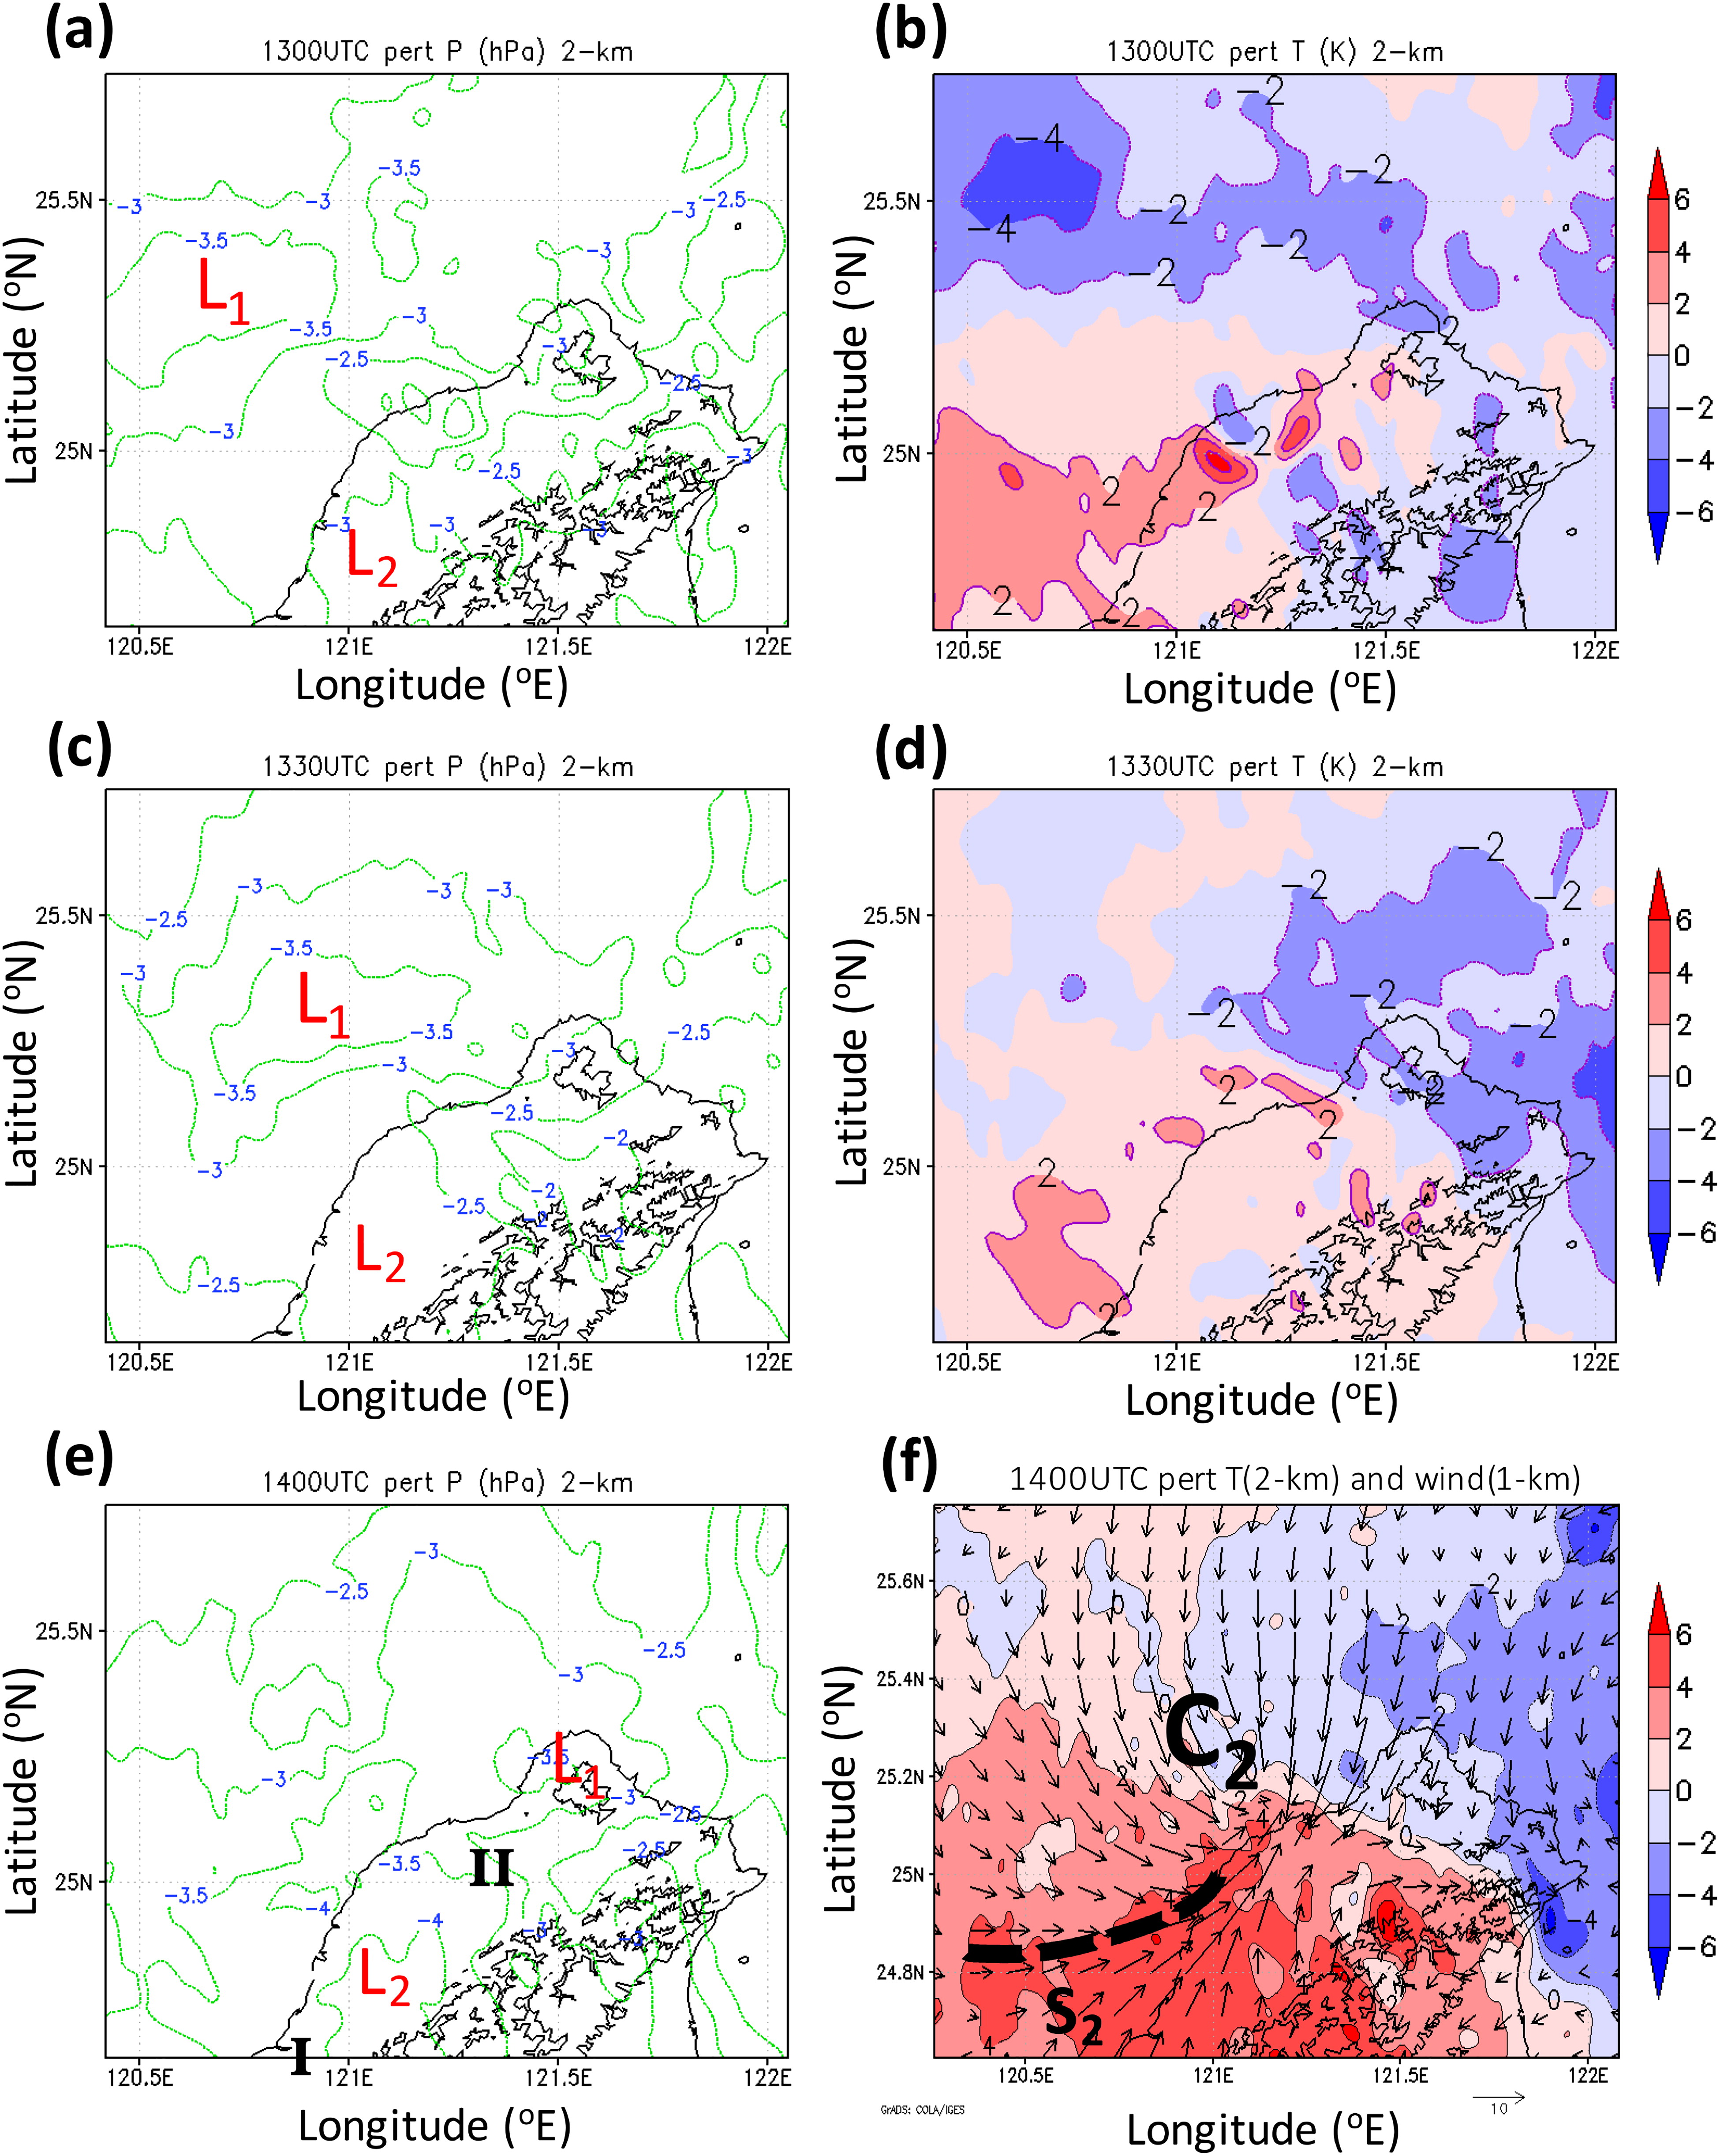
Fig. 12.
Retrieved thermodynamic perturbations from 1300 to 1400 UTC of 2-km height: (a), (c) and (e) are horizontal pressure fields (unit of pressure: hPa); (b), (d) and (f) are temperature fields (unit of temperature: K). Horizontal wind vector in (f) is relative to southwesterly flow of Makung station and the dashed line indicates the location of cold outflow boundary at 1-km height.
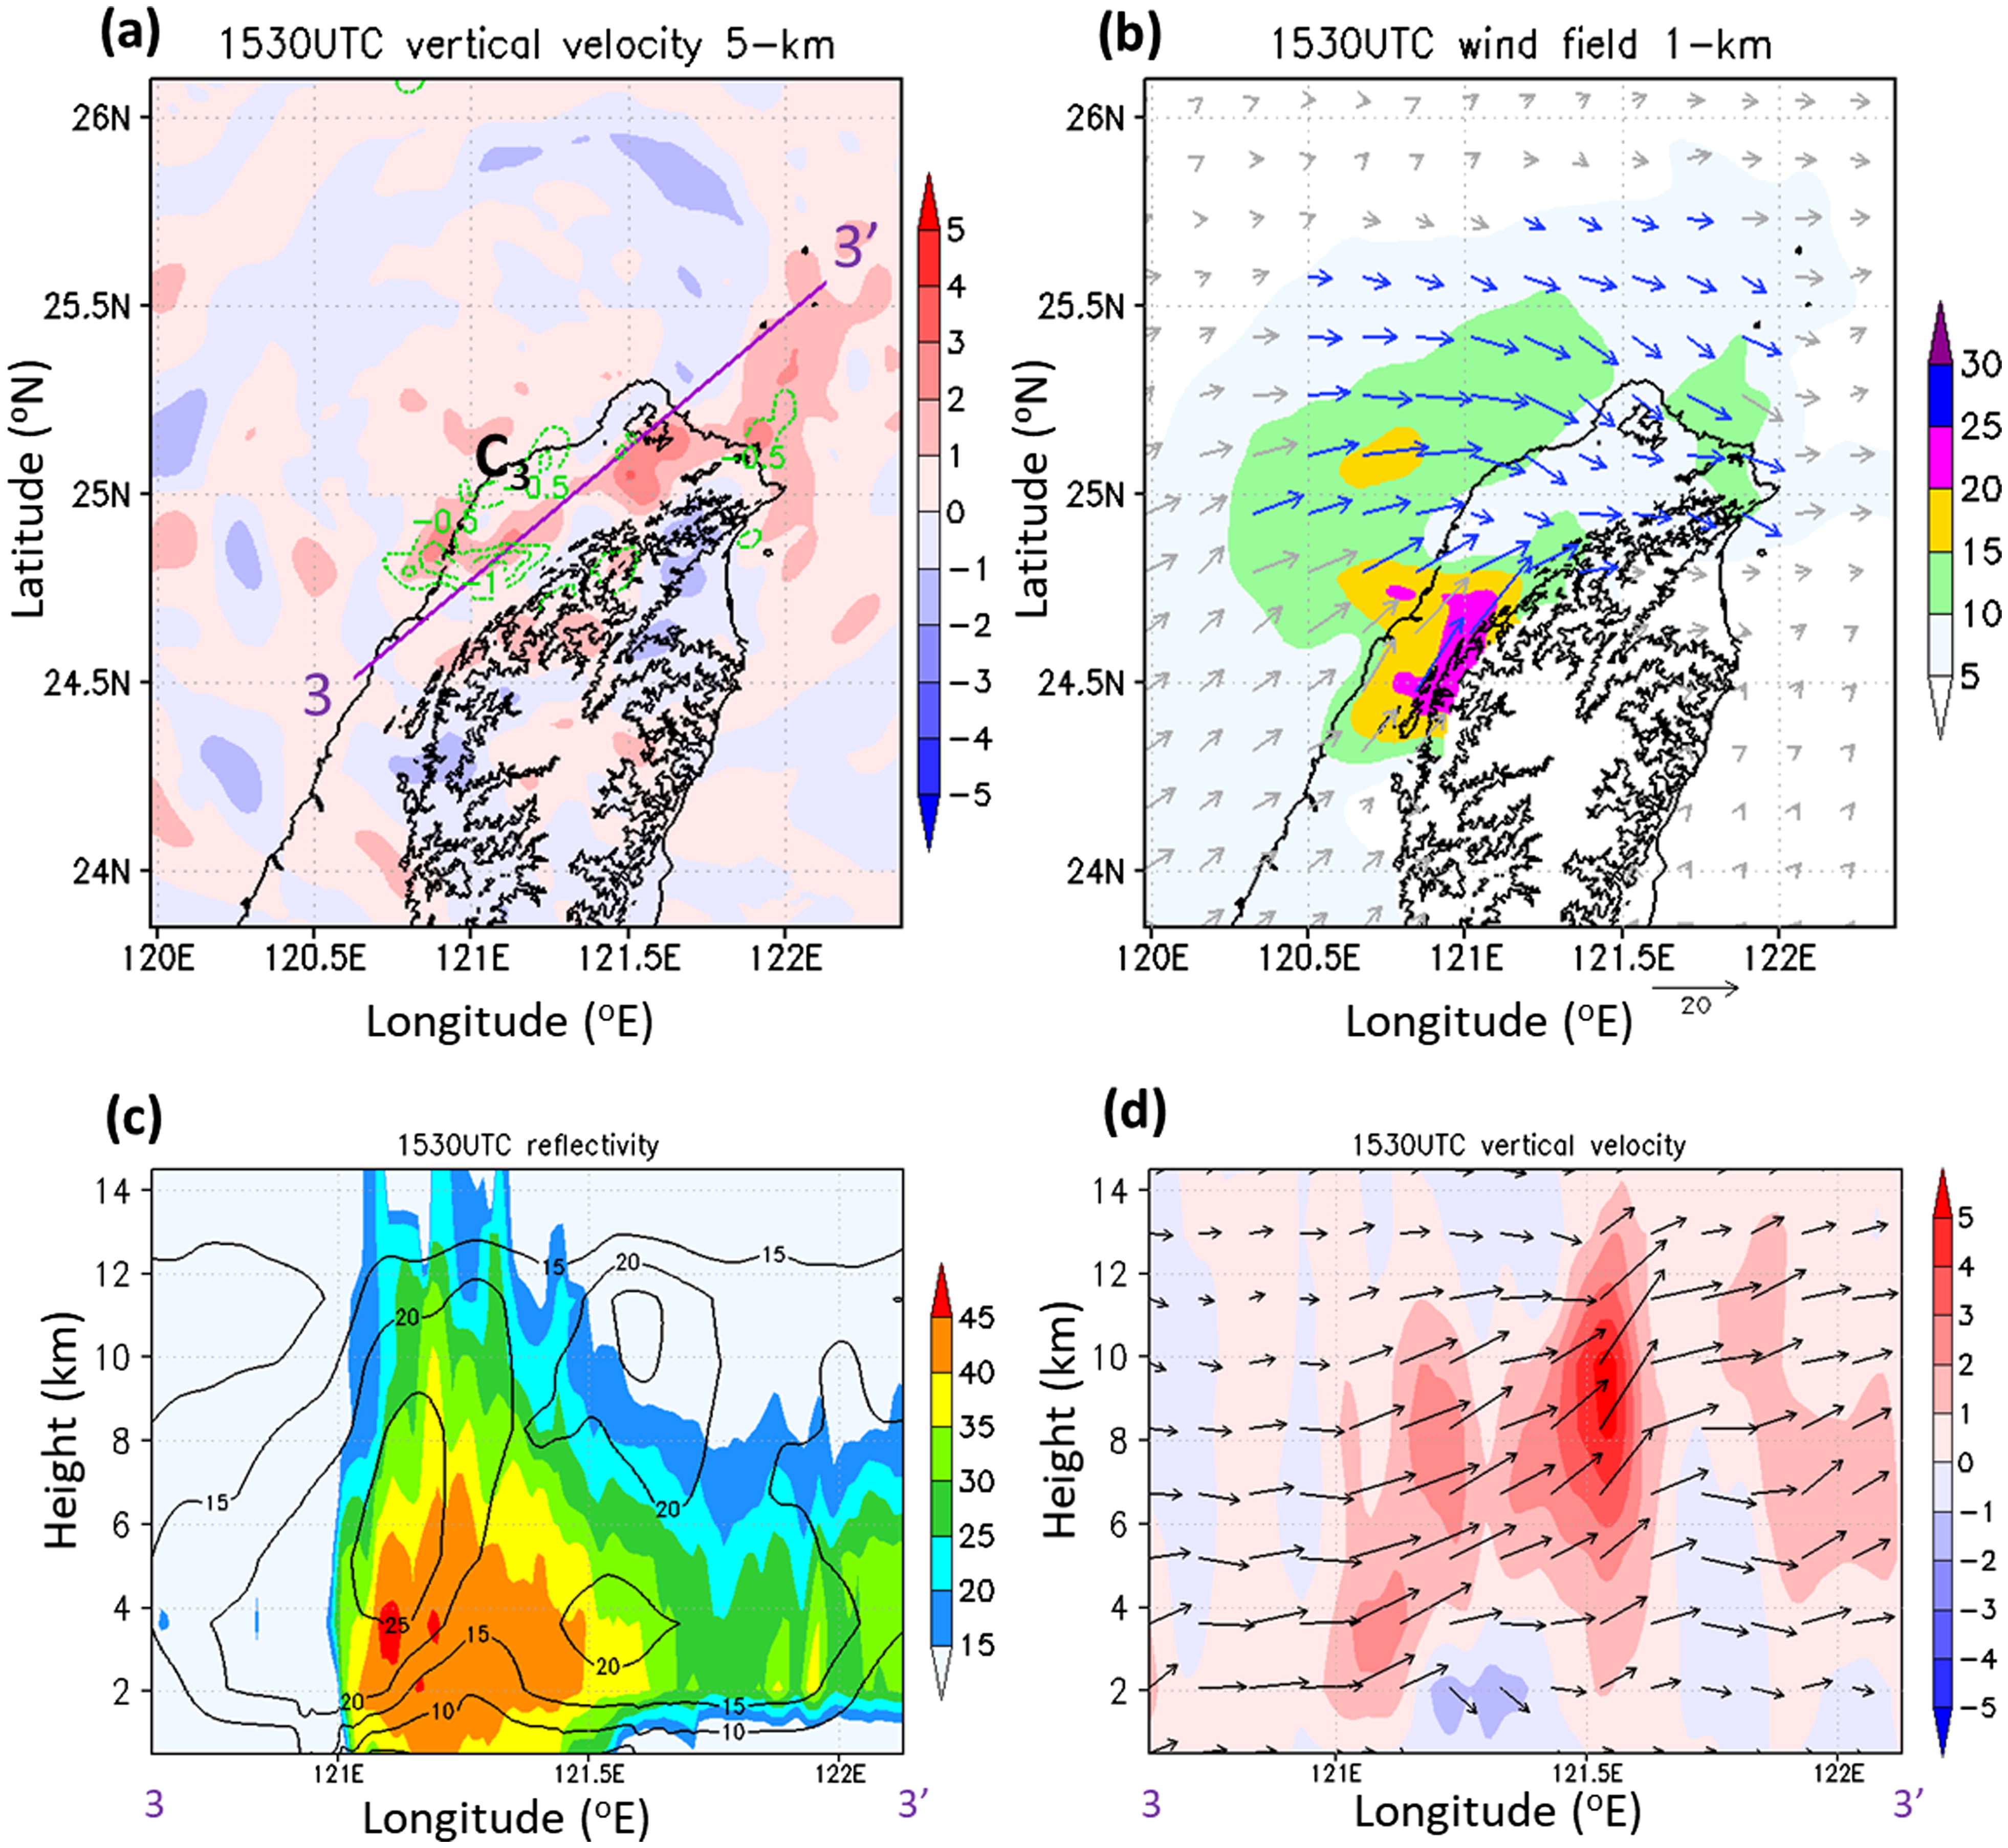
Fig. 13.
Same as Fig. 8 but at 1530 UTC 11 June 2012. The location of cross-section of (c) and (d) is in Fig. 13a.
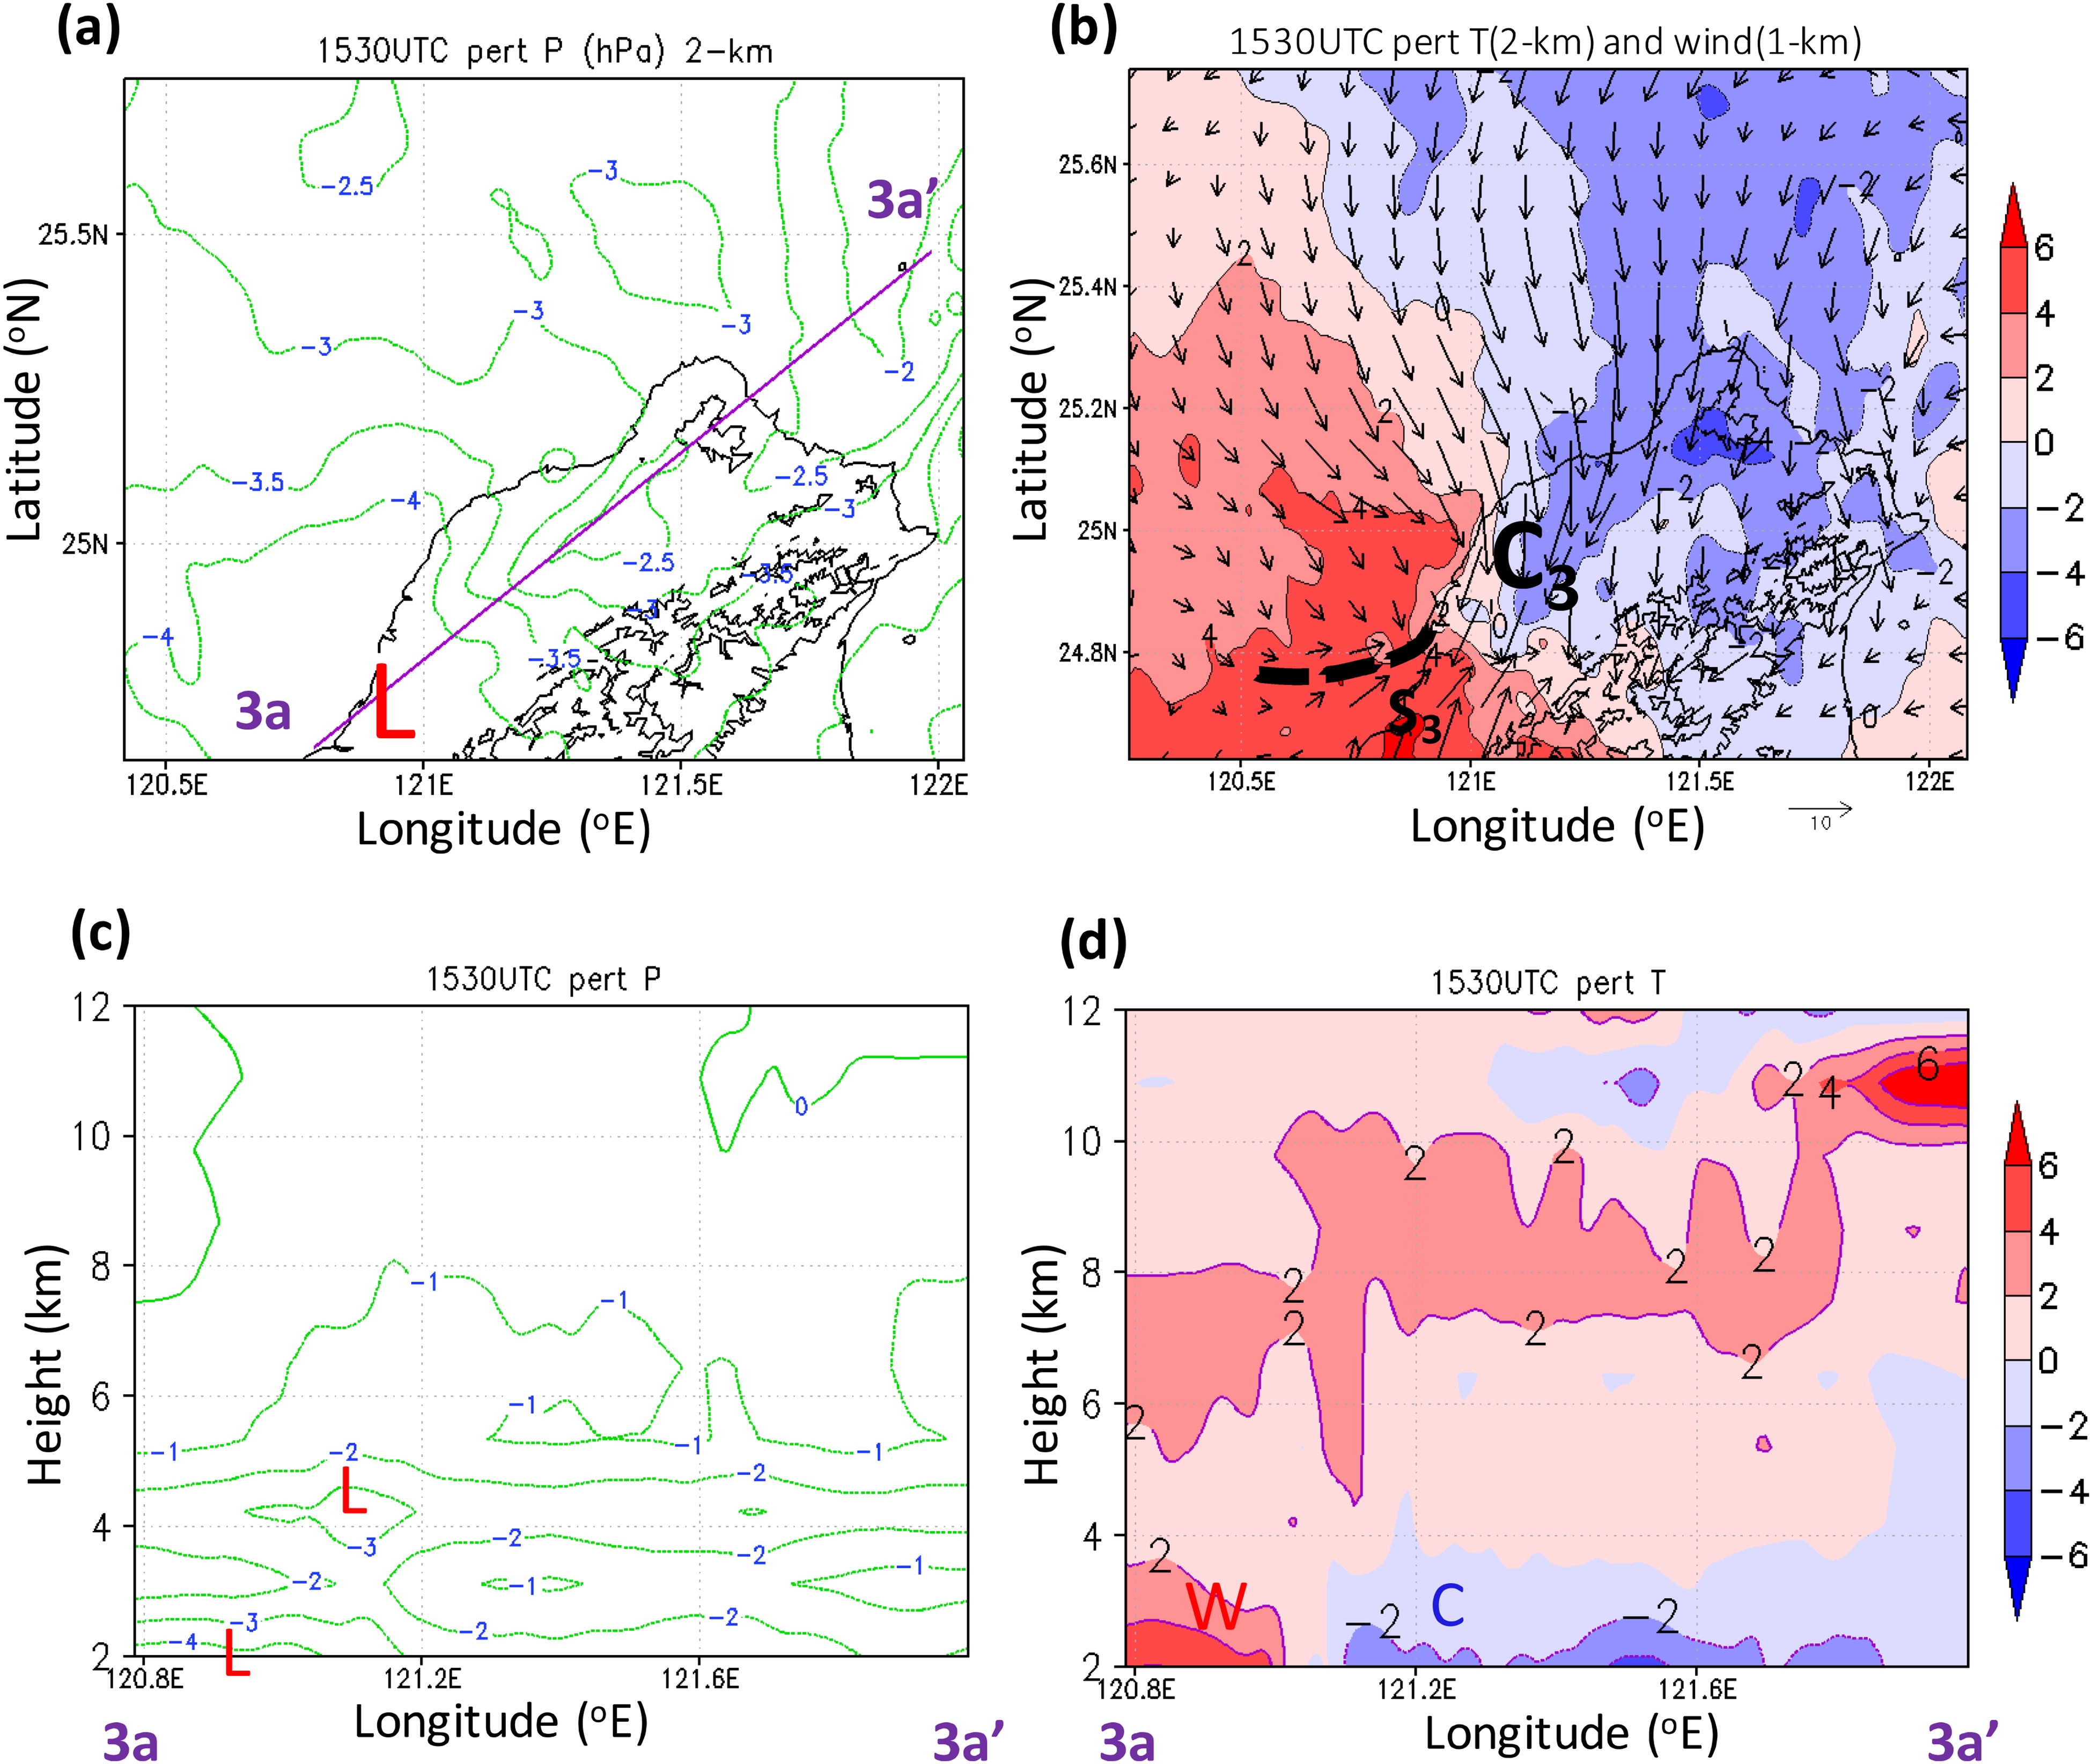
Fig. 14.
Same as Fig. 10 but at 1530 UTC 11 June 2012. The location of cross-section location of (c) and (d) is as in Fig. 14a. Horizontal wind vector in (b) is relative to southwesterly flow of Makung station and the dashed line indicates the location of cold outflow boundary at 1-km height.
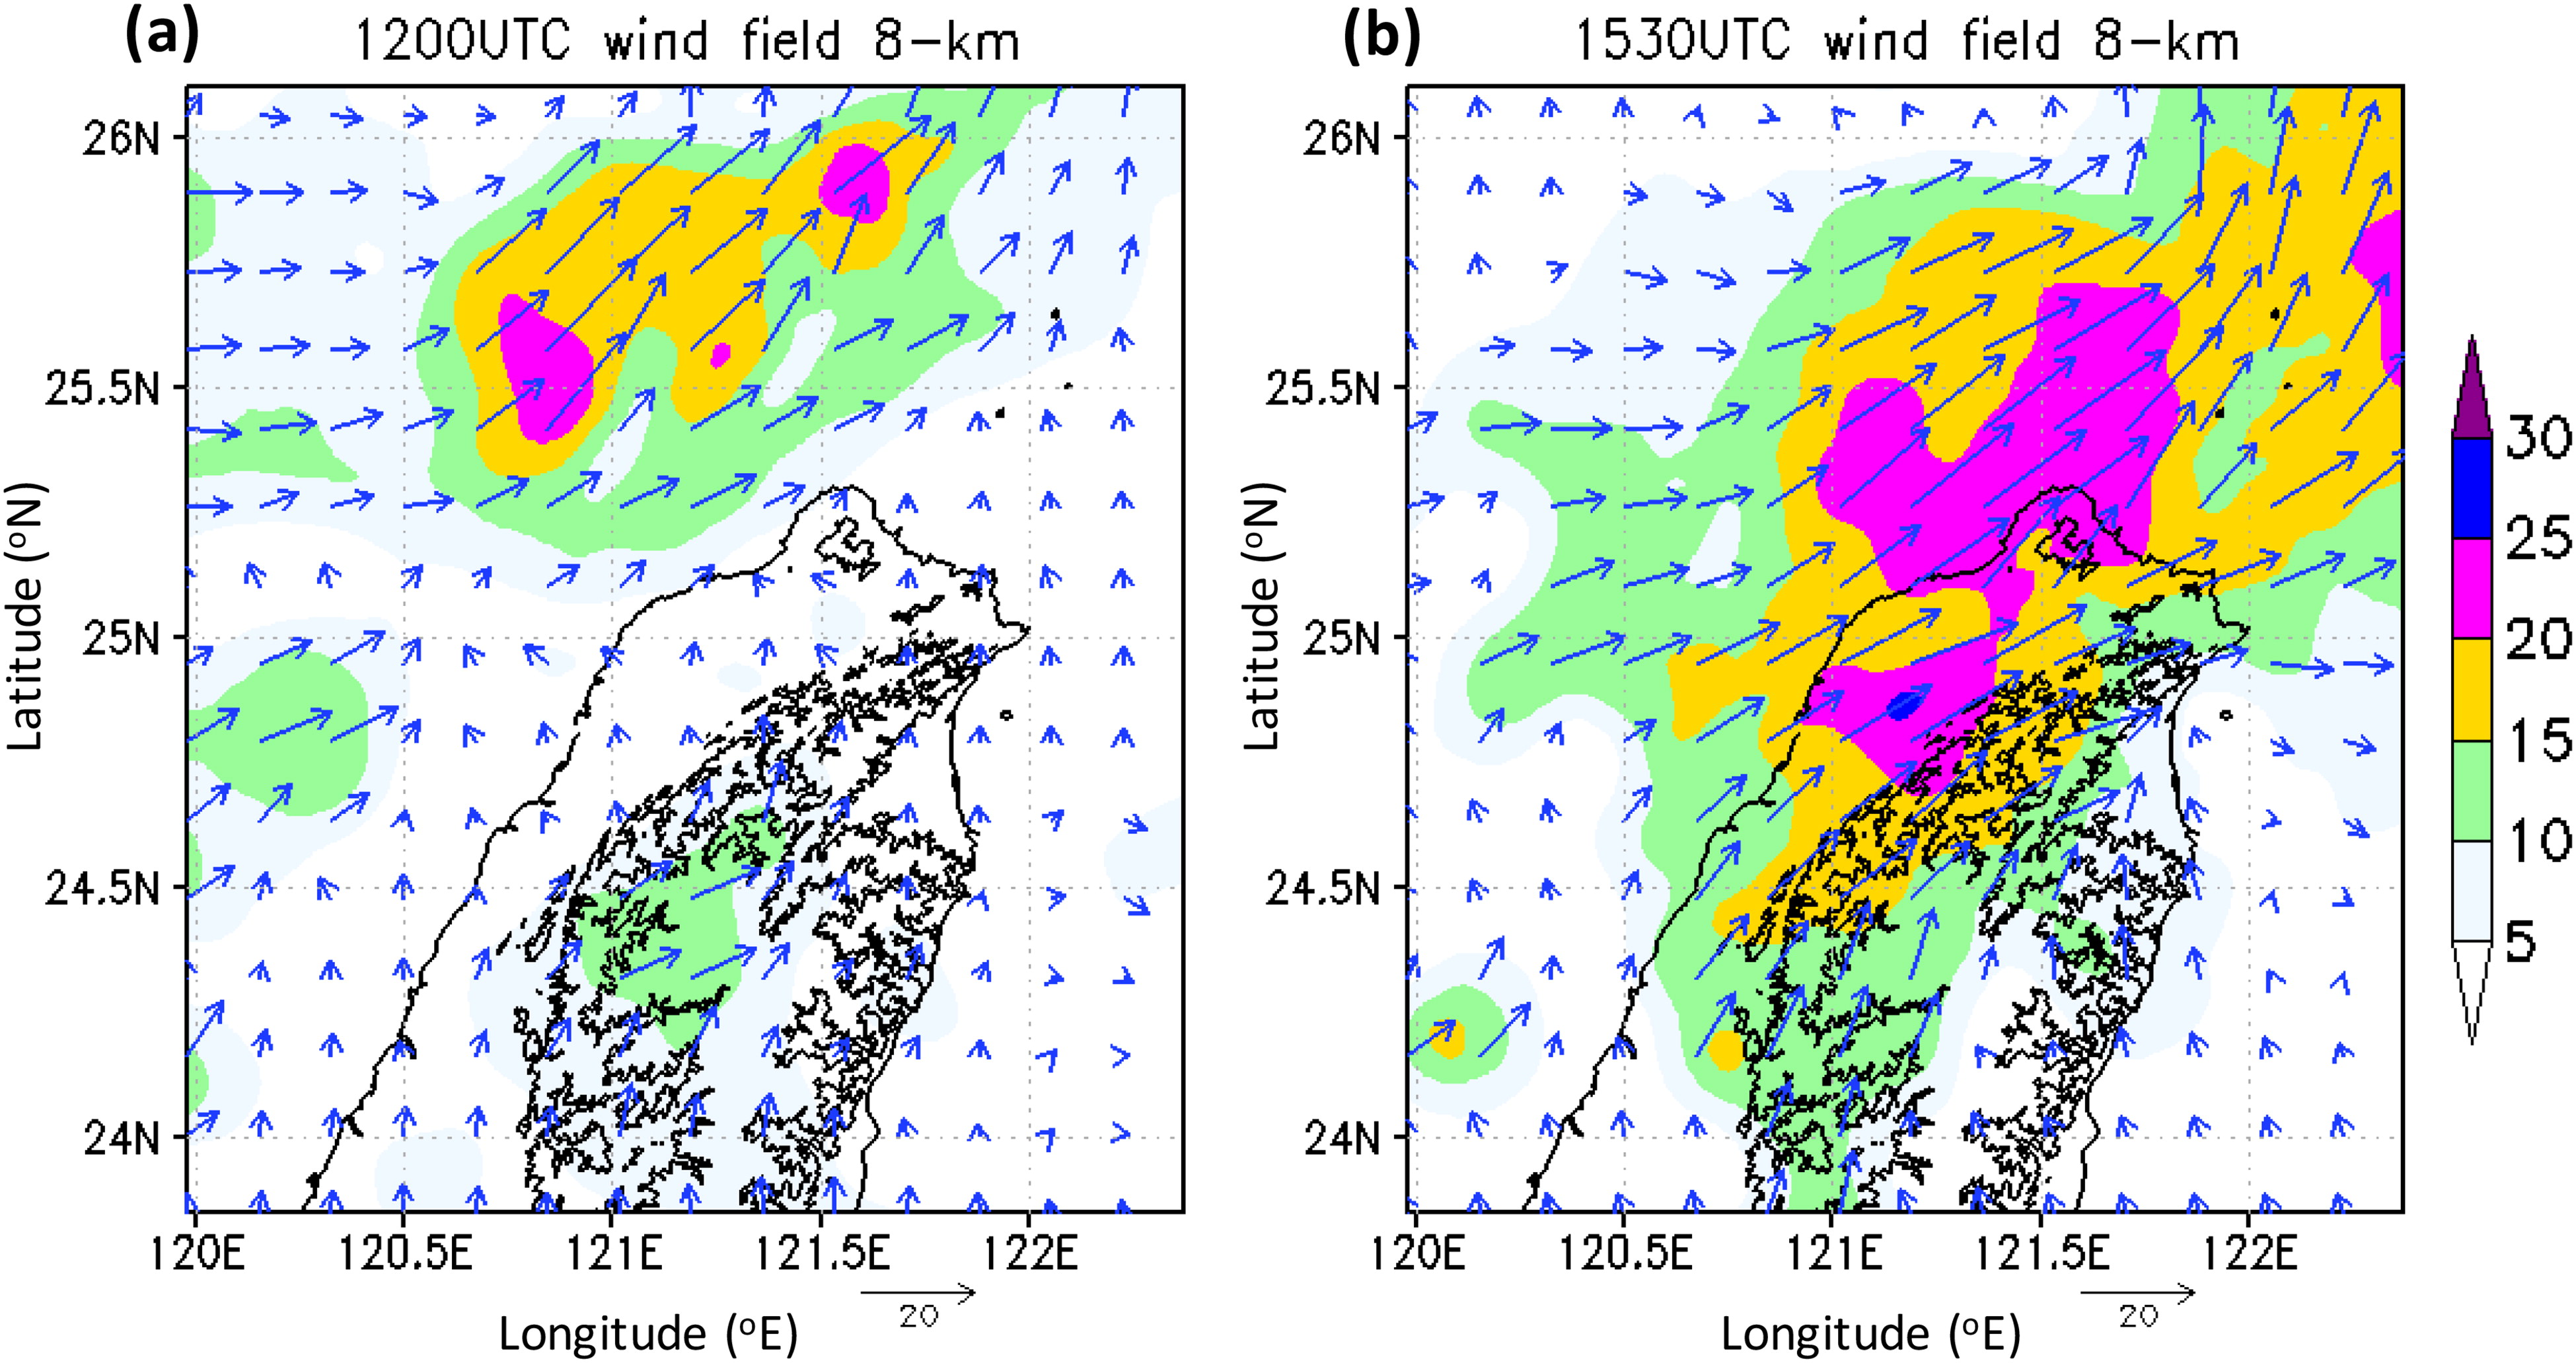
Fig. 15.
The horizontal wind direction relative to the system motion and the total horizontal wind speed at 8-km height: (a) at 1200 UTC, the system motion is 15 km hr−1 towards south-east; (b) at 1530 UTC, the system motion is ∼ 0 km hr−1 (quasi-stationary).
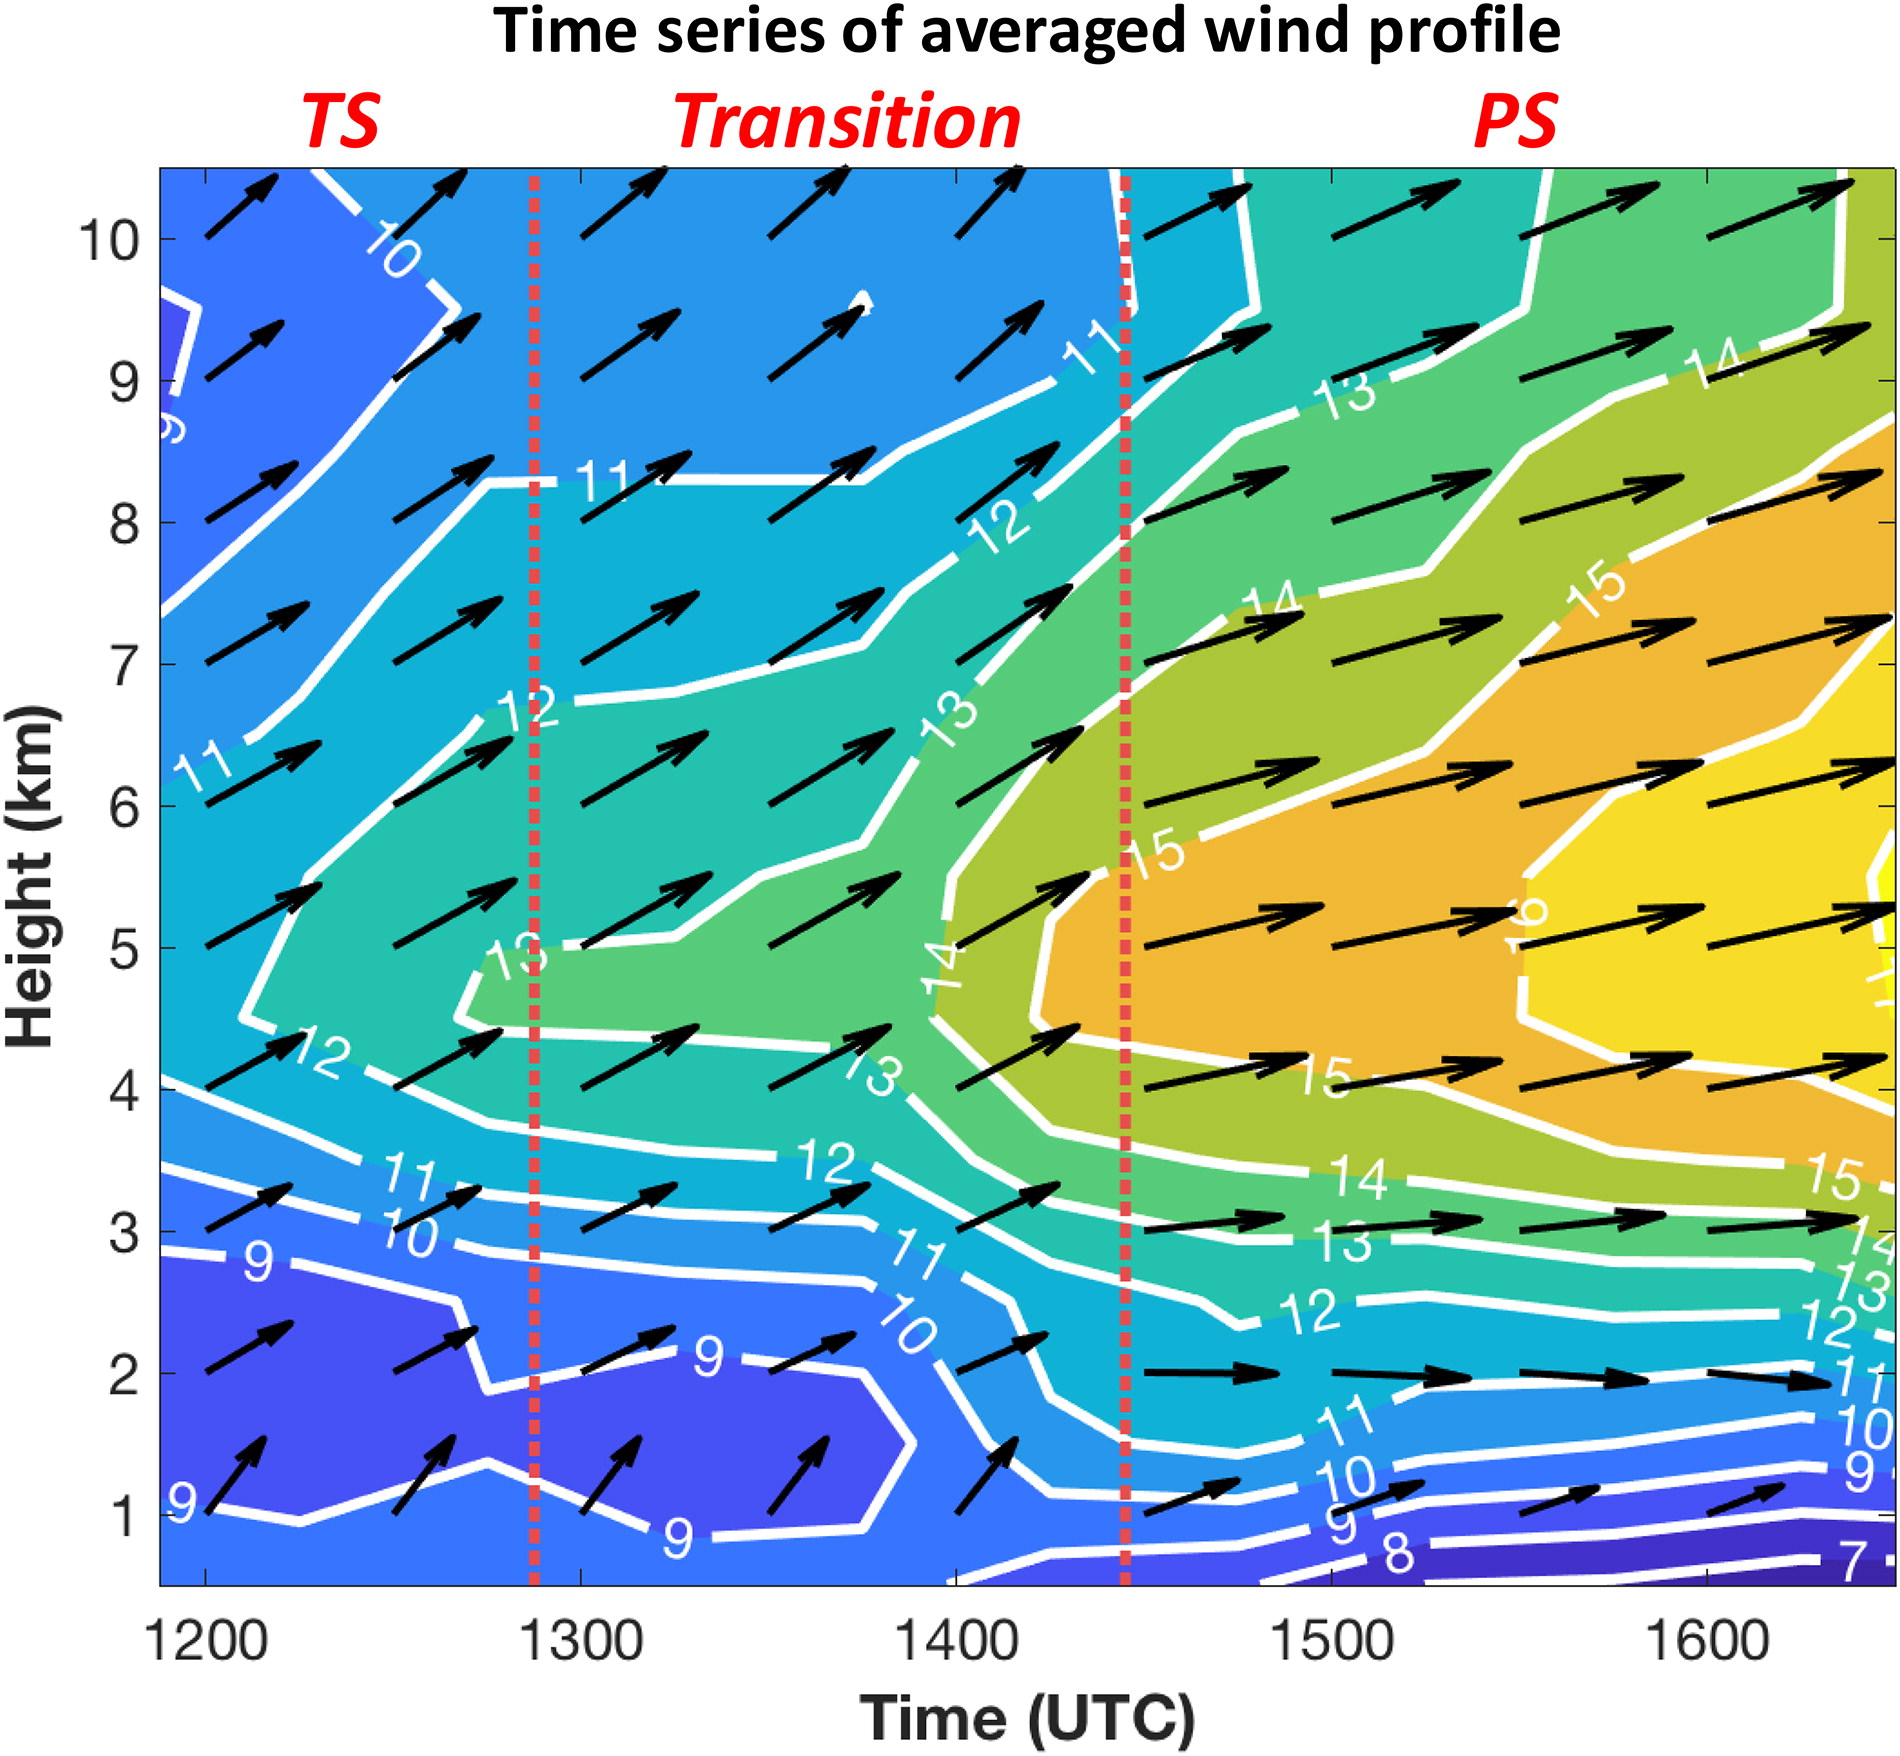
Fig. 16.
Retrieved wind profiles (averaged over precipitation area) from 1200 UTC to 1600 UTC. The speed (shaded and contour, unit: m s−1) and direction (vector) of the horizontal wind are relative to the system motion as indicated in Table 3. Red dashed line divides the precipitation types: PS, transition and PS.
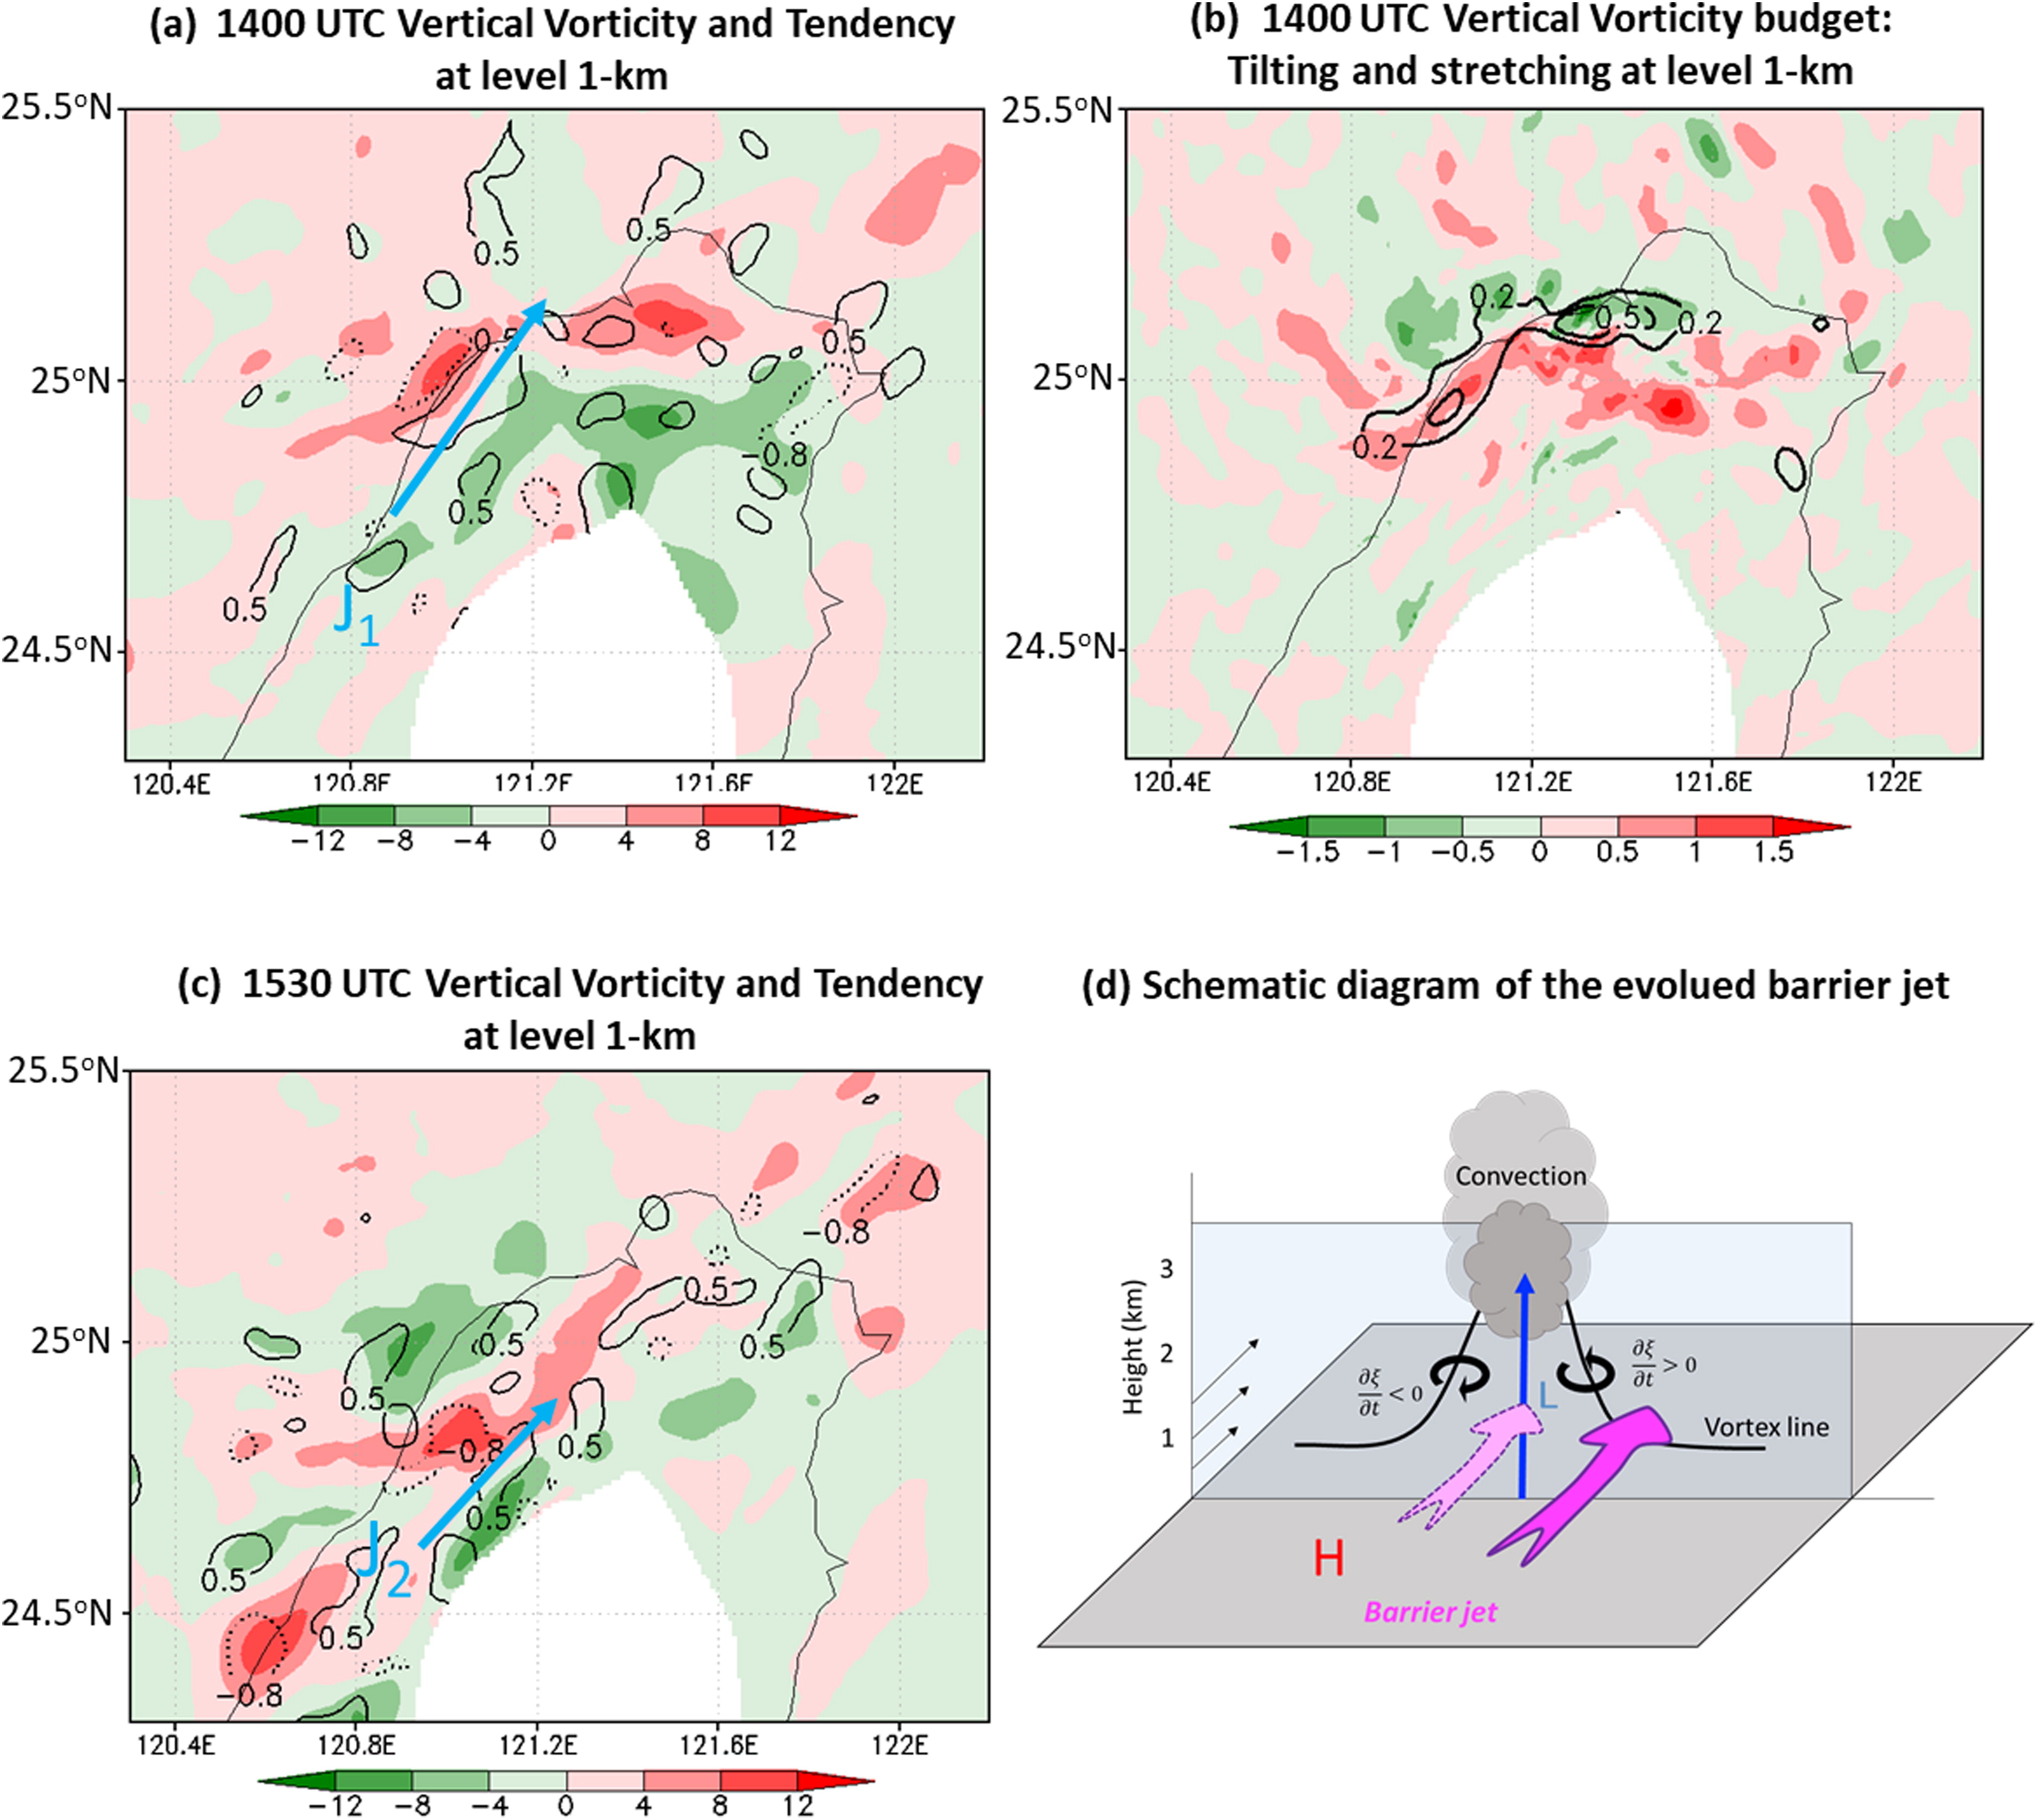
Fig. 17.
(a) Barrier jet (J1), the vertical vorticity fields (colour shaded, interval is 4*10−4 s−1) and vertical vorticity tendency (contour lines, 0.5 and −0.8*10−6 s−2) on 1-km level from WISSDOM at 1400 UTC; (b) Vertical vorticity budget of 1-km height at 1400 UTC: tilting term (colour shaded, interval is 0.5*10−6 s−1) and stretching term (contour lines, 0.2 and 0.5 *10−6 s−1); (c) same as (a), but at 1530 UTC and J2 indicates the location of the barrier jet; (d) schematic diagram to show the migration and enhancement of the barrier jet. Thinned arrows present the strength of the wind below 3-km height, vortex line is stretched by the upward motion (blue arrow) and induced a pair of vorticity tendency, pink arrows with dashed line is the original barrier jet and solid line is the evolved barrier jet; H and L refer to the location of high and low pressure, respectively.
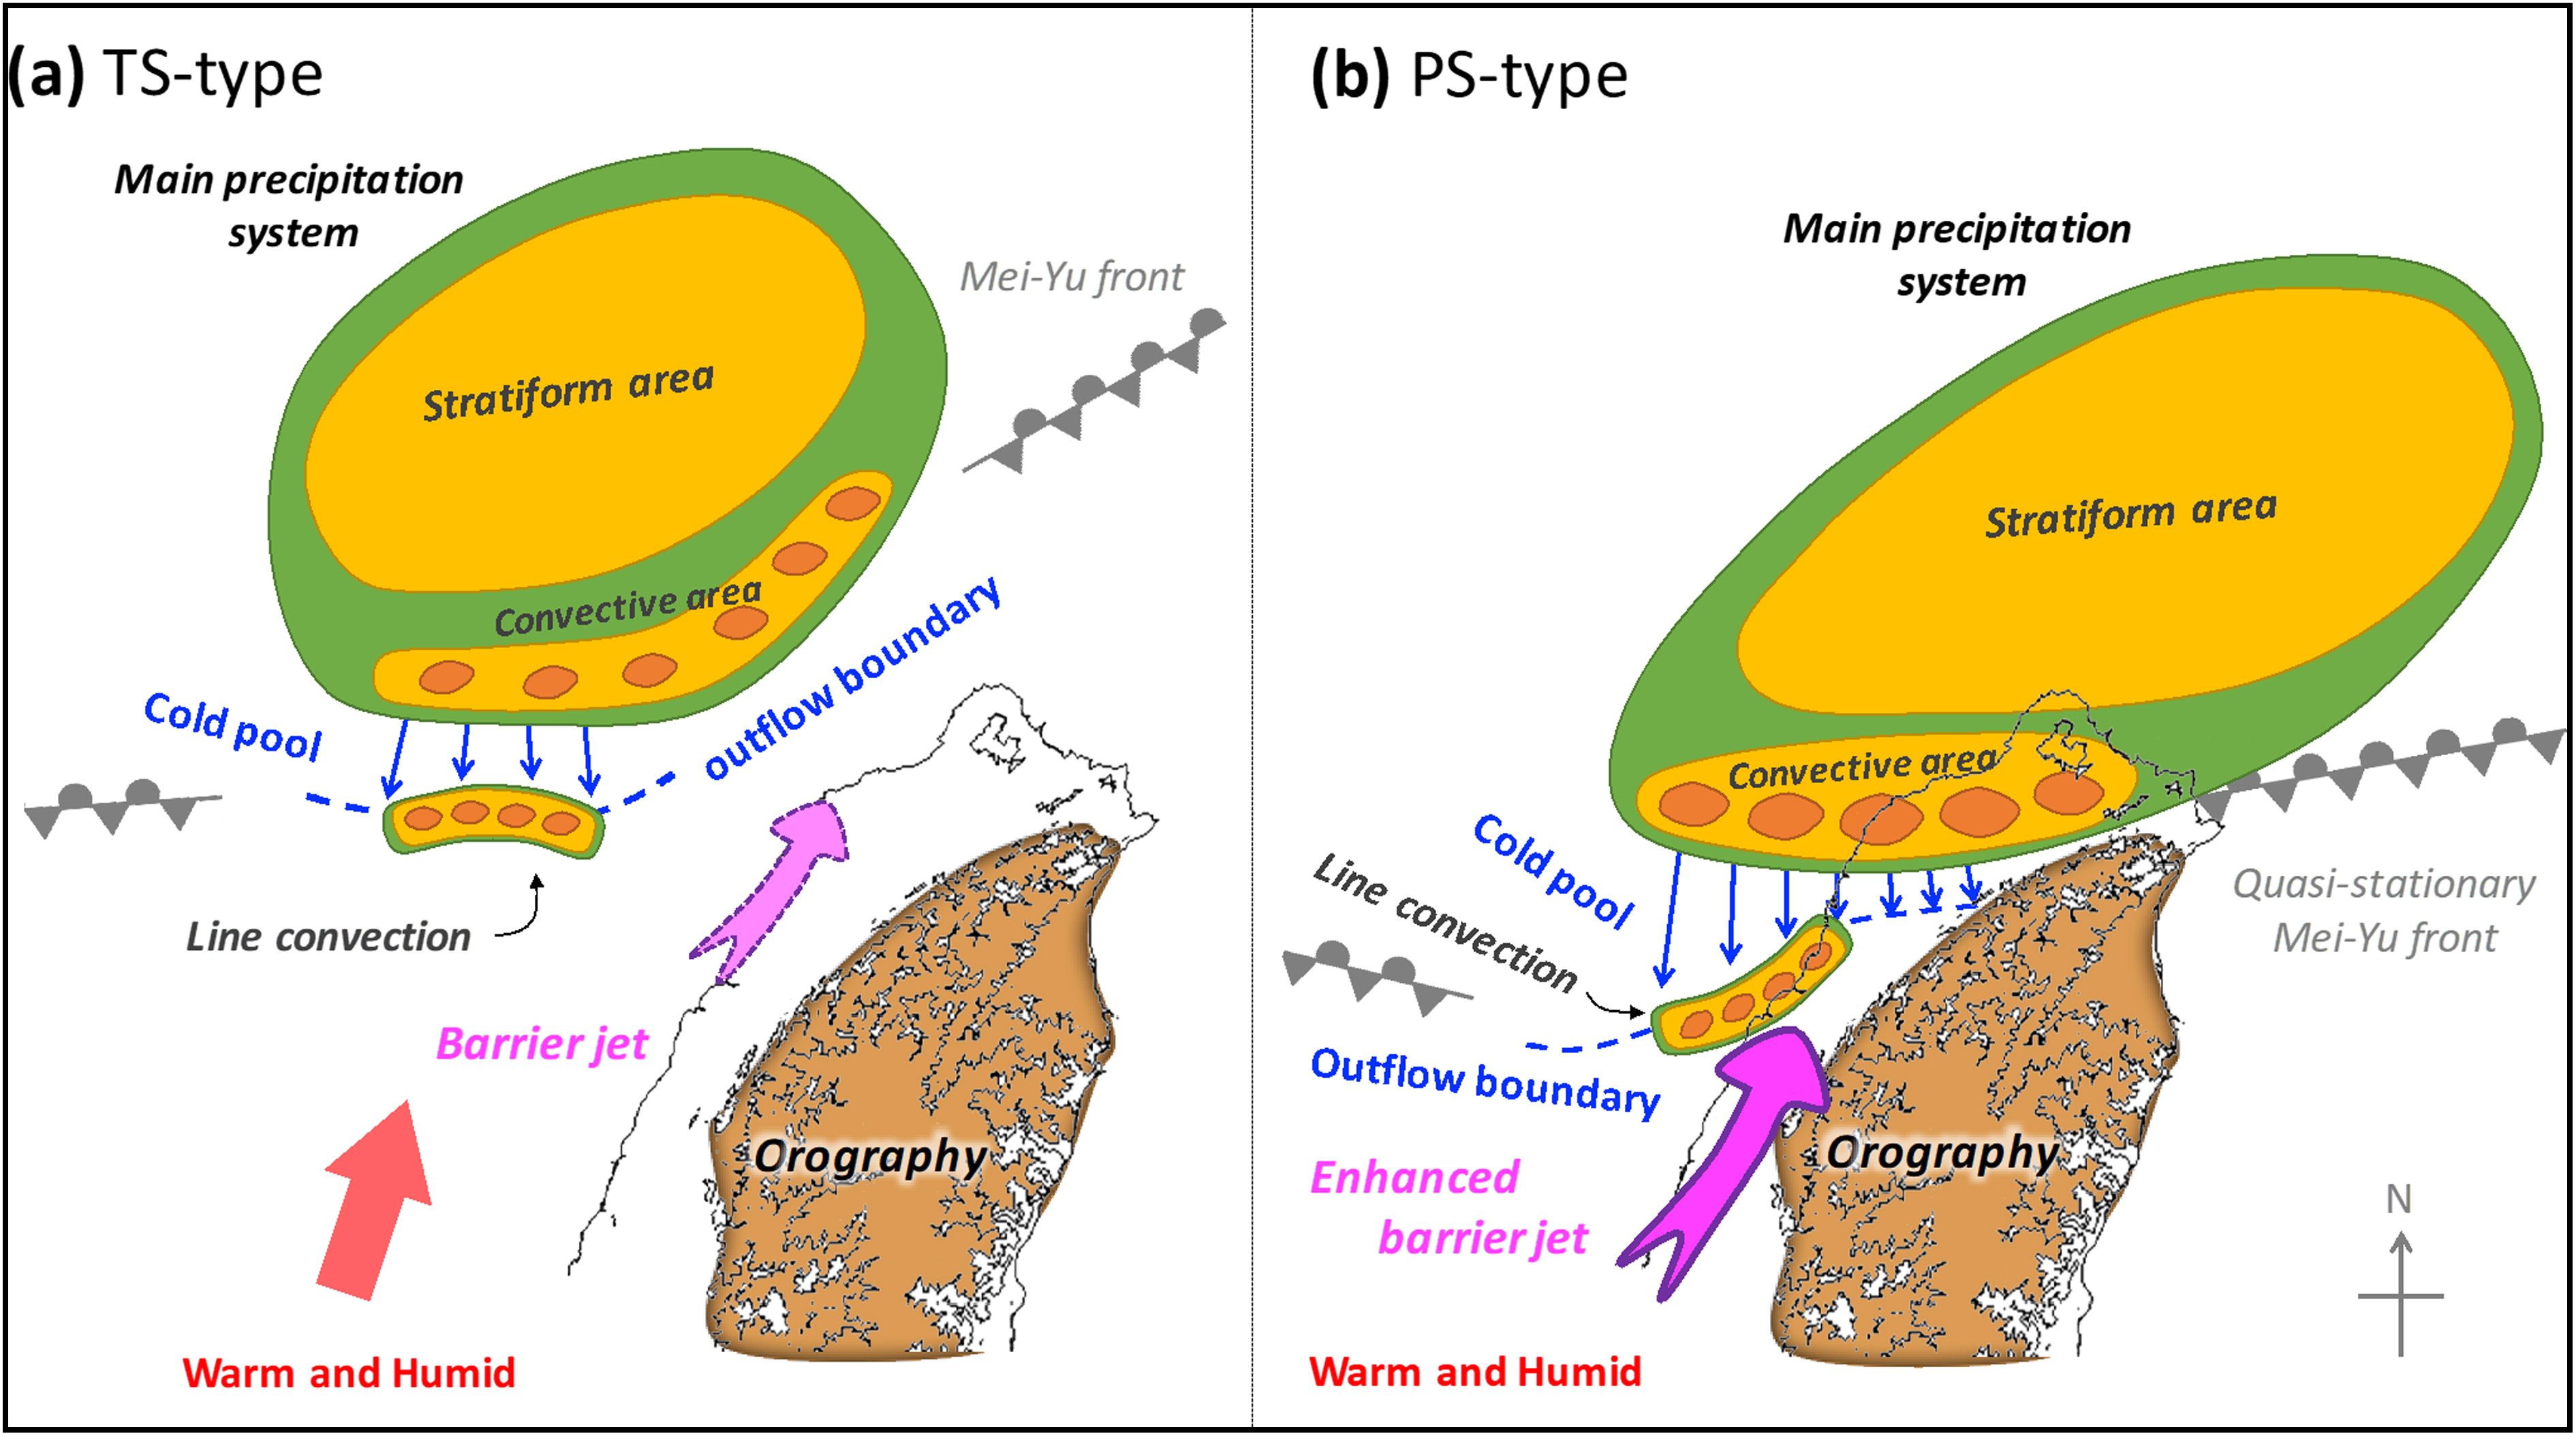
Fig. 18.
Schematic diagrams to demonstrate the mechanism of the extremely heavy rainfall event. (a) Pre-frontal convection forms a TS-type precipitation over the ocean, and the line convection is triggered due the cold outflow encountering a warm and humid southwesterly flow; (b) the strengthened cold pool and enhanced barrier jet repeatedly triggered the Y-shaped echo line convection, then merge with the main convection to form a PS-type precipitation over northern Taiwan. The location of the Mei-Yu front and the warm/humid southwesterly flow (red arrow) illustrate the environmental condition of the synoptic scale over Taiwan. The location of the cold pool and the orography in northern Taiwan blocks the displacement of the main convection.