

Fig. 1.
Schematic representation of the formation of the Mediterranean overflow water (MOW). The wind stress in the vicinity of the Gulf of Cadiz and the net evaporation (E–P–R) in the Mediterranean basin play an important role in the MOW formation. The volume transport and the mean salinity of the inflow are described by Q in and S 1, respectively, whereas the outflow is characterised by Q out and S 2.
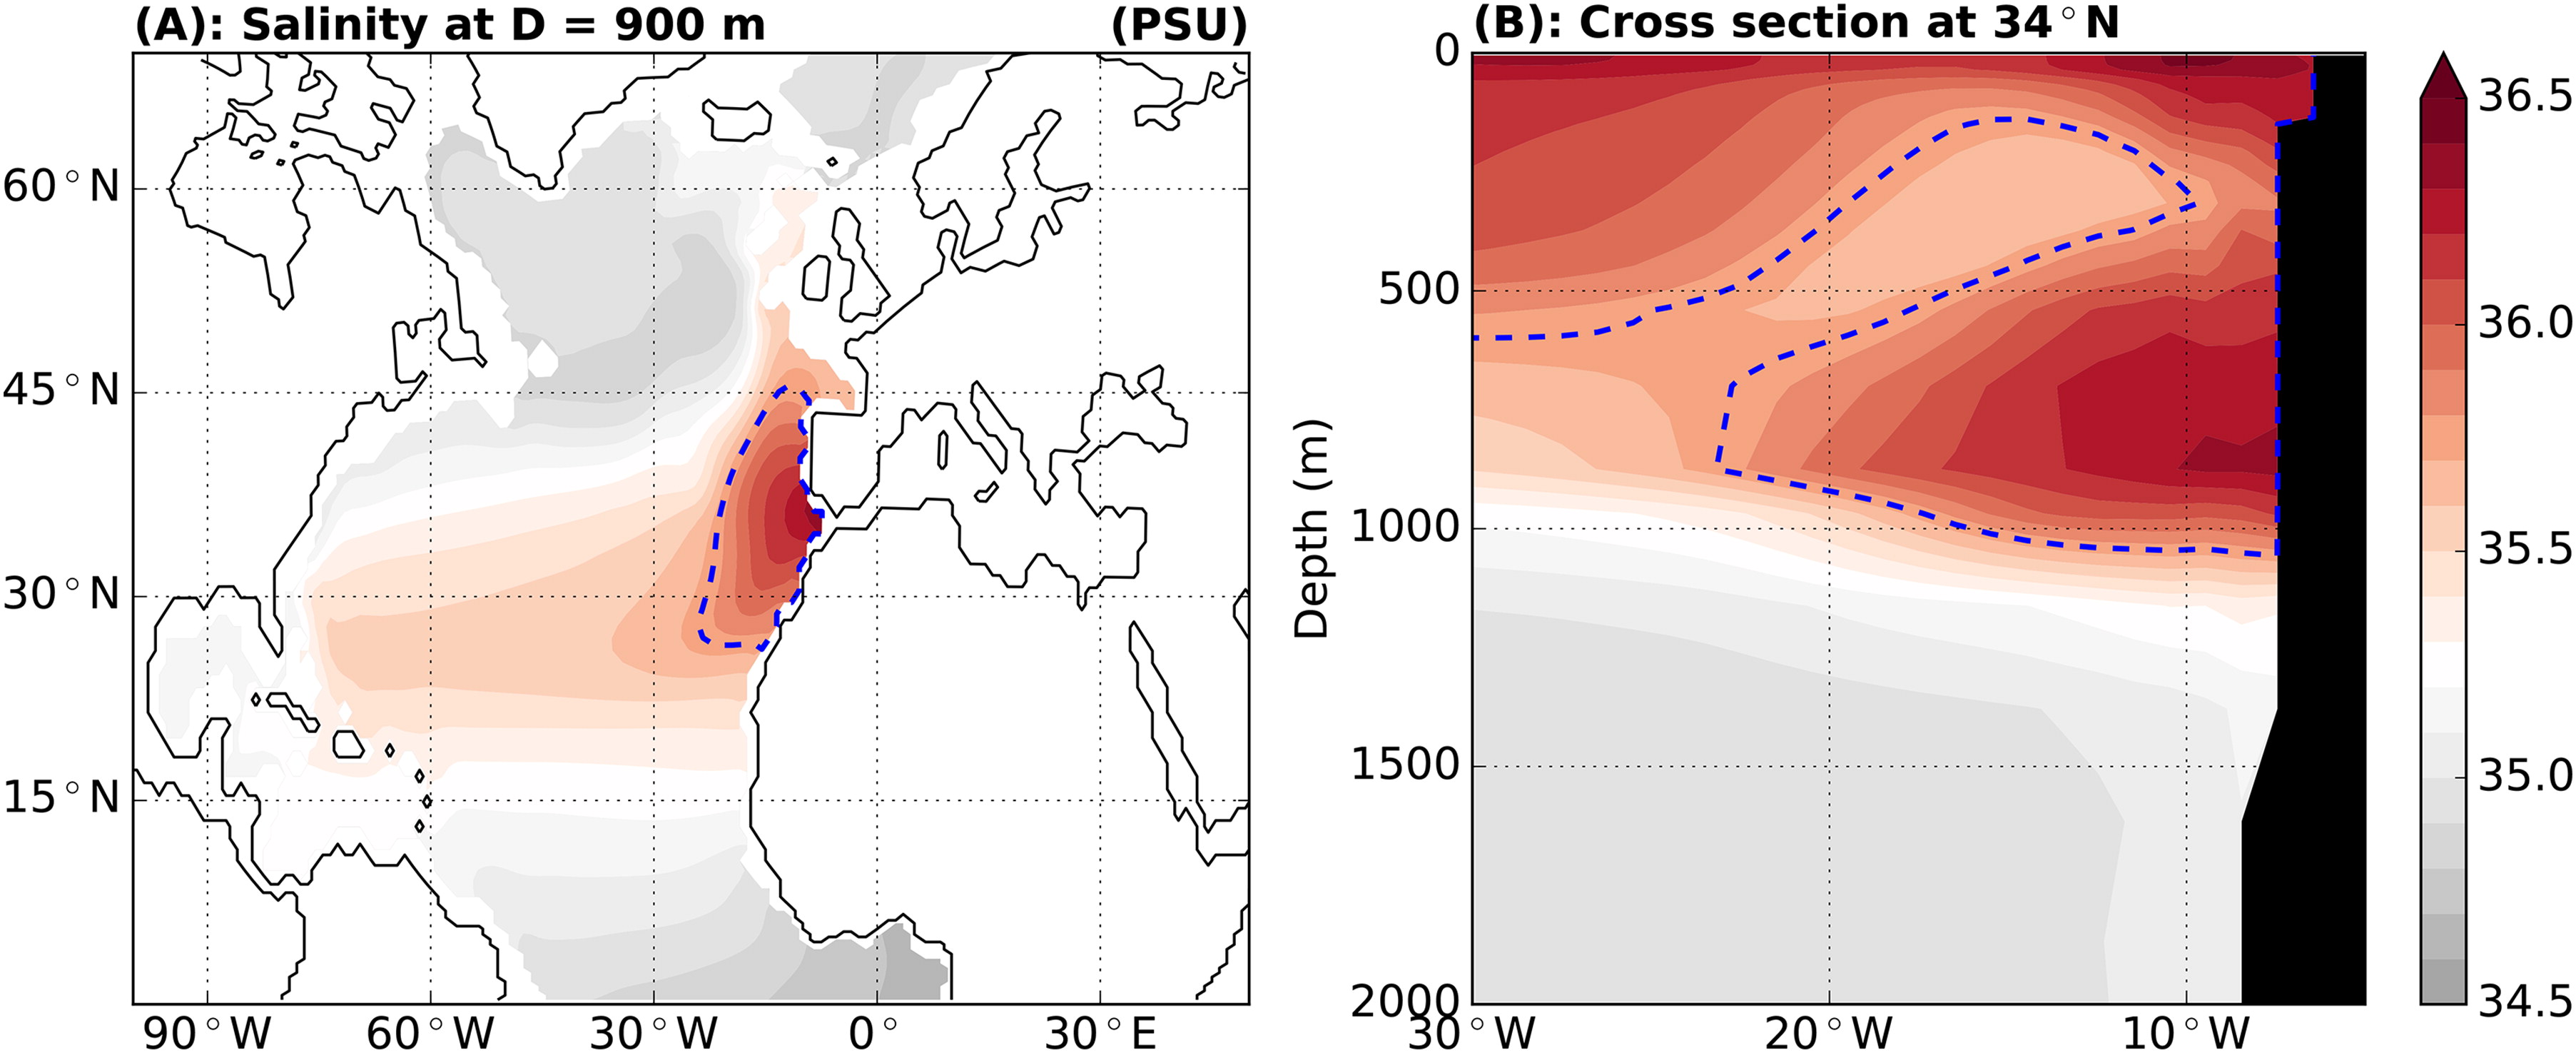
Fig. 2.
(A) The mean salinity field at a depth of 900 m. The interval between 2 contour lines is 0.1 PSU. (B) Cross section at 34°N showing the saline tongue spreading away from the continental shelf. The core of the MOW is located at around 900 m deep where the average salinity is about 36.3 PSU. The blue dashed contour lines represent the 35.75 PSU isohaline.
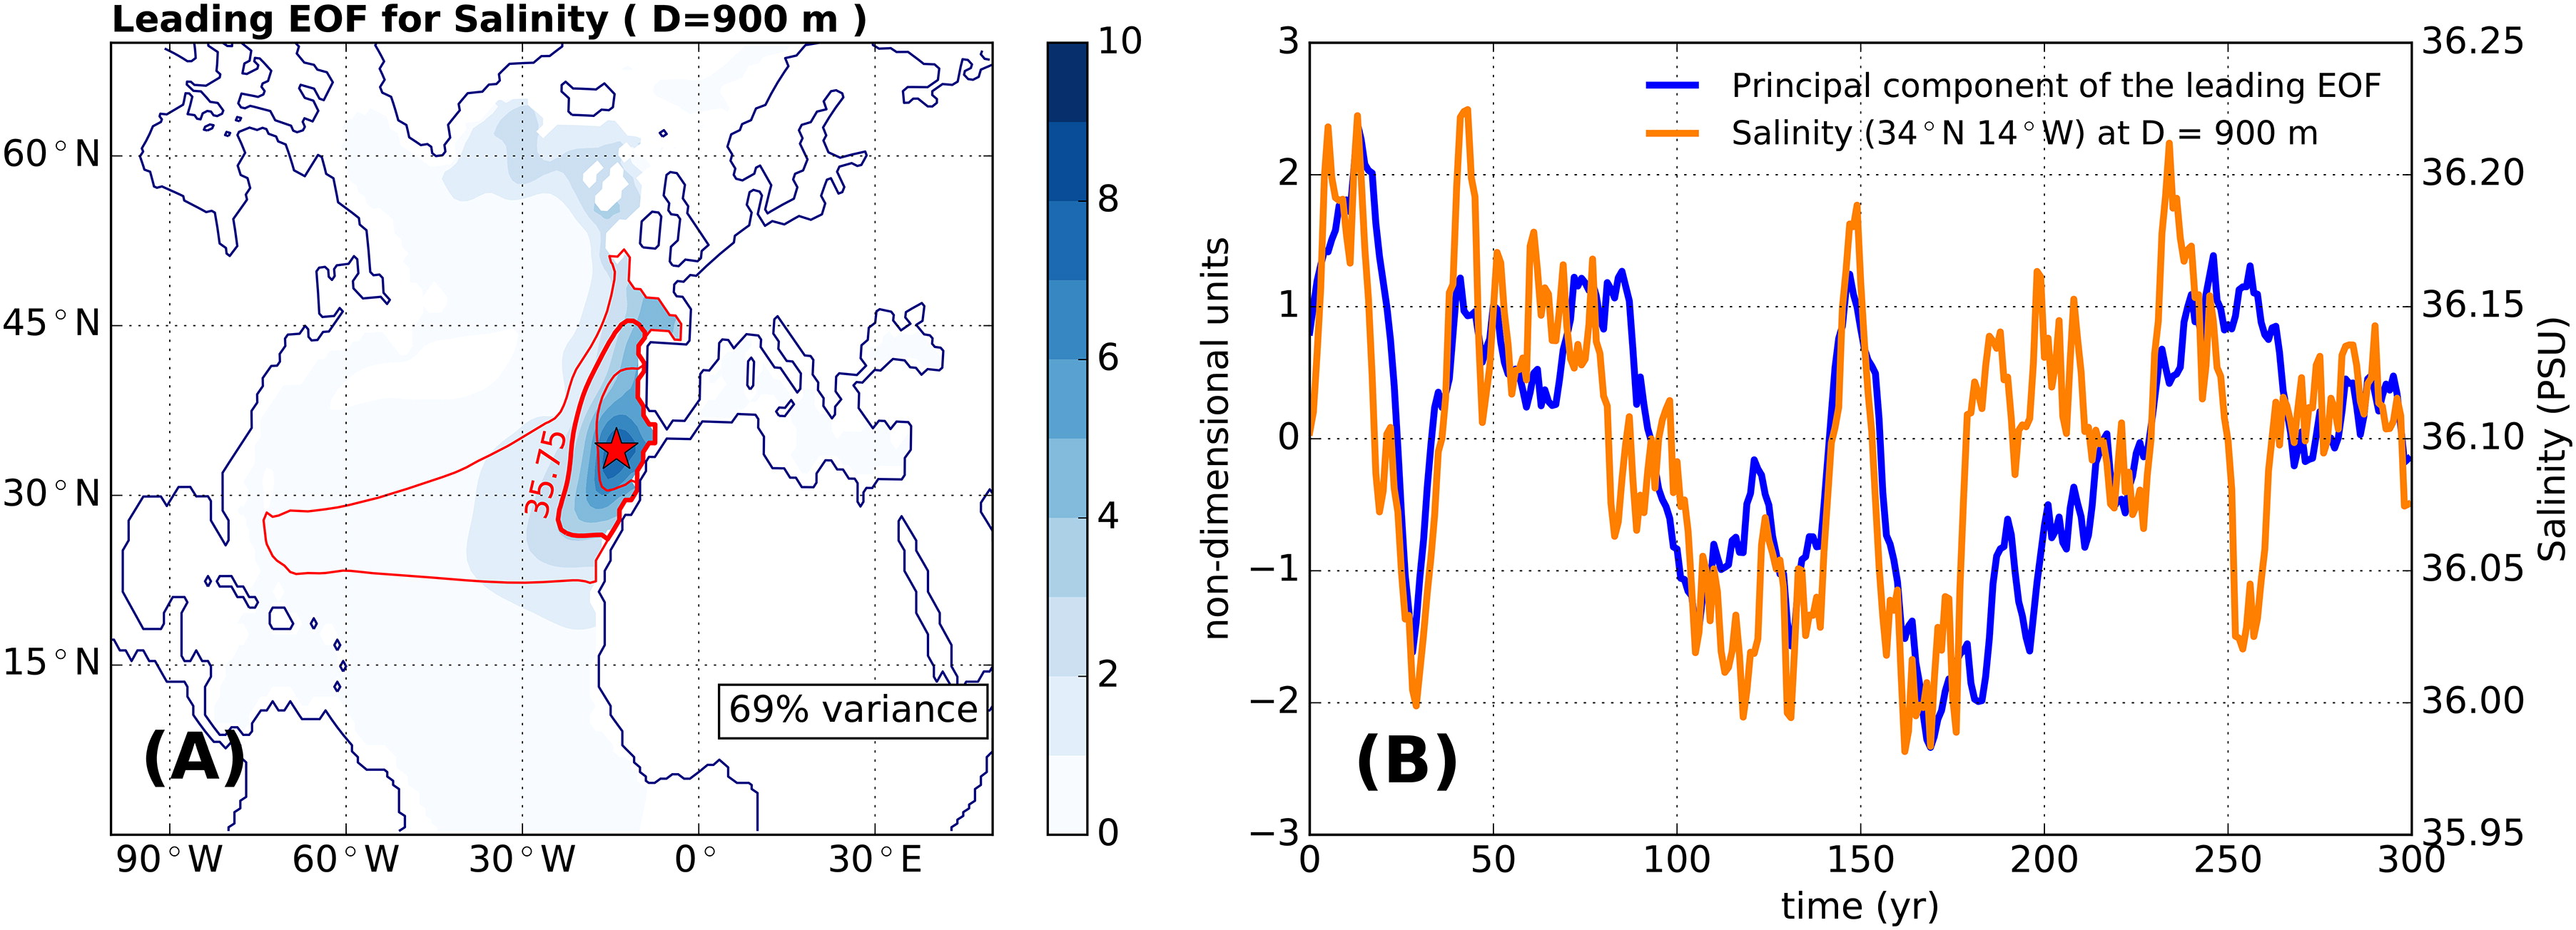
Fig. 3.
EOF analysis of the salinity field at a depth of 900 m. (A) The spatial pattern of the leading EOF explains 69% of the variability in the selected region (N. Atlantic + Mediterranean Sea). The highest variability is confined to the high salinity area in the eastern North Atlantic, especially in the vicinity of the Gulf of Cadiz. The red contours represent the isohalines for 35.5, 35.75 and 36 PSU. (B) The corresponding time series to the leading EOF (blue line) is compared to the salinity evolution at 34°N 14°W at the same depth (orange line). This particular location is given by the red star in the map.
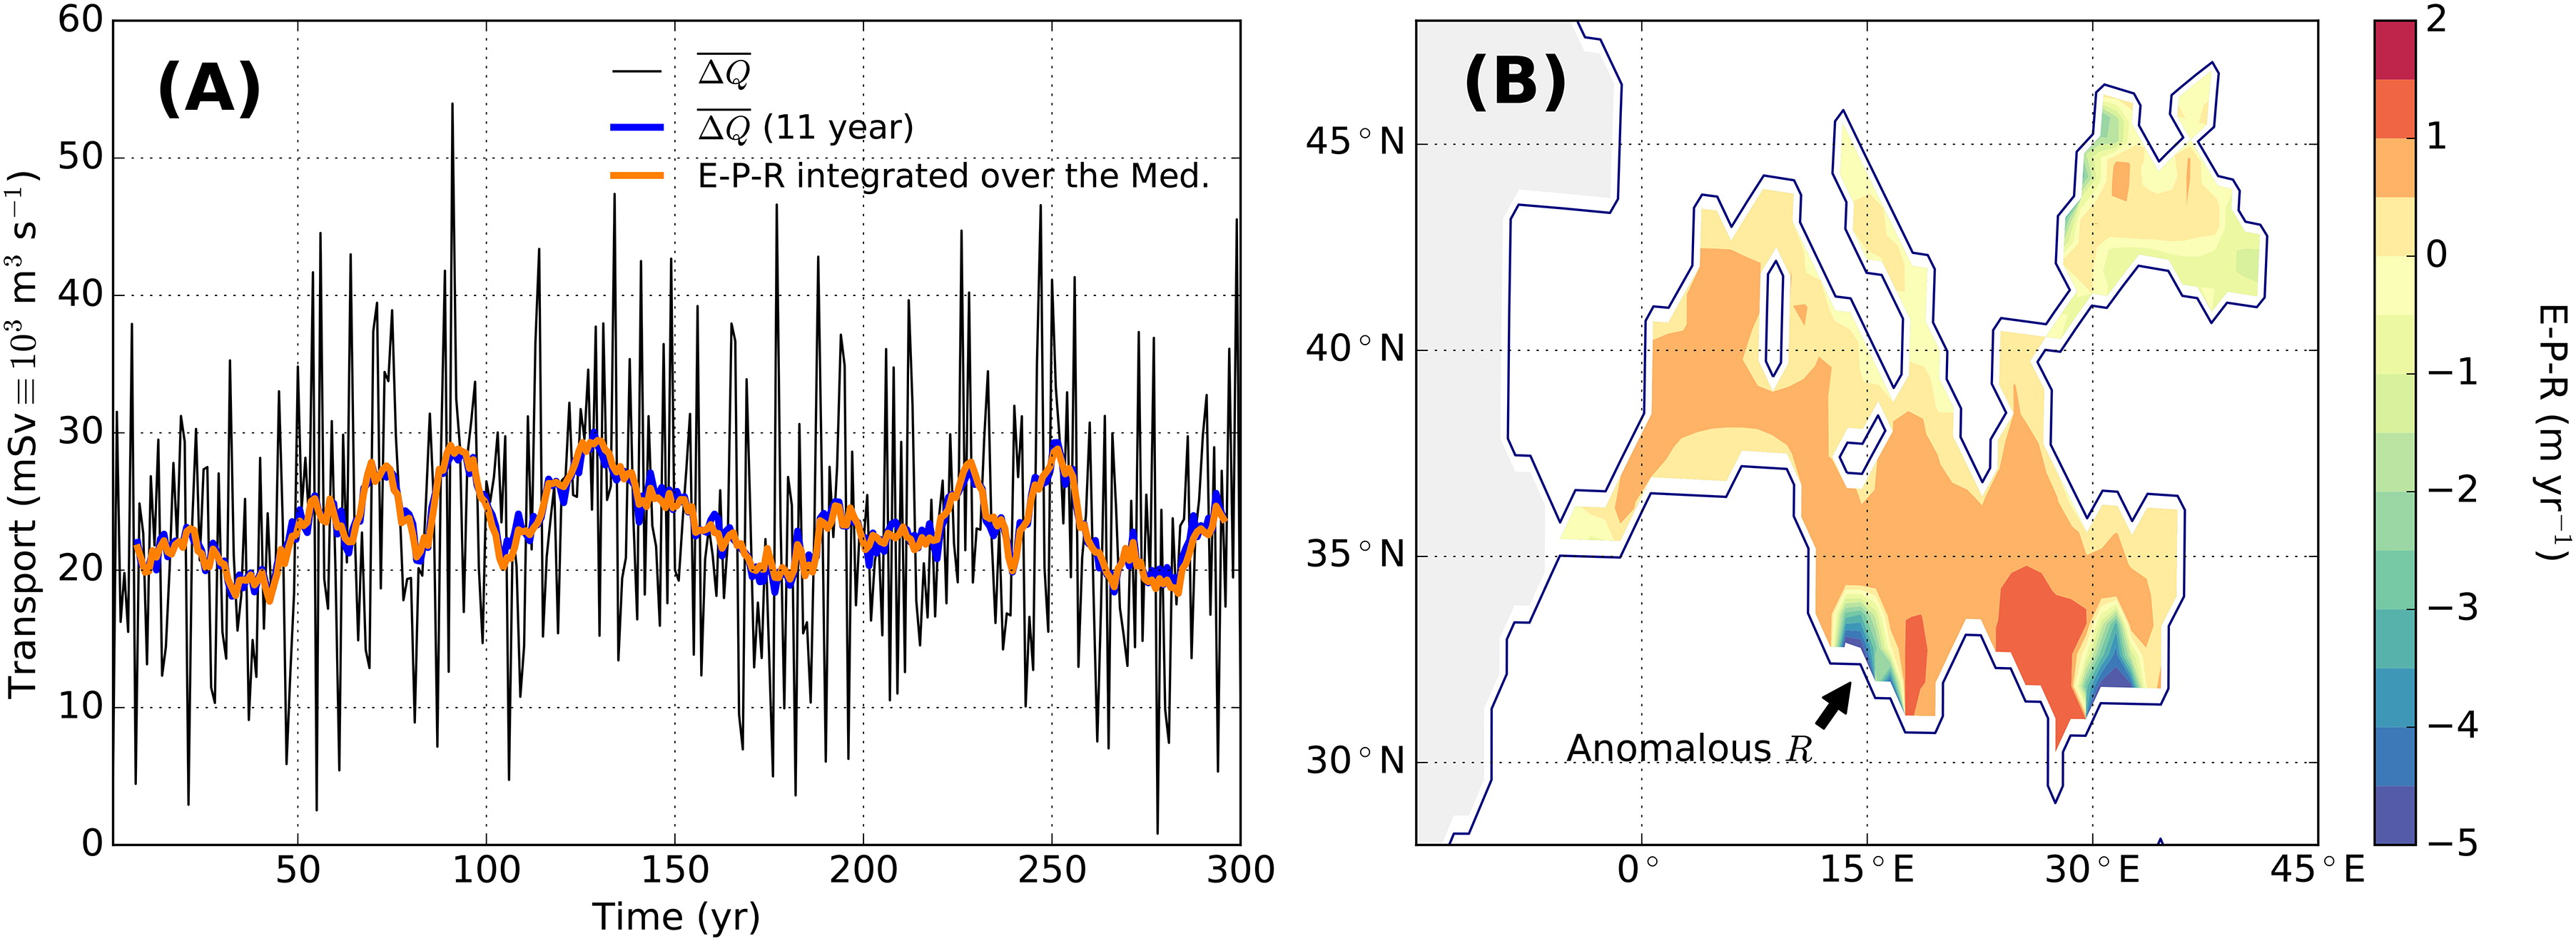
Fig. 4.
(A) The net volume transport, , through the Strait of Gibraltar (blue line) defined in Equation (1) and the net evaporation, E–P–R, integrated over the Mediterranean basin. The time series have been smoothed with a 10-year running mean filter. The grey solid line represents the yearly mean time series for the net flow. (B) Climatology of the net evaporation over the schematic representation of the Mediterranean region.

Fig. 5.
The total salt transport through the Strait of Gibraltar from the EC-Earth pre-industrial run (solid grey line). The black solid line represents the 10-year running average. The red (blue) shaded areas represent years where the Mediterranean Sea imports (exports) salt from (to) the Atlantic.
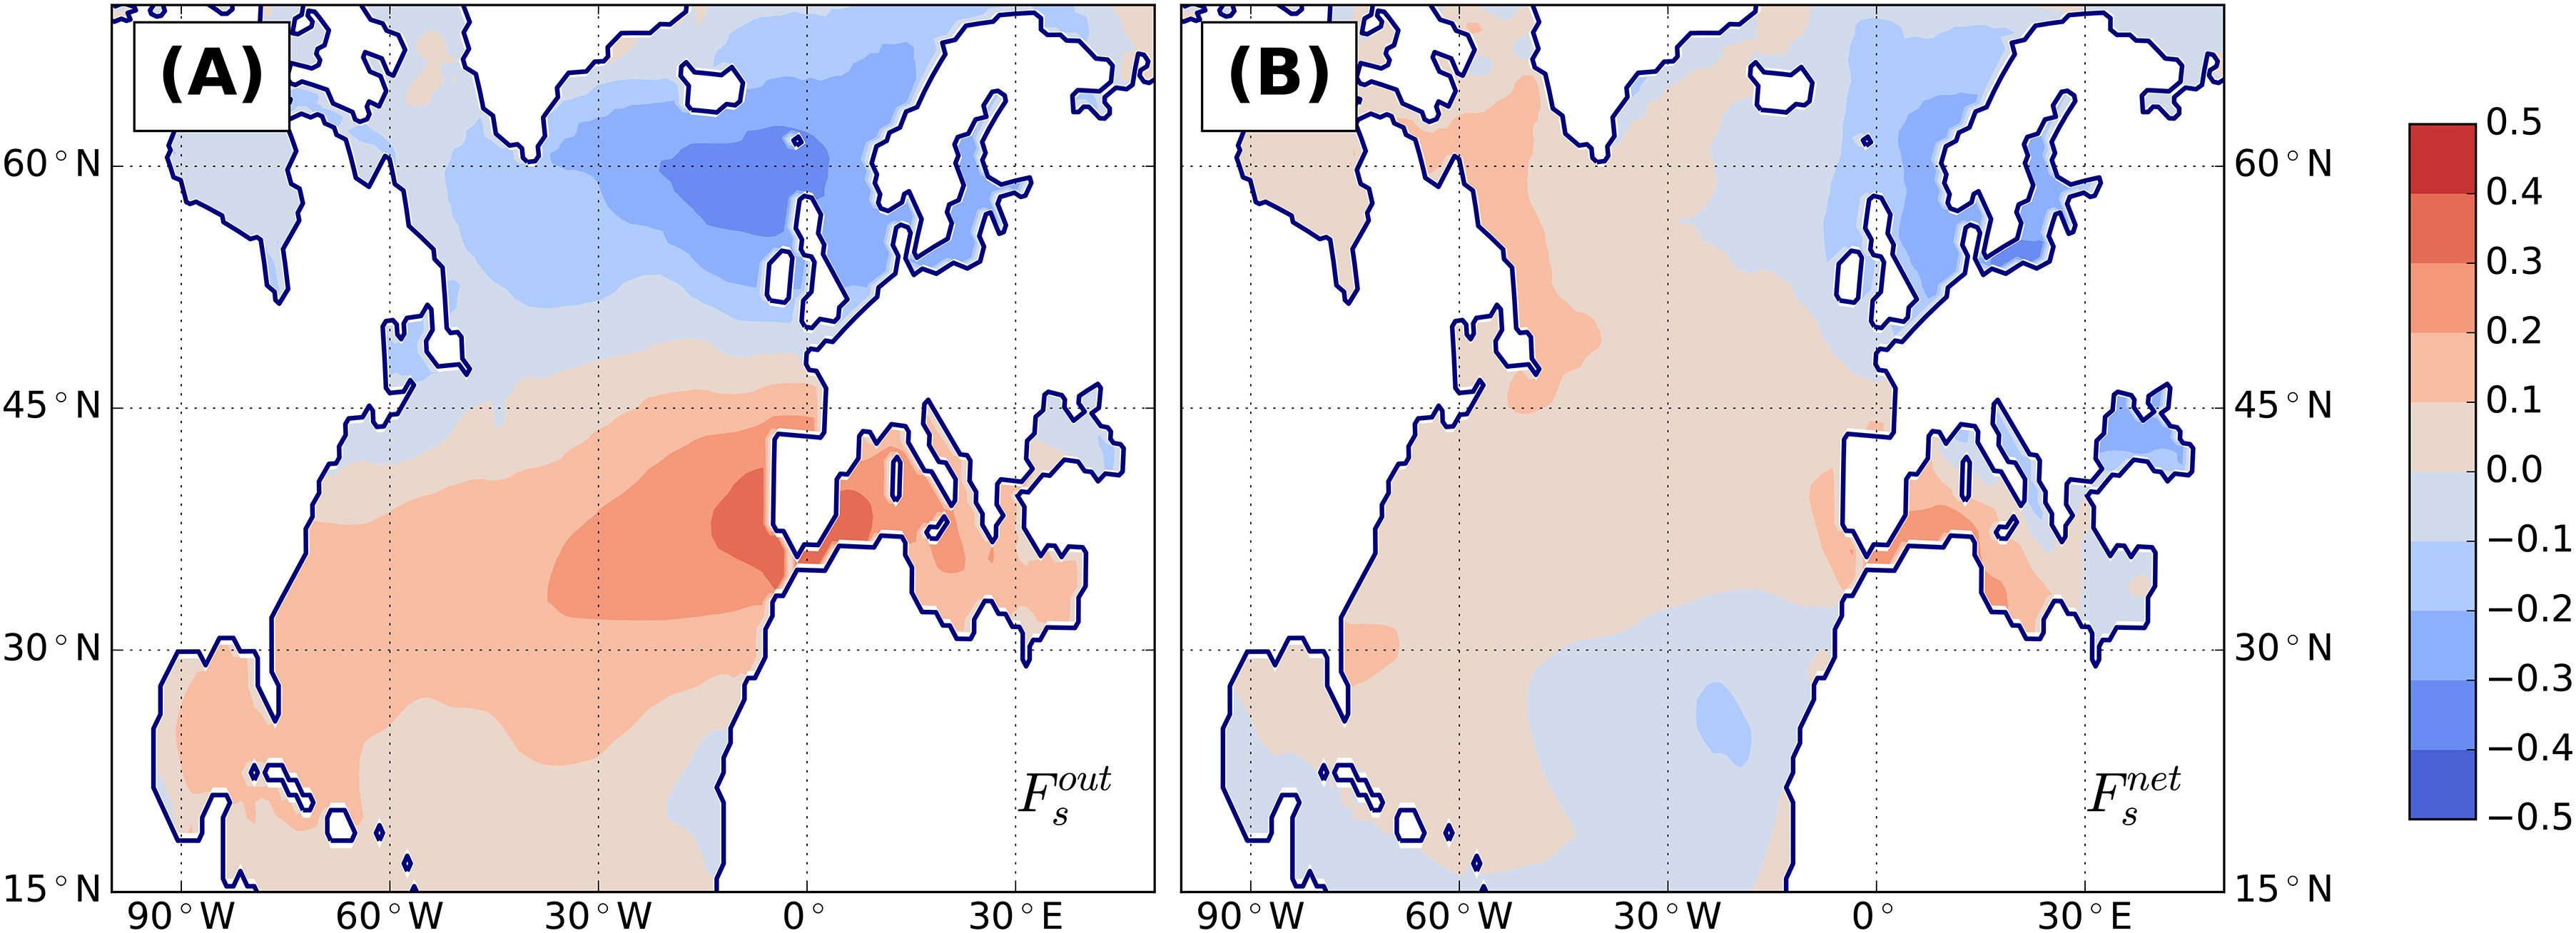
Fig. 6.
Correlation map of the zonal wind and the outflow (A) and net (B) salt transport. The spatial distribution for the former shows a dipole pattern, with a maximum in the vicinity of the Gulf of Cadiz and a minimum south of Iceland. This characteristic pattern suggests a NAO footprint.
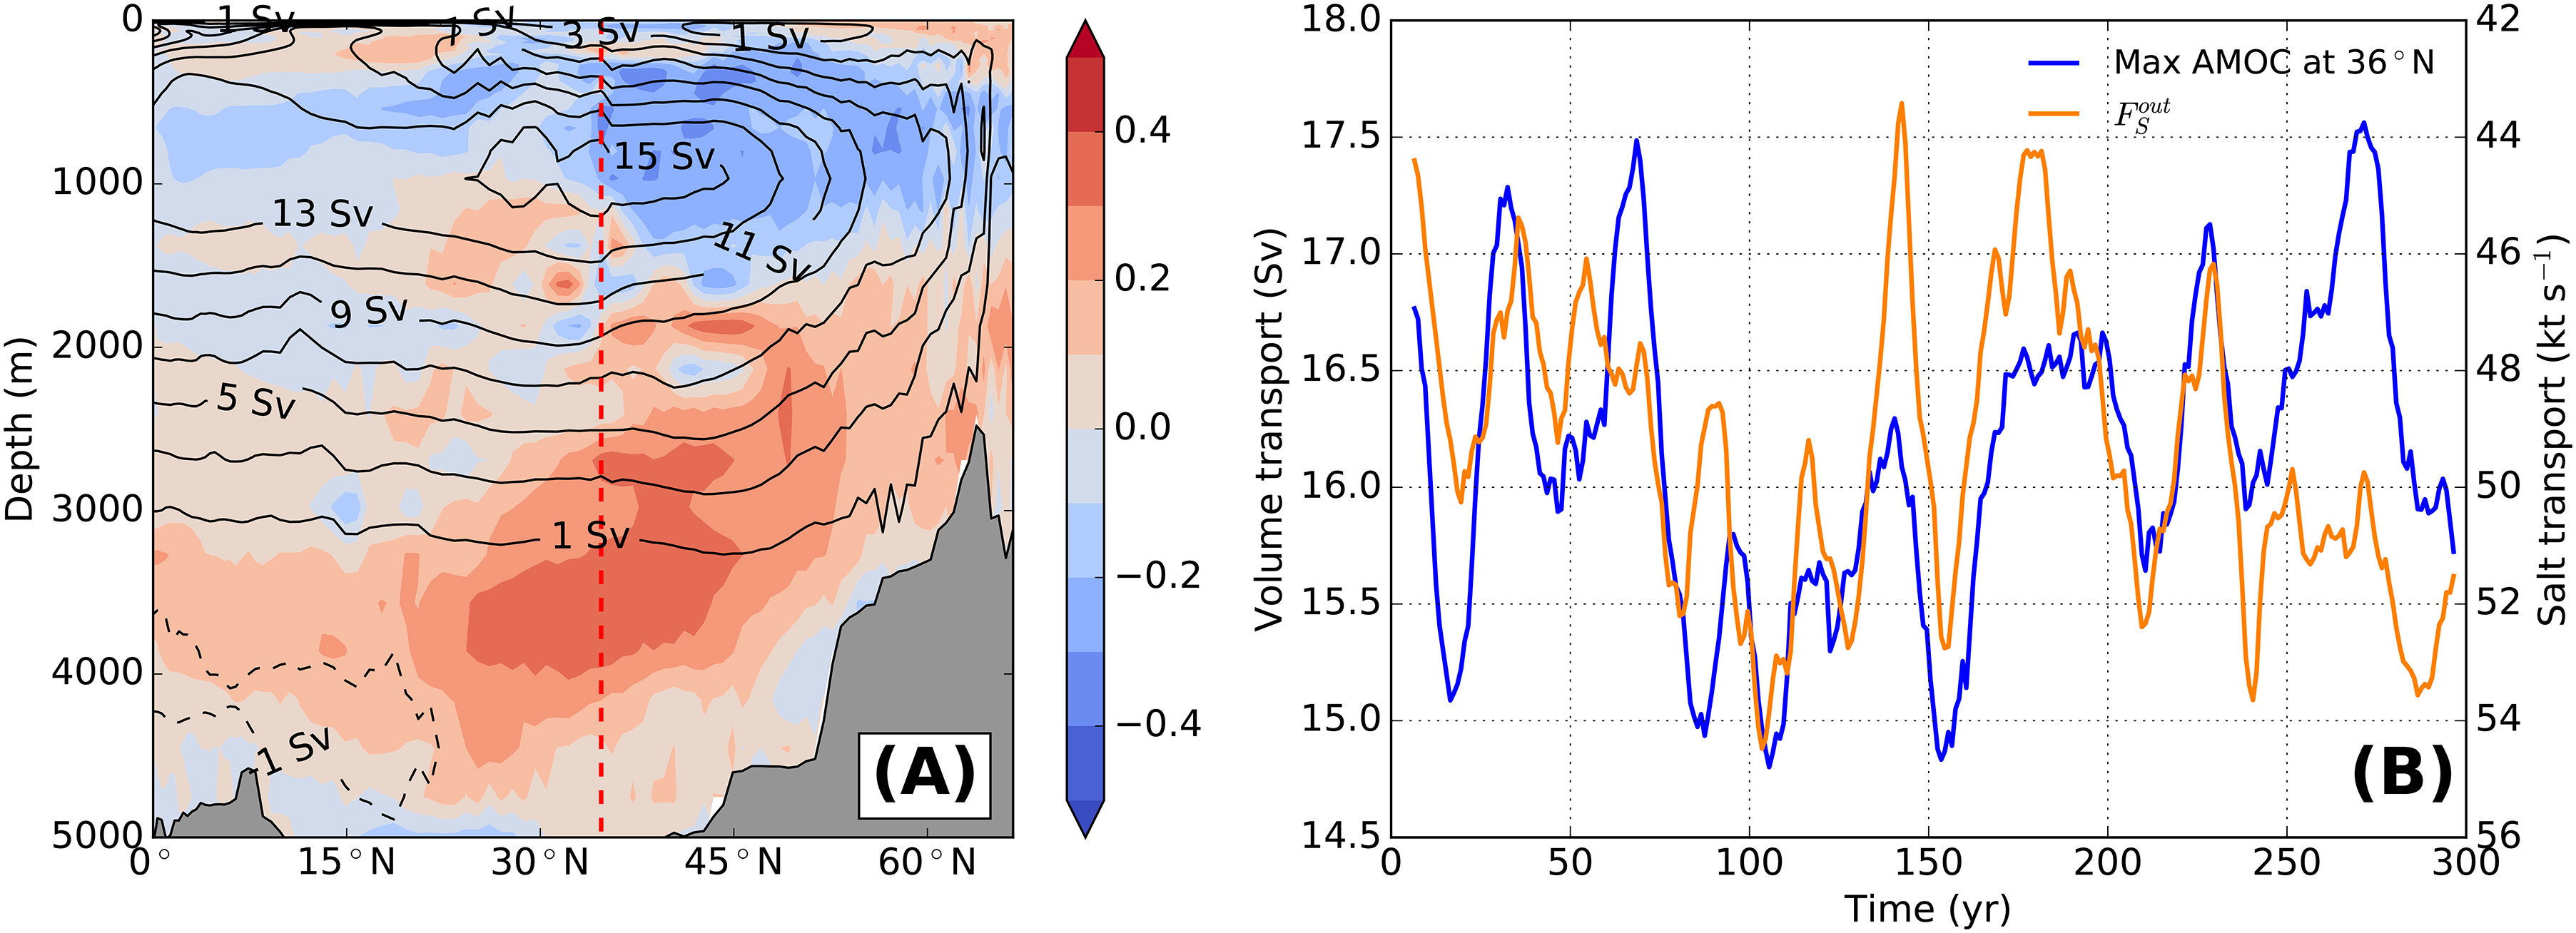
Fig. 7.
(A) Correlation between the meridional volume flux in the North Atlantic and the outward salt transport, , through the Strait of Gibraltar (SoG). The black contour lines represent the mean overturning stream function and the red dashed line corresponds to the latitude of the SoG. Streamline intervals are 2 Sv. (B): the maximum AMOC at 36°N (blue line) and the outward salt transport, , through SoG (orange line). A 10-year running average has been applied to both lines. Please notice the inversion of the y axis for the salt transport.