
Table 1.
Maximum, minimum and multi-model mean values of radiative feedback parameter and climate system inertia parameters C, CD and obtained from analysis of the CMIP5 models (Geoffroy et al., 2013a) and the corresponding values for σs from this study.
Table 2.
Maximum, minimum and multi-model mean values of model parameters used in calculations.
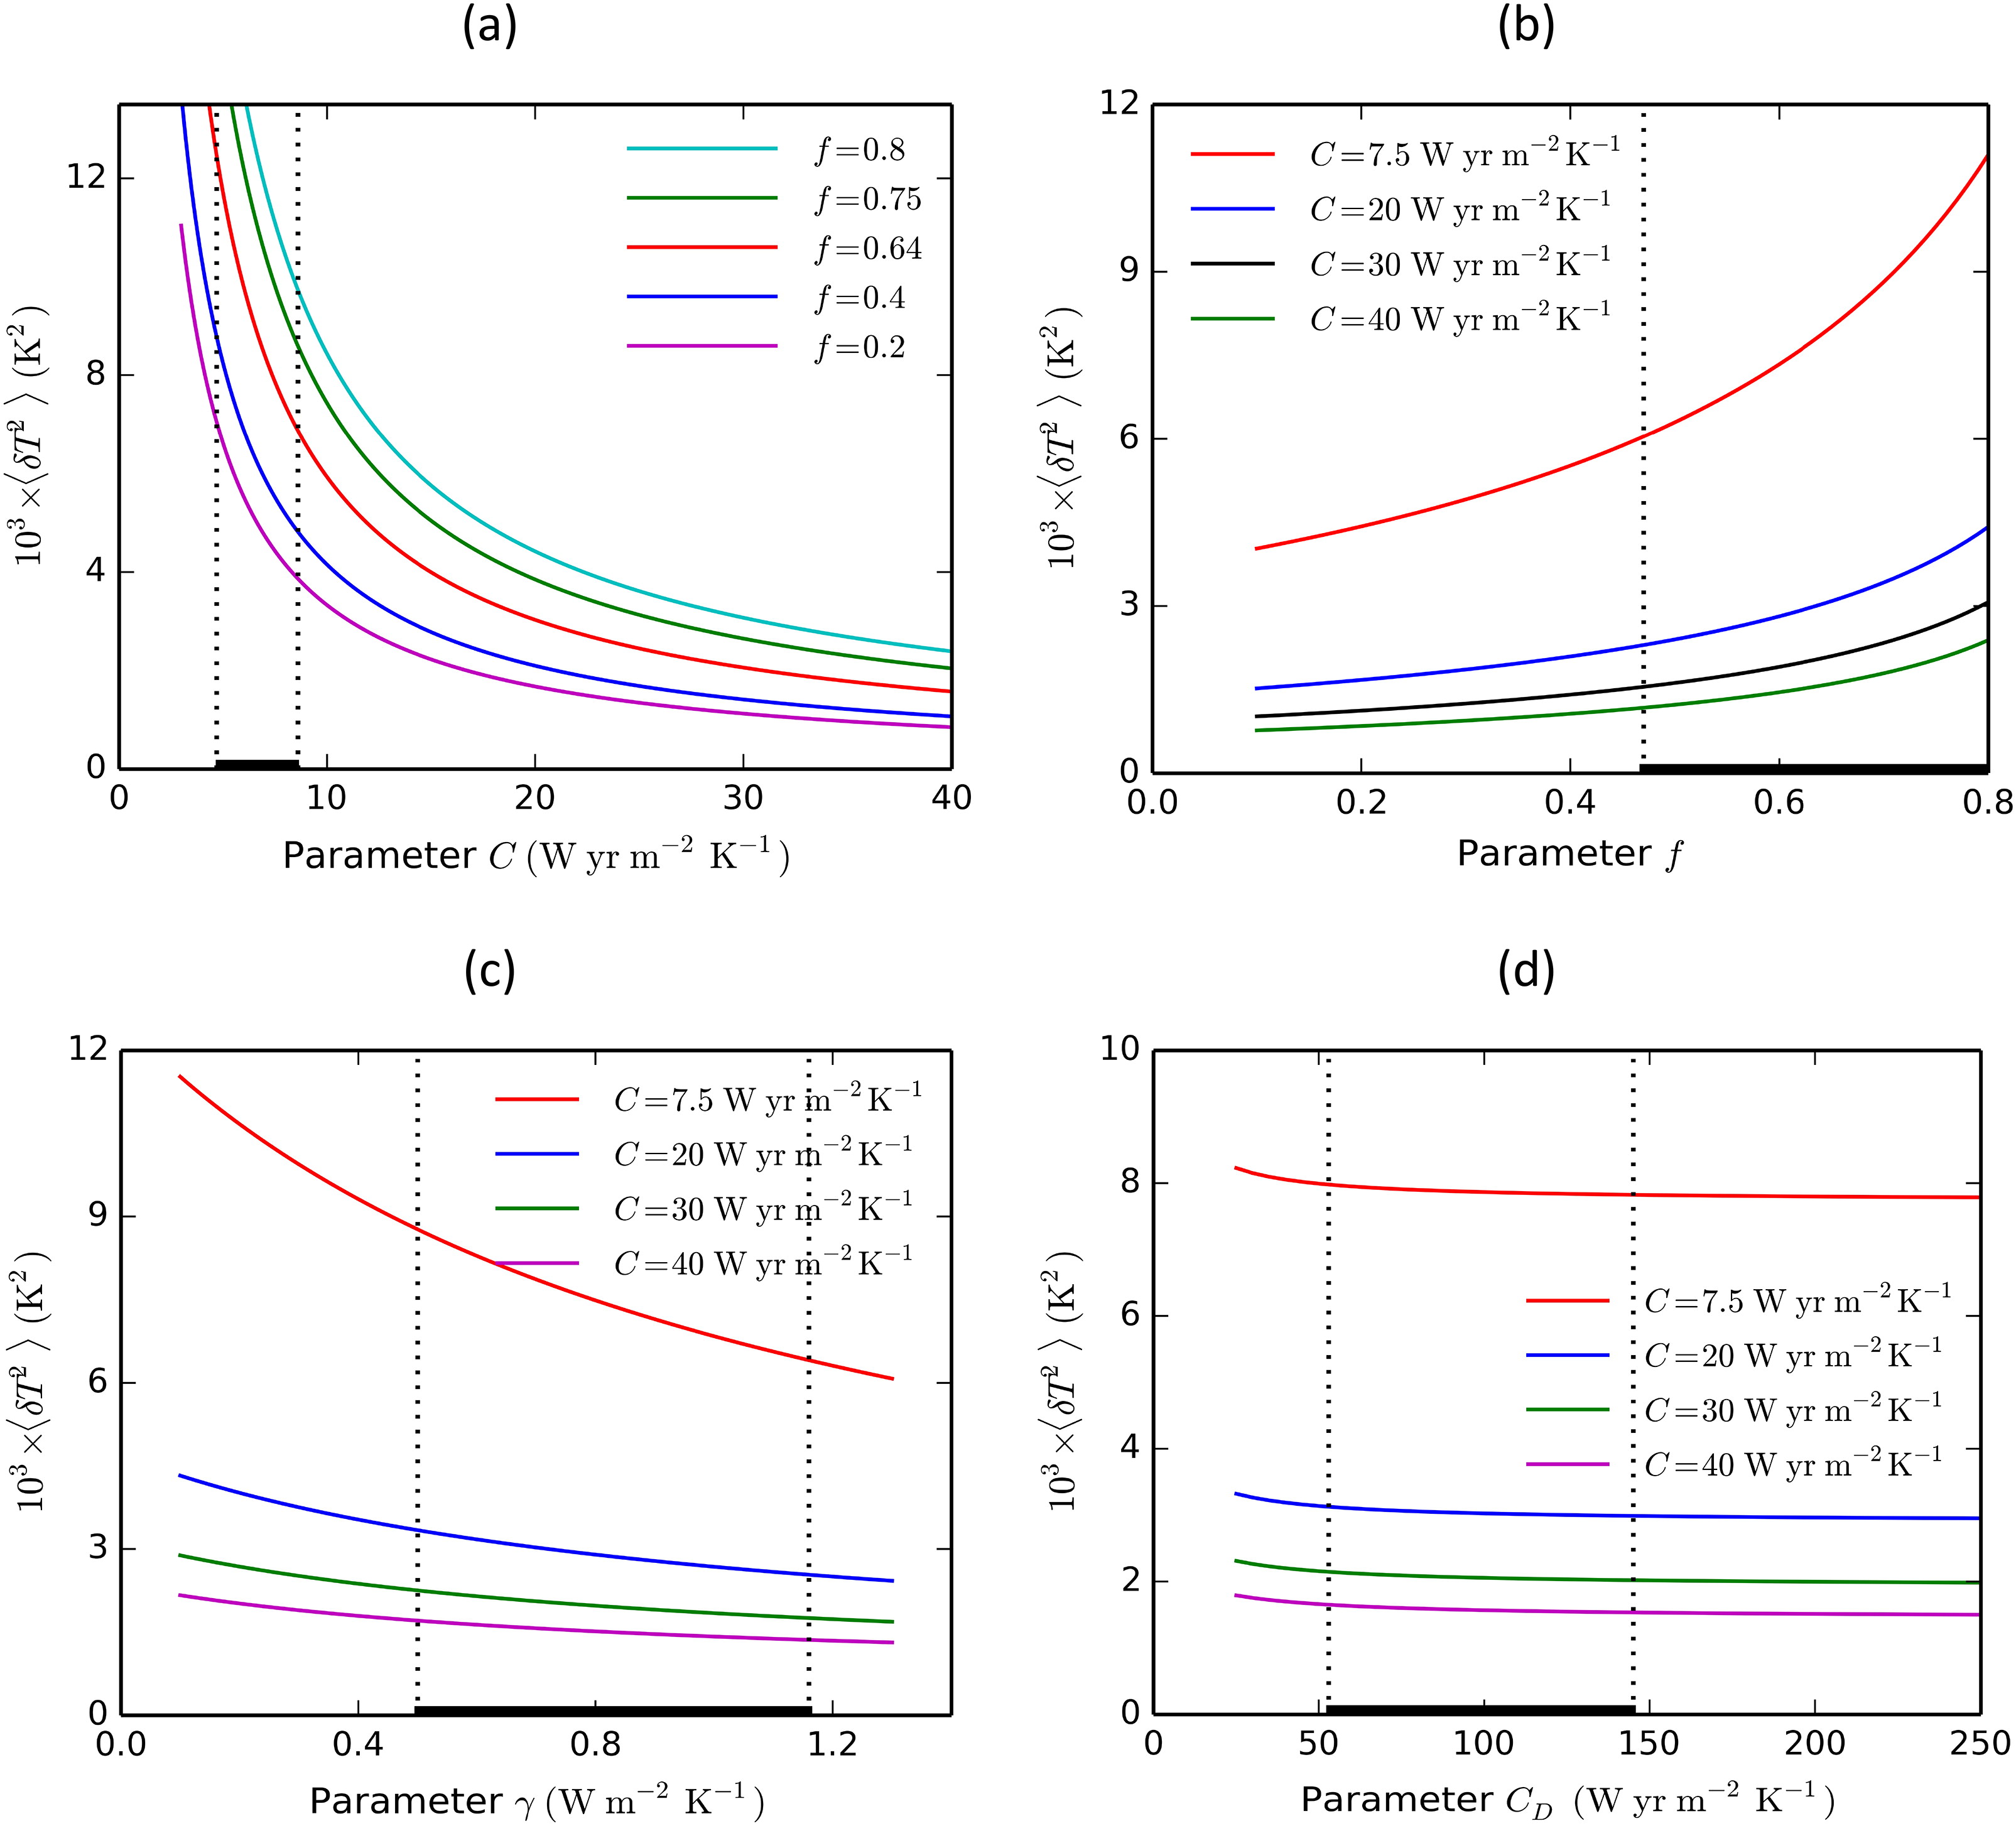
Fig. 1.
Surface temperature variance as a function of (a) upper layer effective heat capacity C, (b) feedback parameter f, (c) parameter γ and (d) lower layer effective heat capacity CD. The bold line indicates the range of parameter values obtained from analysis of the CMIP5 models (Geoffroy et al.,2013a).
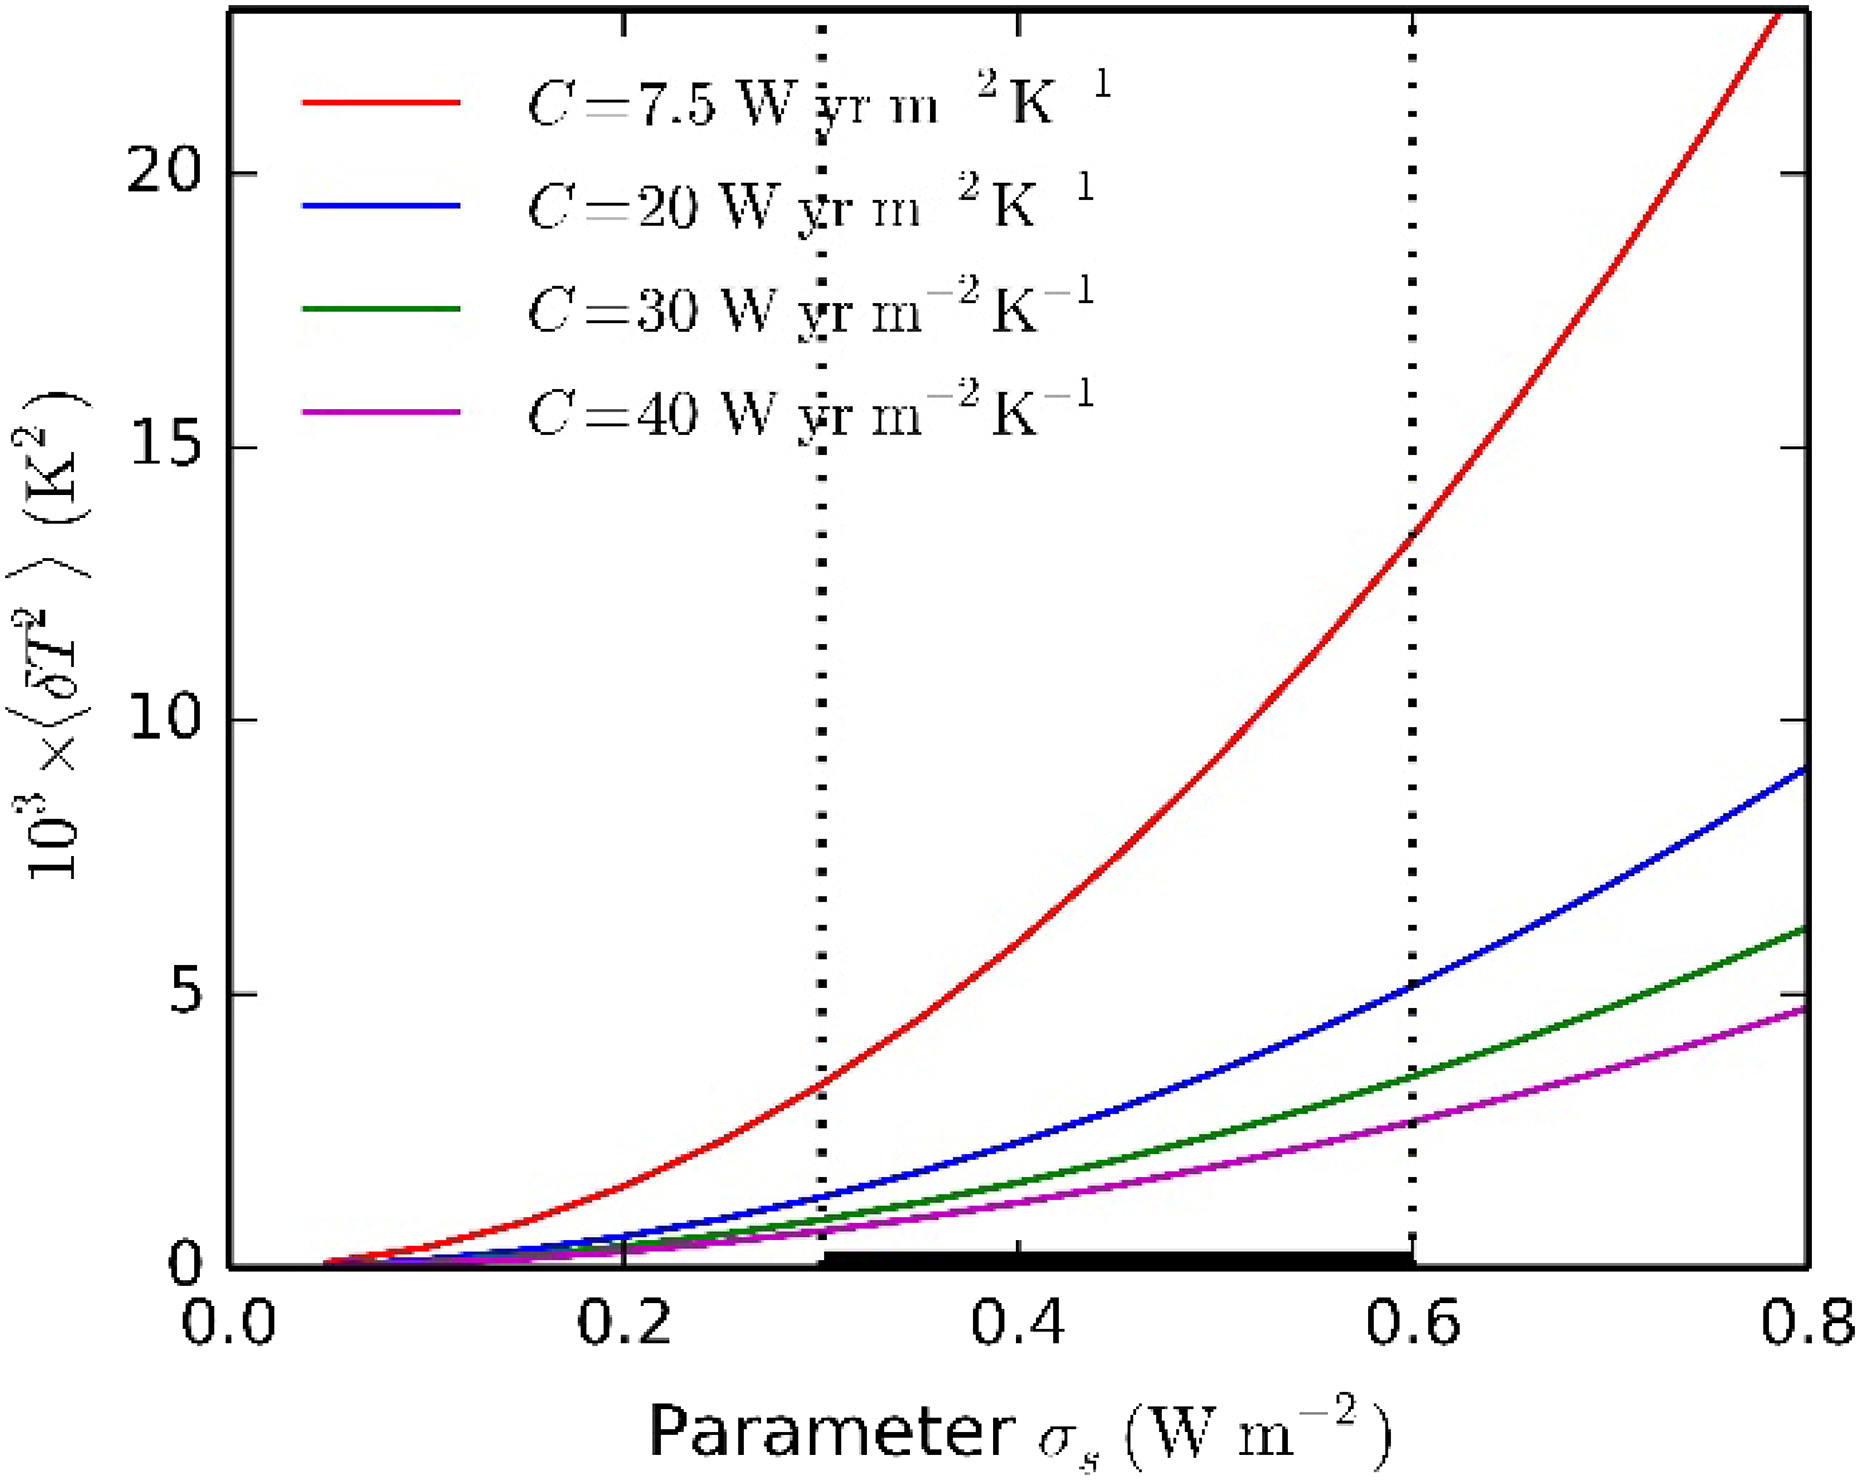
Fig. 2.
Surface temperature variance as a function of parameter . The bold line here is the calculated range from the CMIP5 models listed in Geoffroy et al., (2013a).
Table 3.
Calculated surface temperature variance for various values of the upper layer effective heat capacity C and the inter-annual, decadal and multi-decadal surface temperature variances obtained from the CMIP5 models.
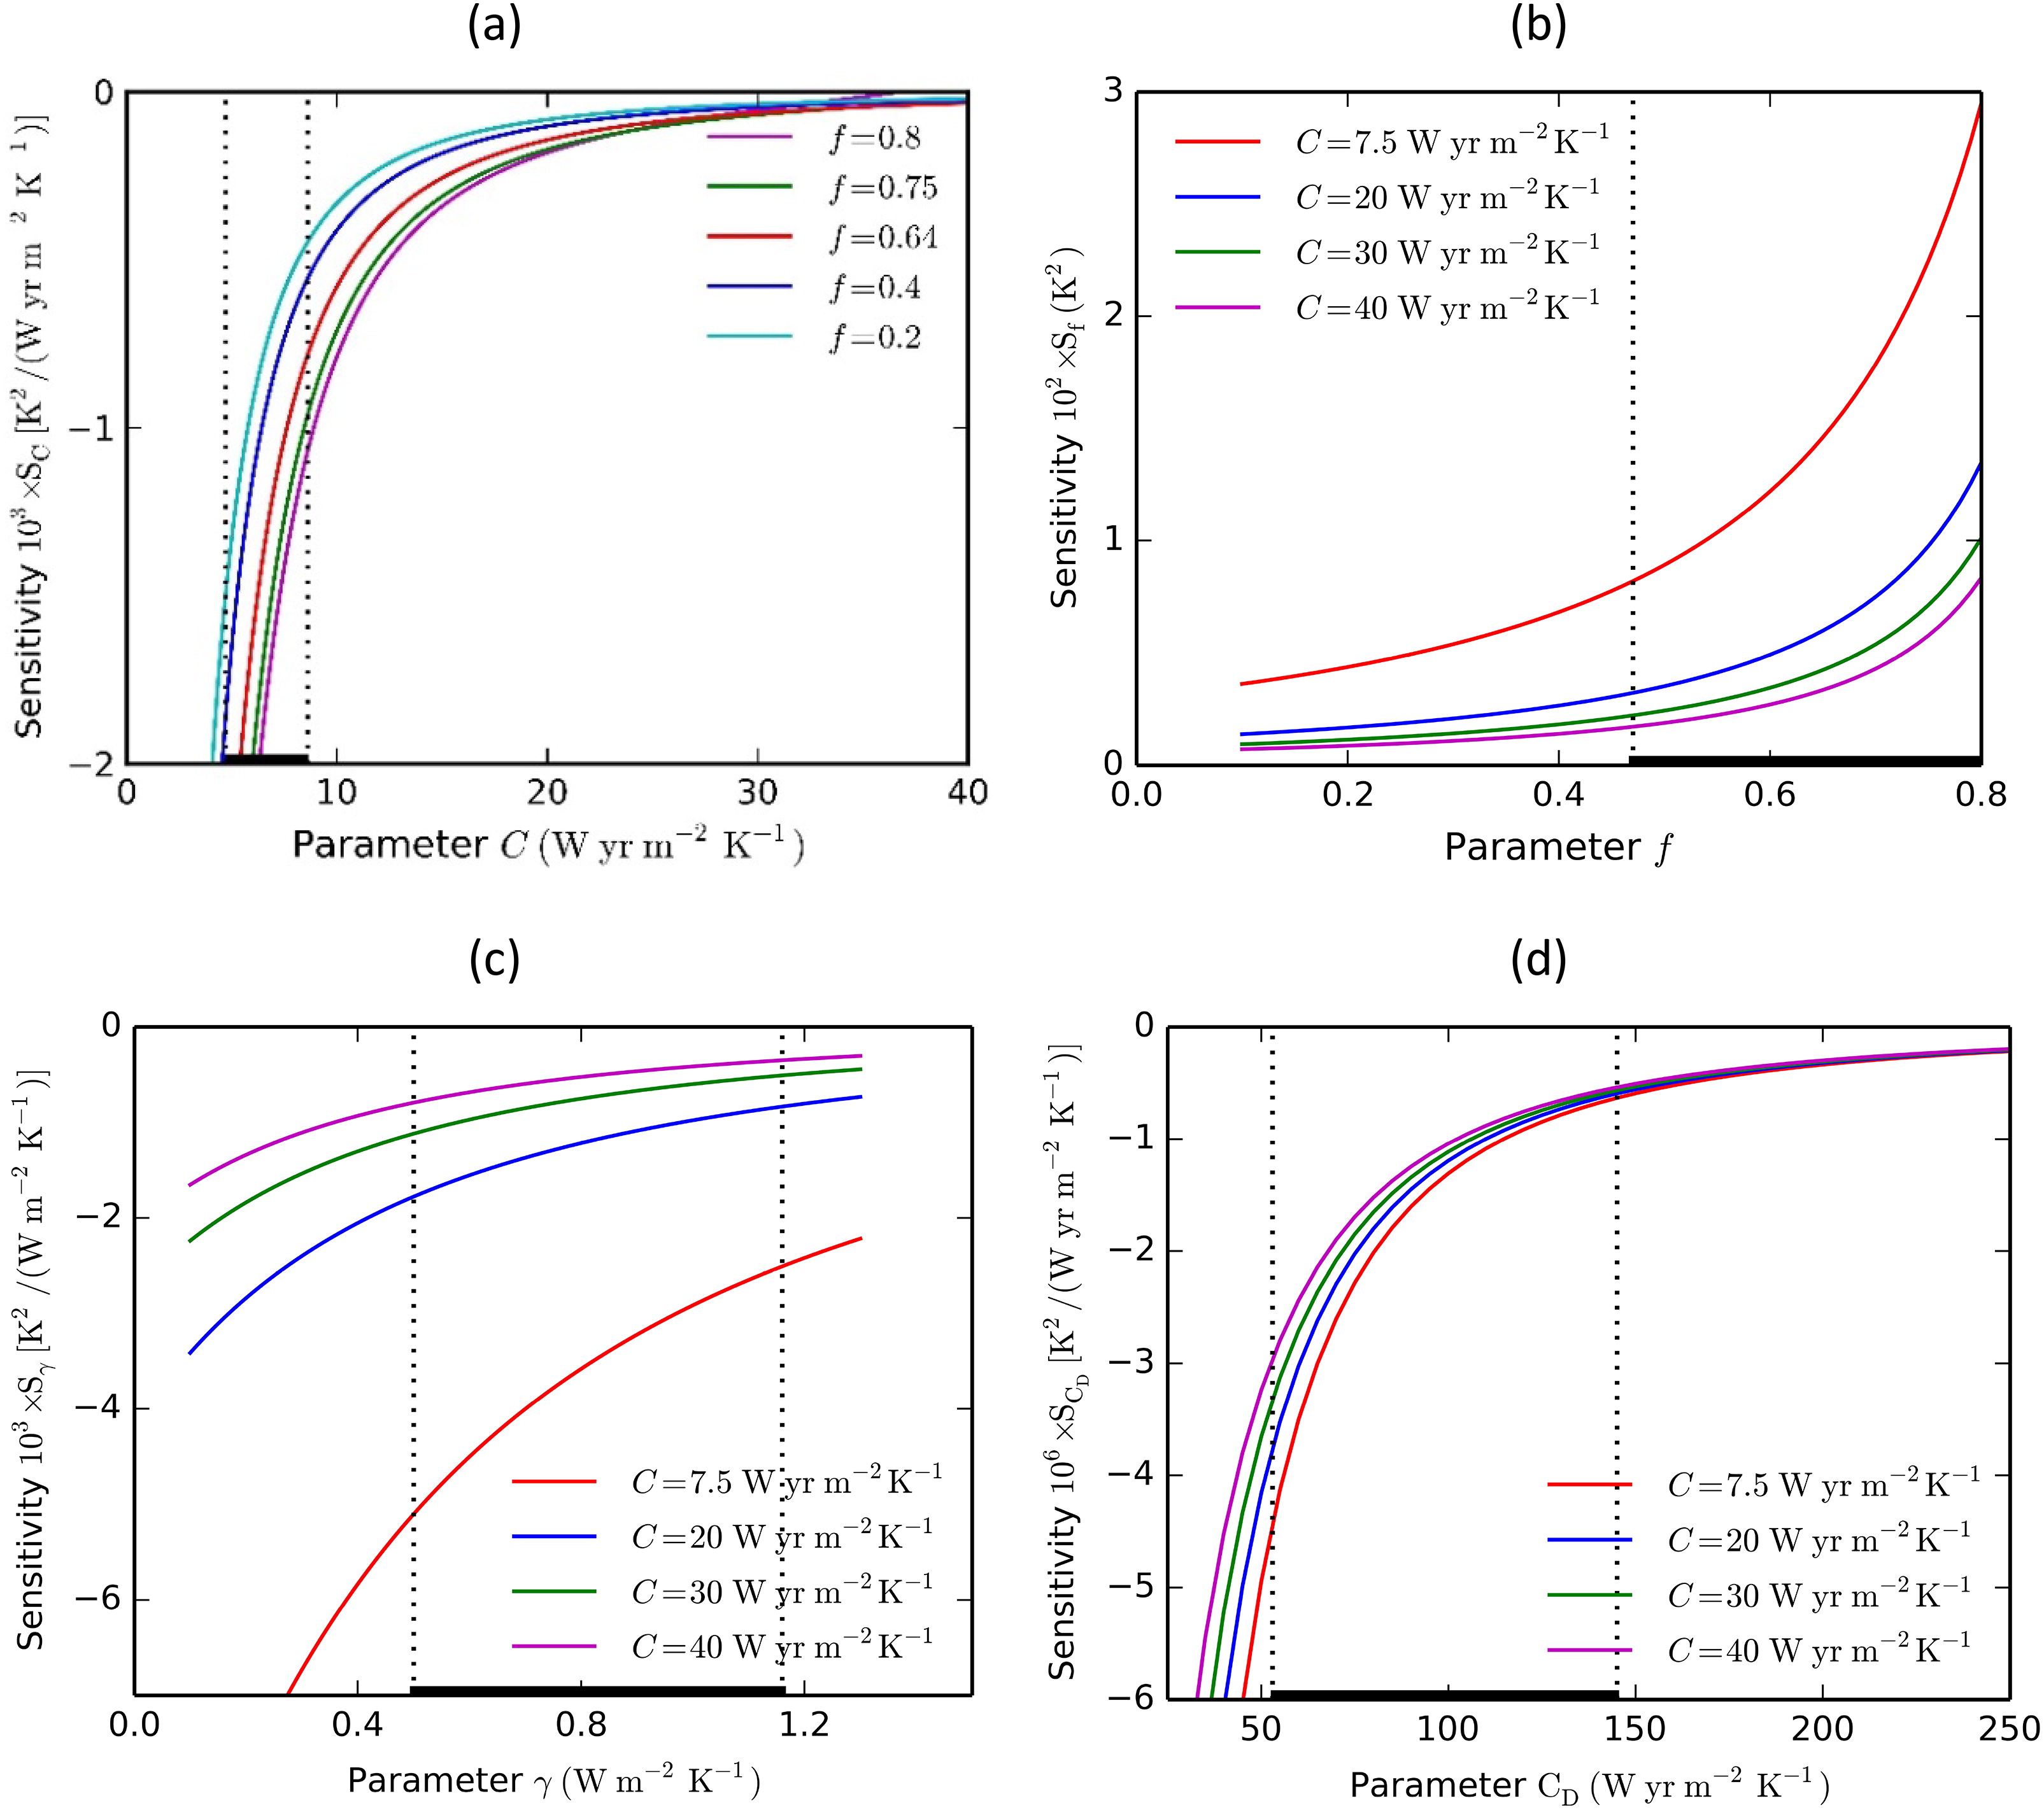
Fig. 3.
Sensitivity of surface temperature variance to (a) upper layer effective heat capacity C, (b) feedback parameter f, (c) parameter γ and (d) lower layer effective heat capacity CD. The bold line indicates the range of parameter values obtained from analysis of the CMIP5 models (Geoffroy et al.,2013a).
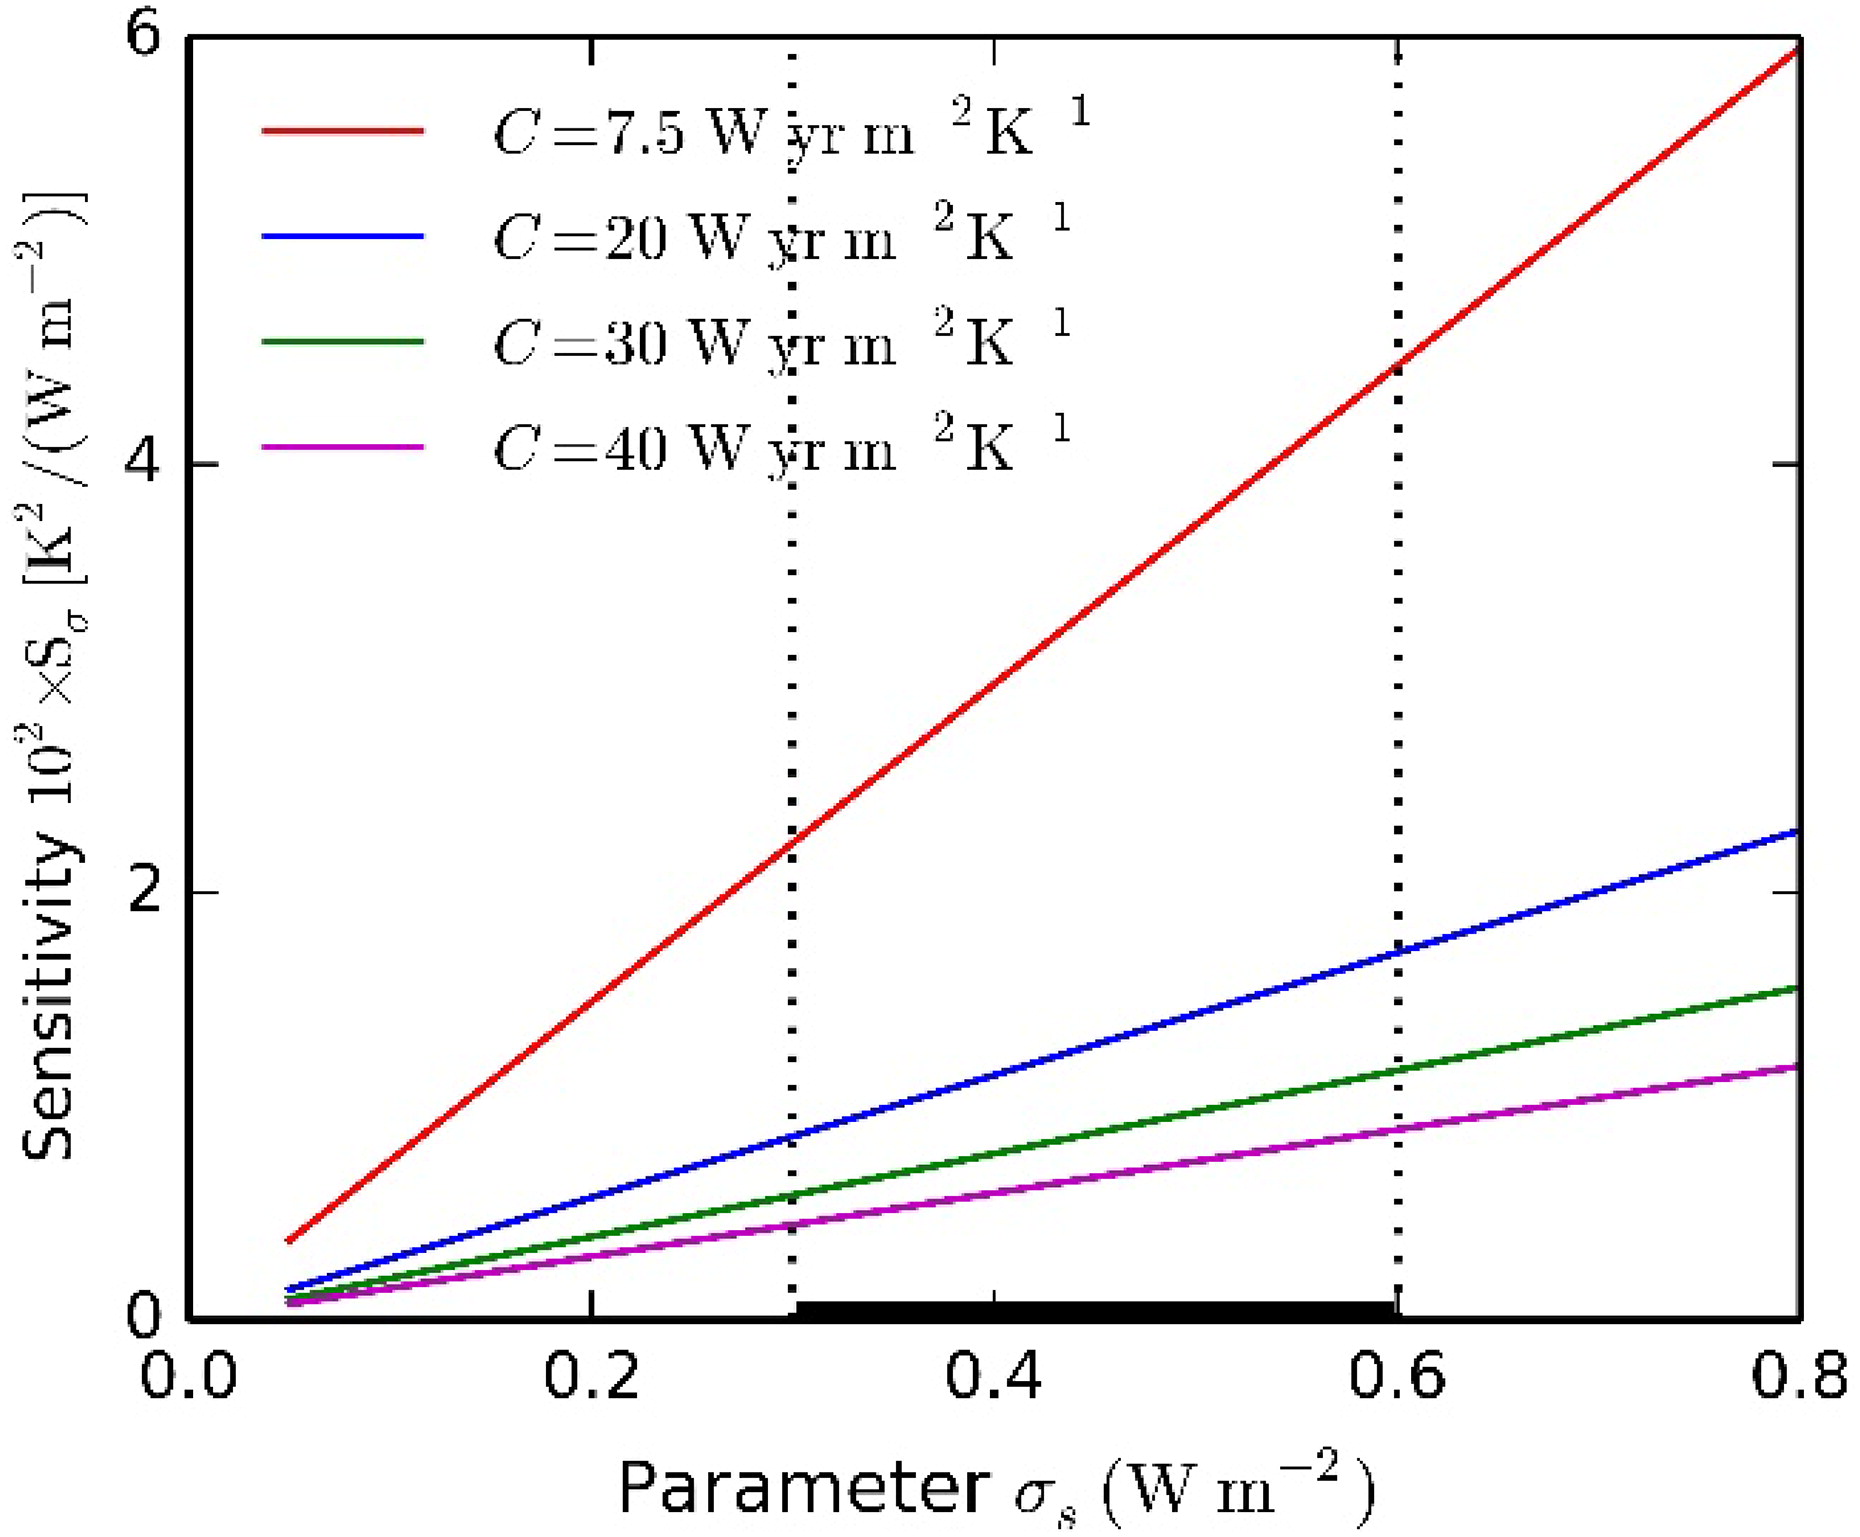
Fig. 4.
Sensitivity of the surface temperature variance to parameter . The bold line here is the calculated range from the CMIP5 models listed in Geoffroy et al., (2013a).
Table 4.
Changes in the absolute value of surface temperature variance caused by variations in model parameters whose absolute values deviate 5% from the base values .
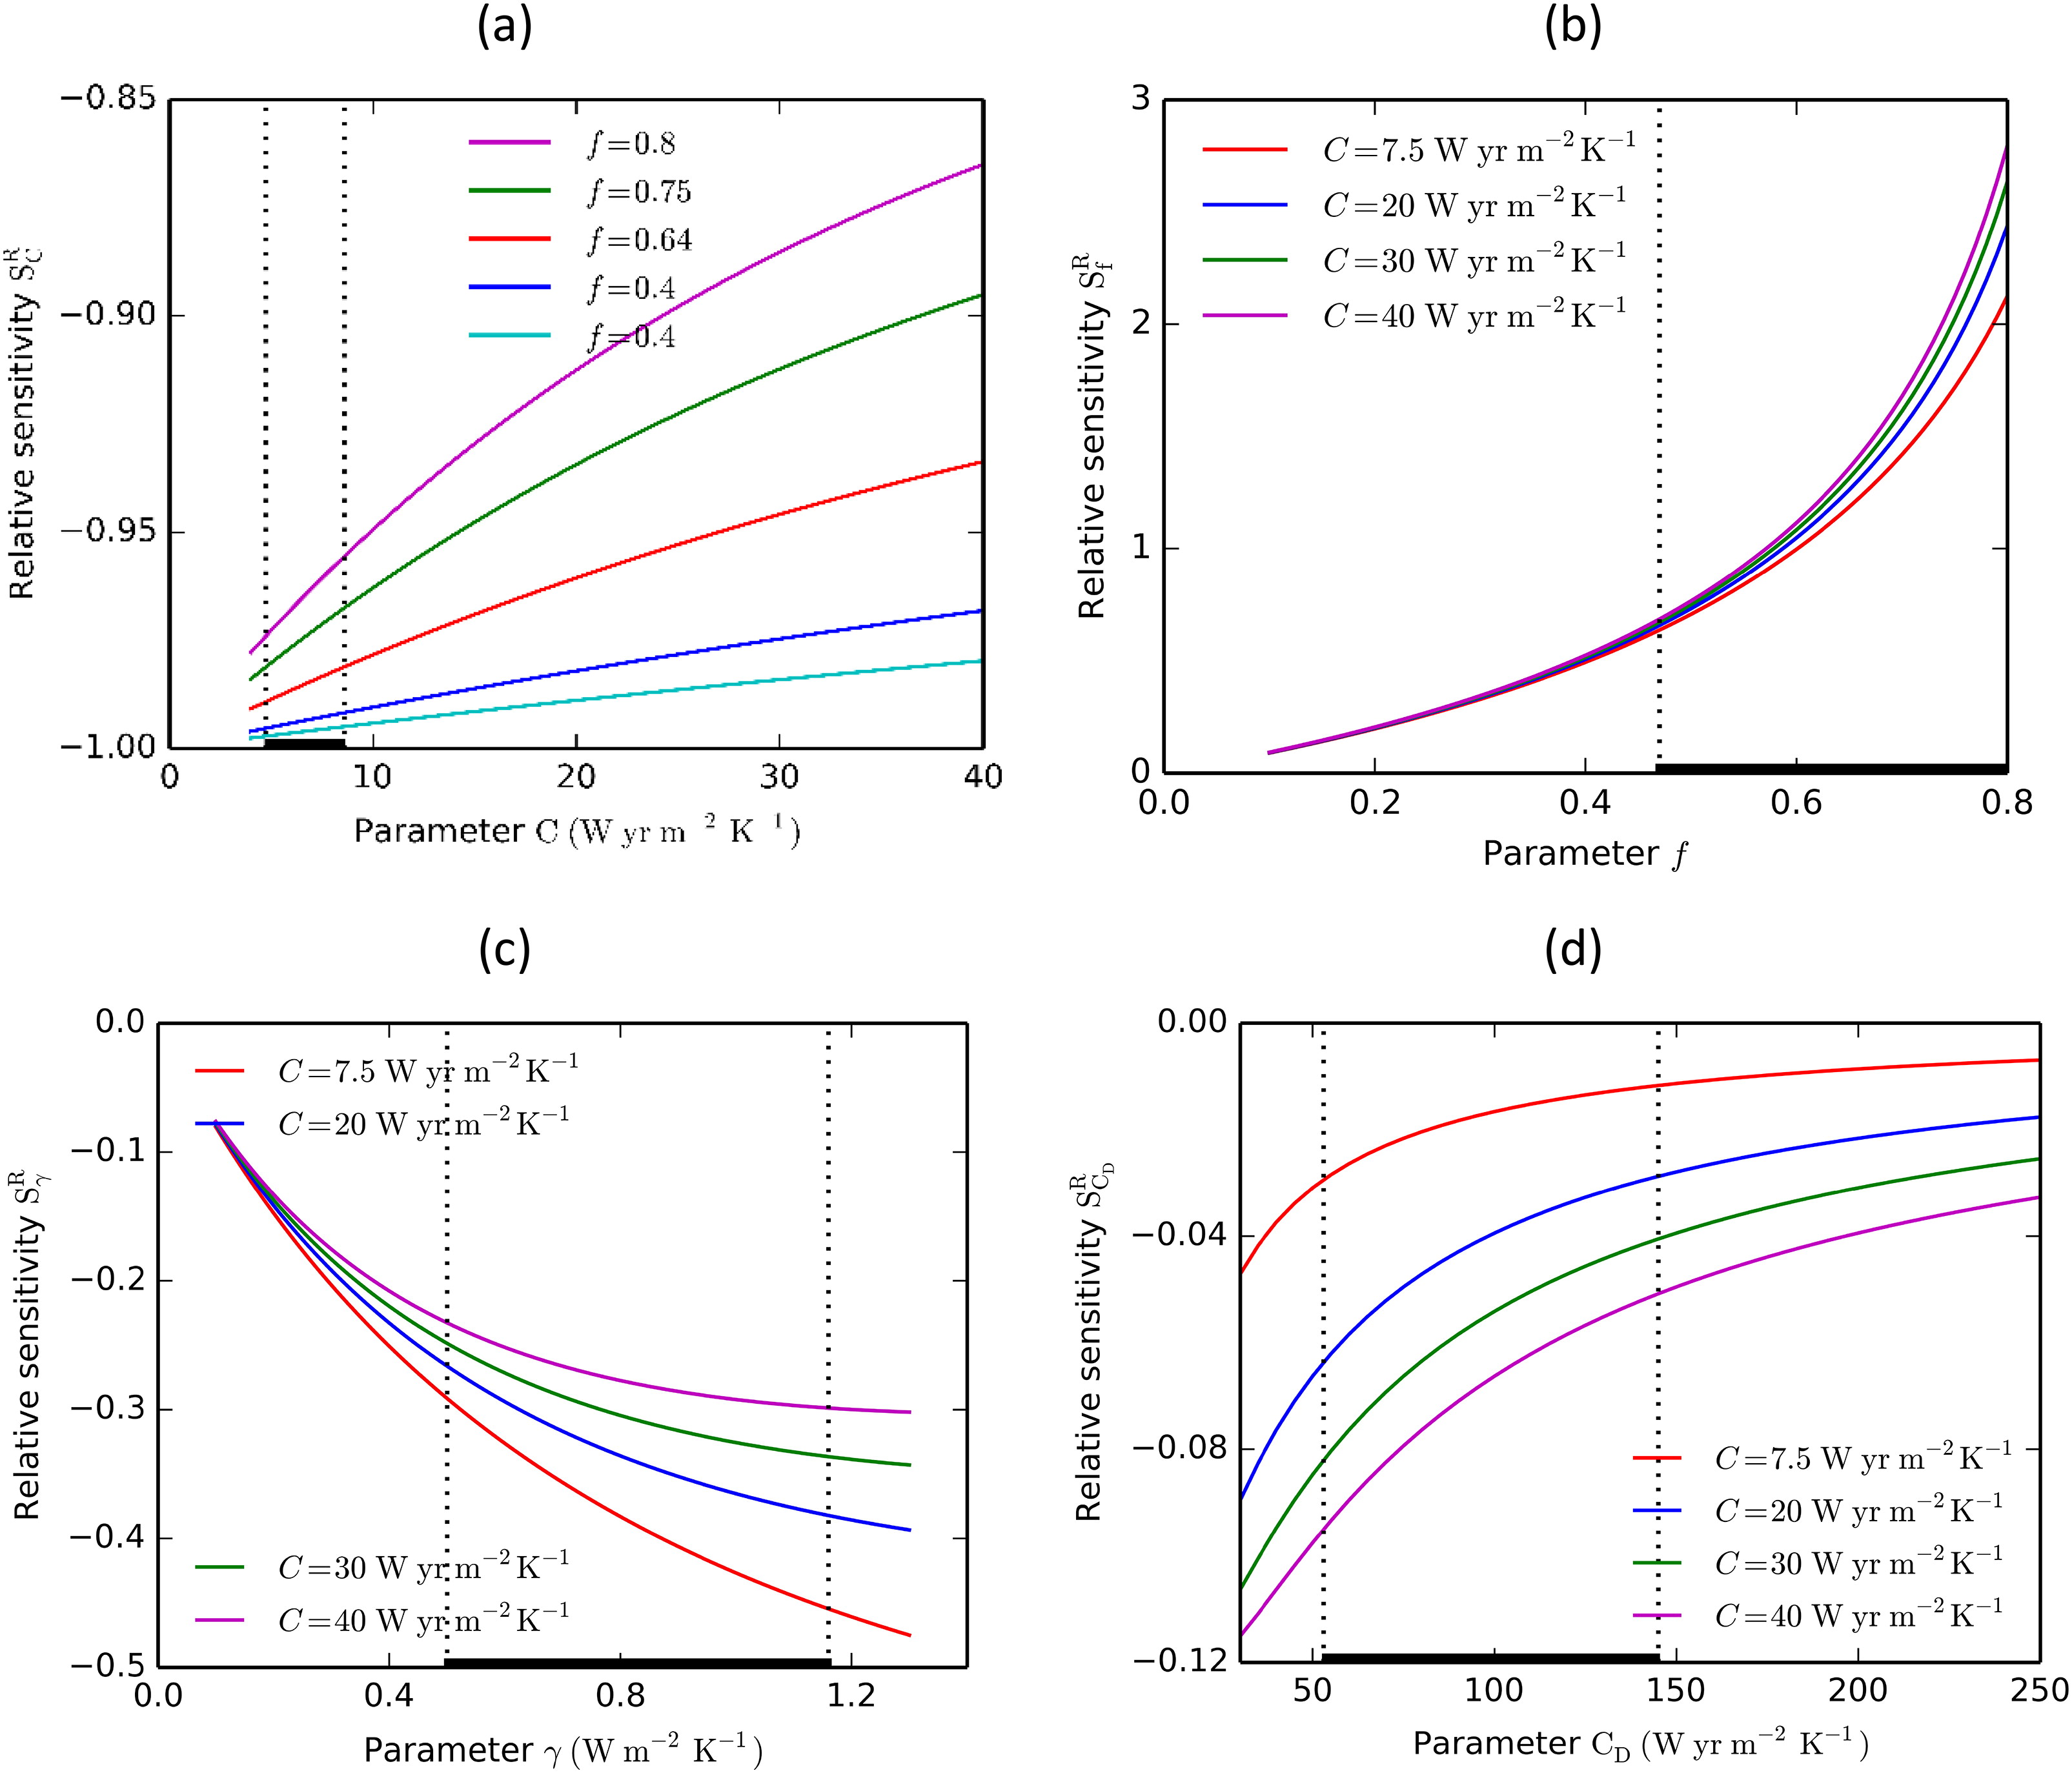
Fig. 5.
Relative sensitivity of surface temperature variance to (a) upper layer effective heat capacity C, (b) feedback parameter f, (c) parameter γ and (d) lower layer effective heat capacity CD. The bold line indicates the range of parameter values obtained from analysis of the CMIP5 models (Geoffroy et al.,2013a).
Table 5.
Relative sensitivity coefficients calculated for annual, decadal and multi-decadal surface temperature variability.
C = 7.5 W yr m−2 K−1−0.97−0.021.14−0.362.00Decadal variability
C = 20 W yr m−2 K−1−0.94−0.041.21−0.322.00Multi-decadal variability
C = 30 W yr m−2 K−1−0.91−0.051.26−0.292.00Multi-decadal variability
C = 40 W yr m−2 K−1−0.89−0.071.30−0.272.00
Table 6.
Surface temperature variances calculated for maximum and minimum values of model parameters.
[i] The values for C, , and CD are obtained from analysis of the CMIP5 models (Geoffroy et al., 2013a), and the values for are from this study.