
Table 1.
Used methods in this paper. Enumeration of the IMILAST members is same as in Neu et al. (2013). Methods which do not provide cyclone central core pressure are printed in italics.
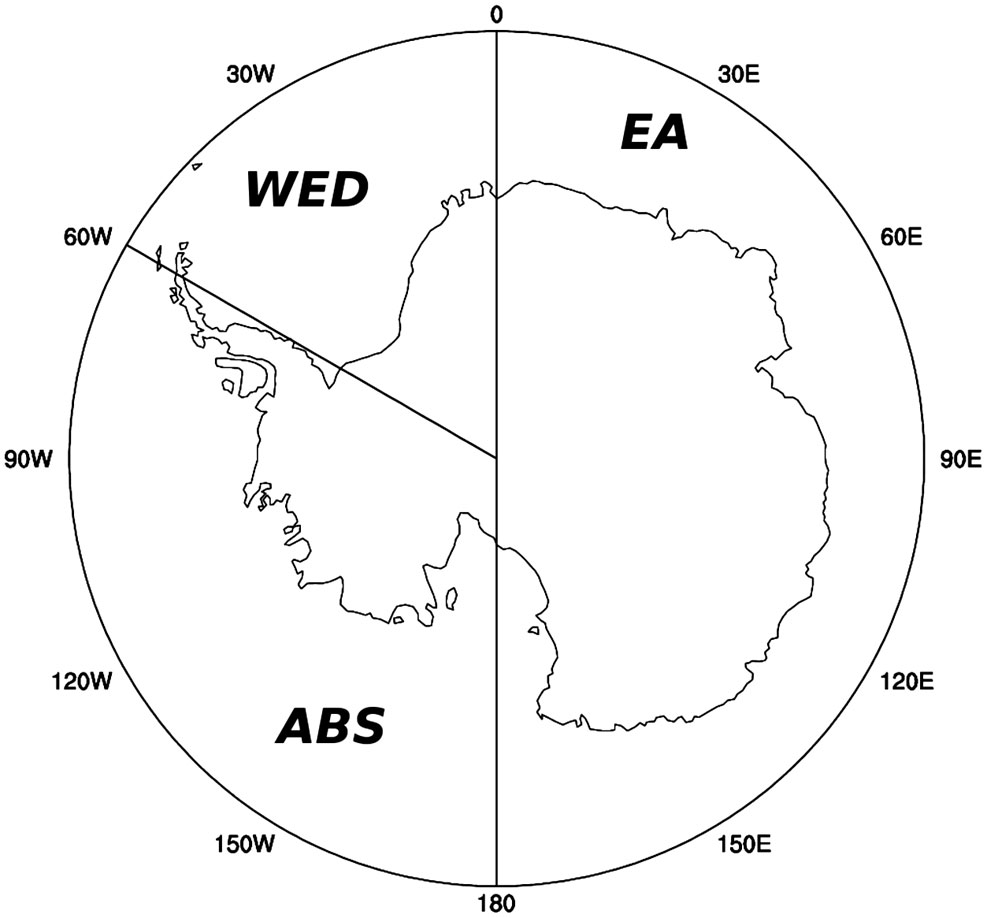
Fig. 1.
The Antarctic continent and the surrounding SO south of 60°S, referred to as S60 in this study. Also shown are the three sectors, i.e. East Antarctica (0°–180°, EA), Amundsen-Bellingshausen Sea (180–60°W, ABS), and Weddell Sea (60°W–0°, WED), considered here.
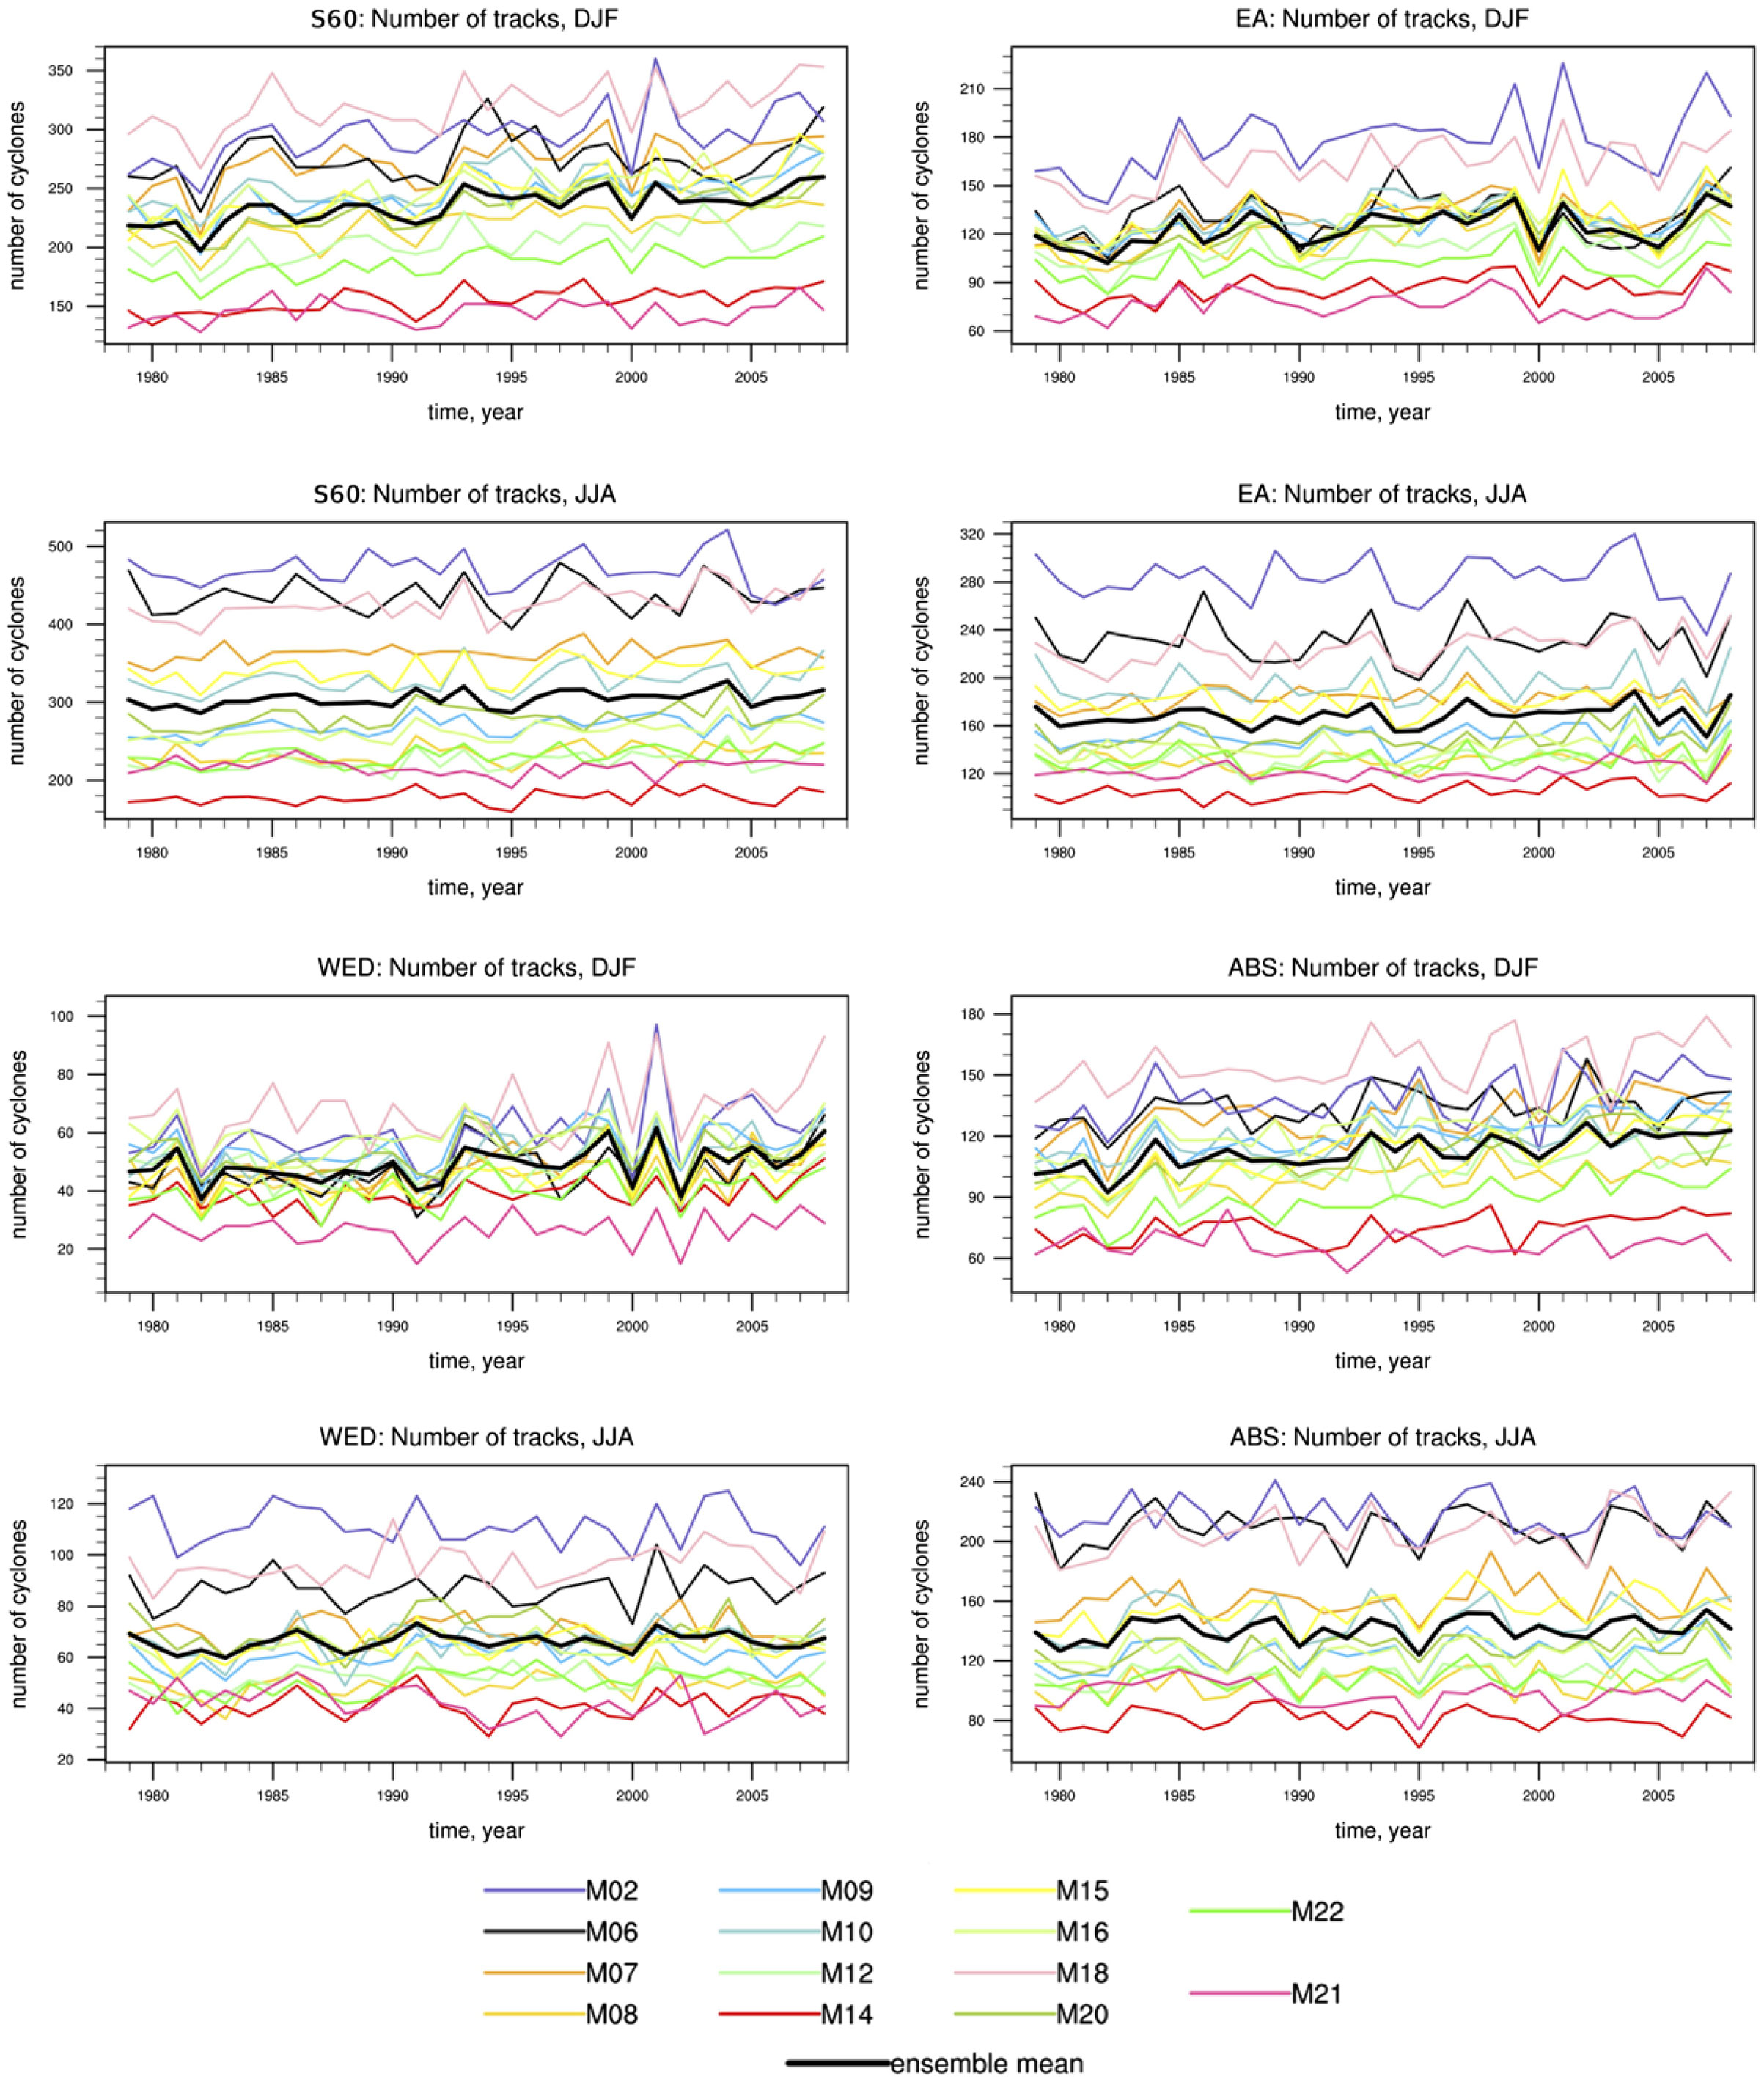
Fig. 2.
Time series of number of identified cyclone tracks in the regions S60, EA, WED, ABS for austral winter and summer.
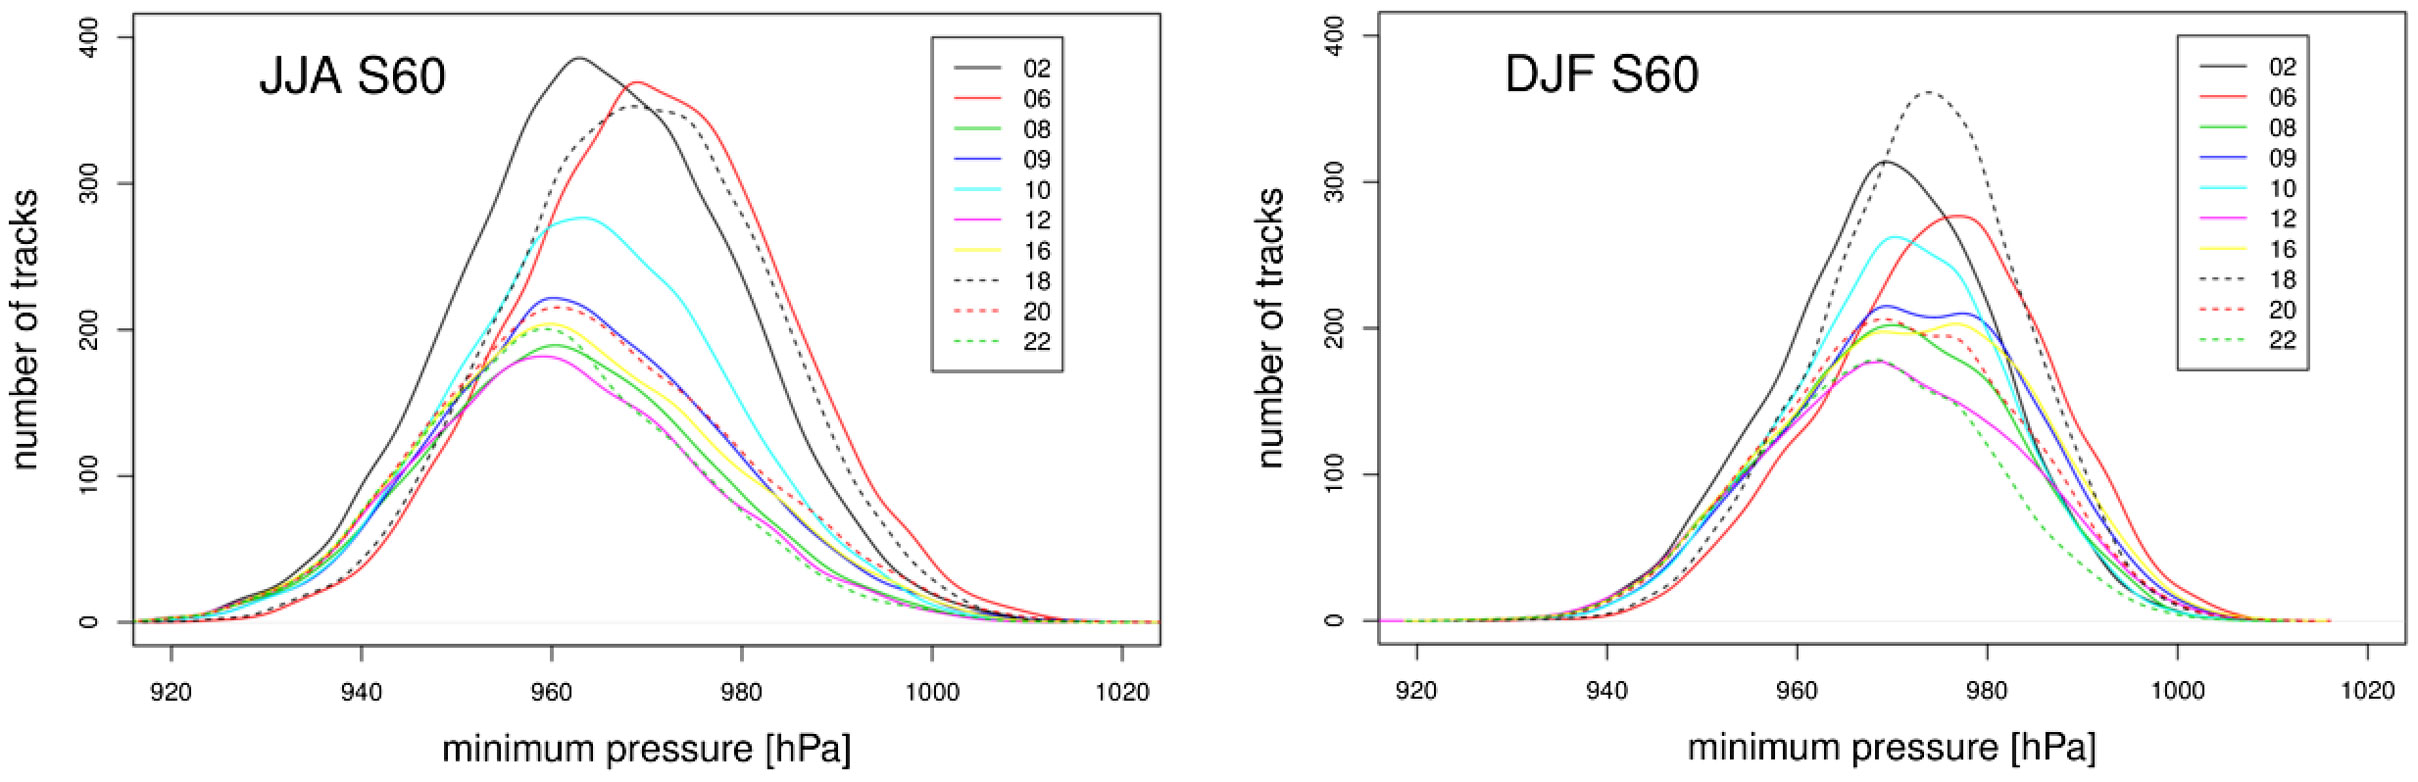
Fig. 3.
Density distribution of minimum pressure for each cyclone track in S60 multiplied by the number of identified tracks for each method identified per season.
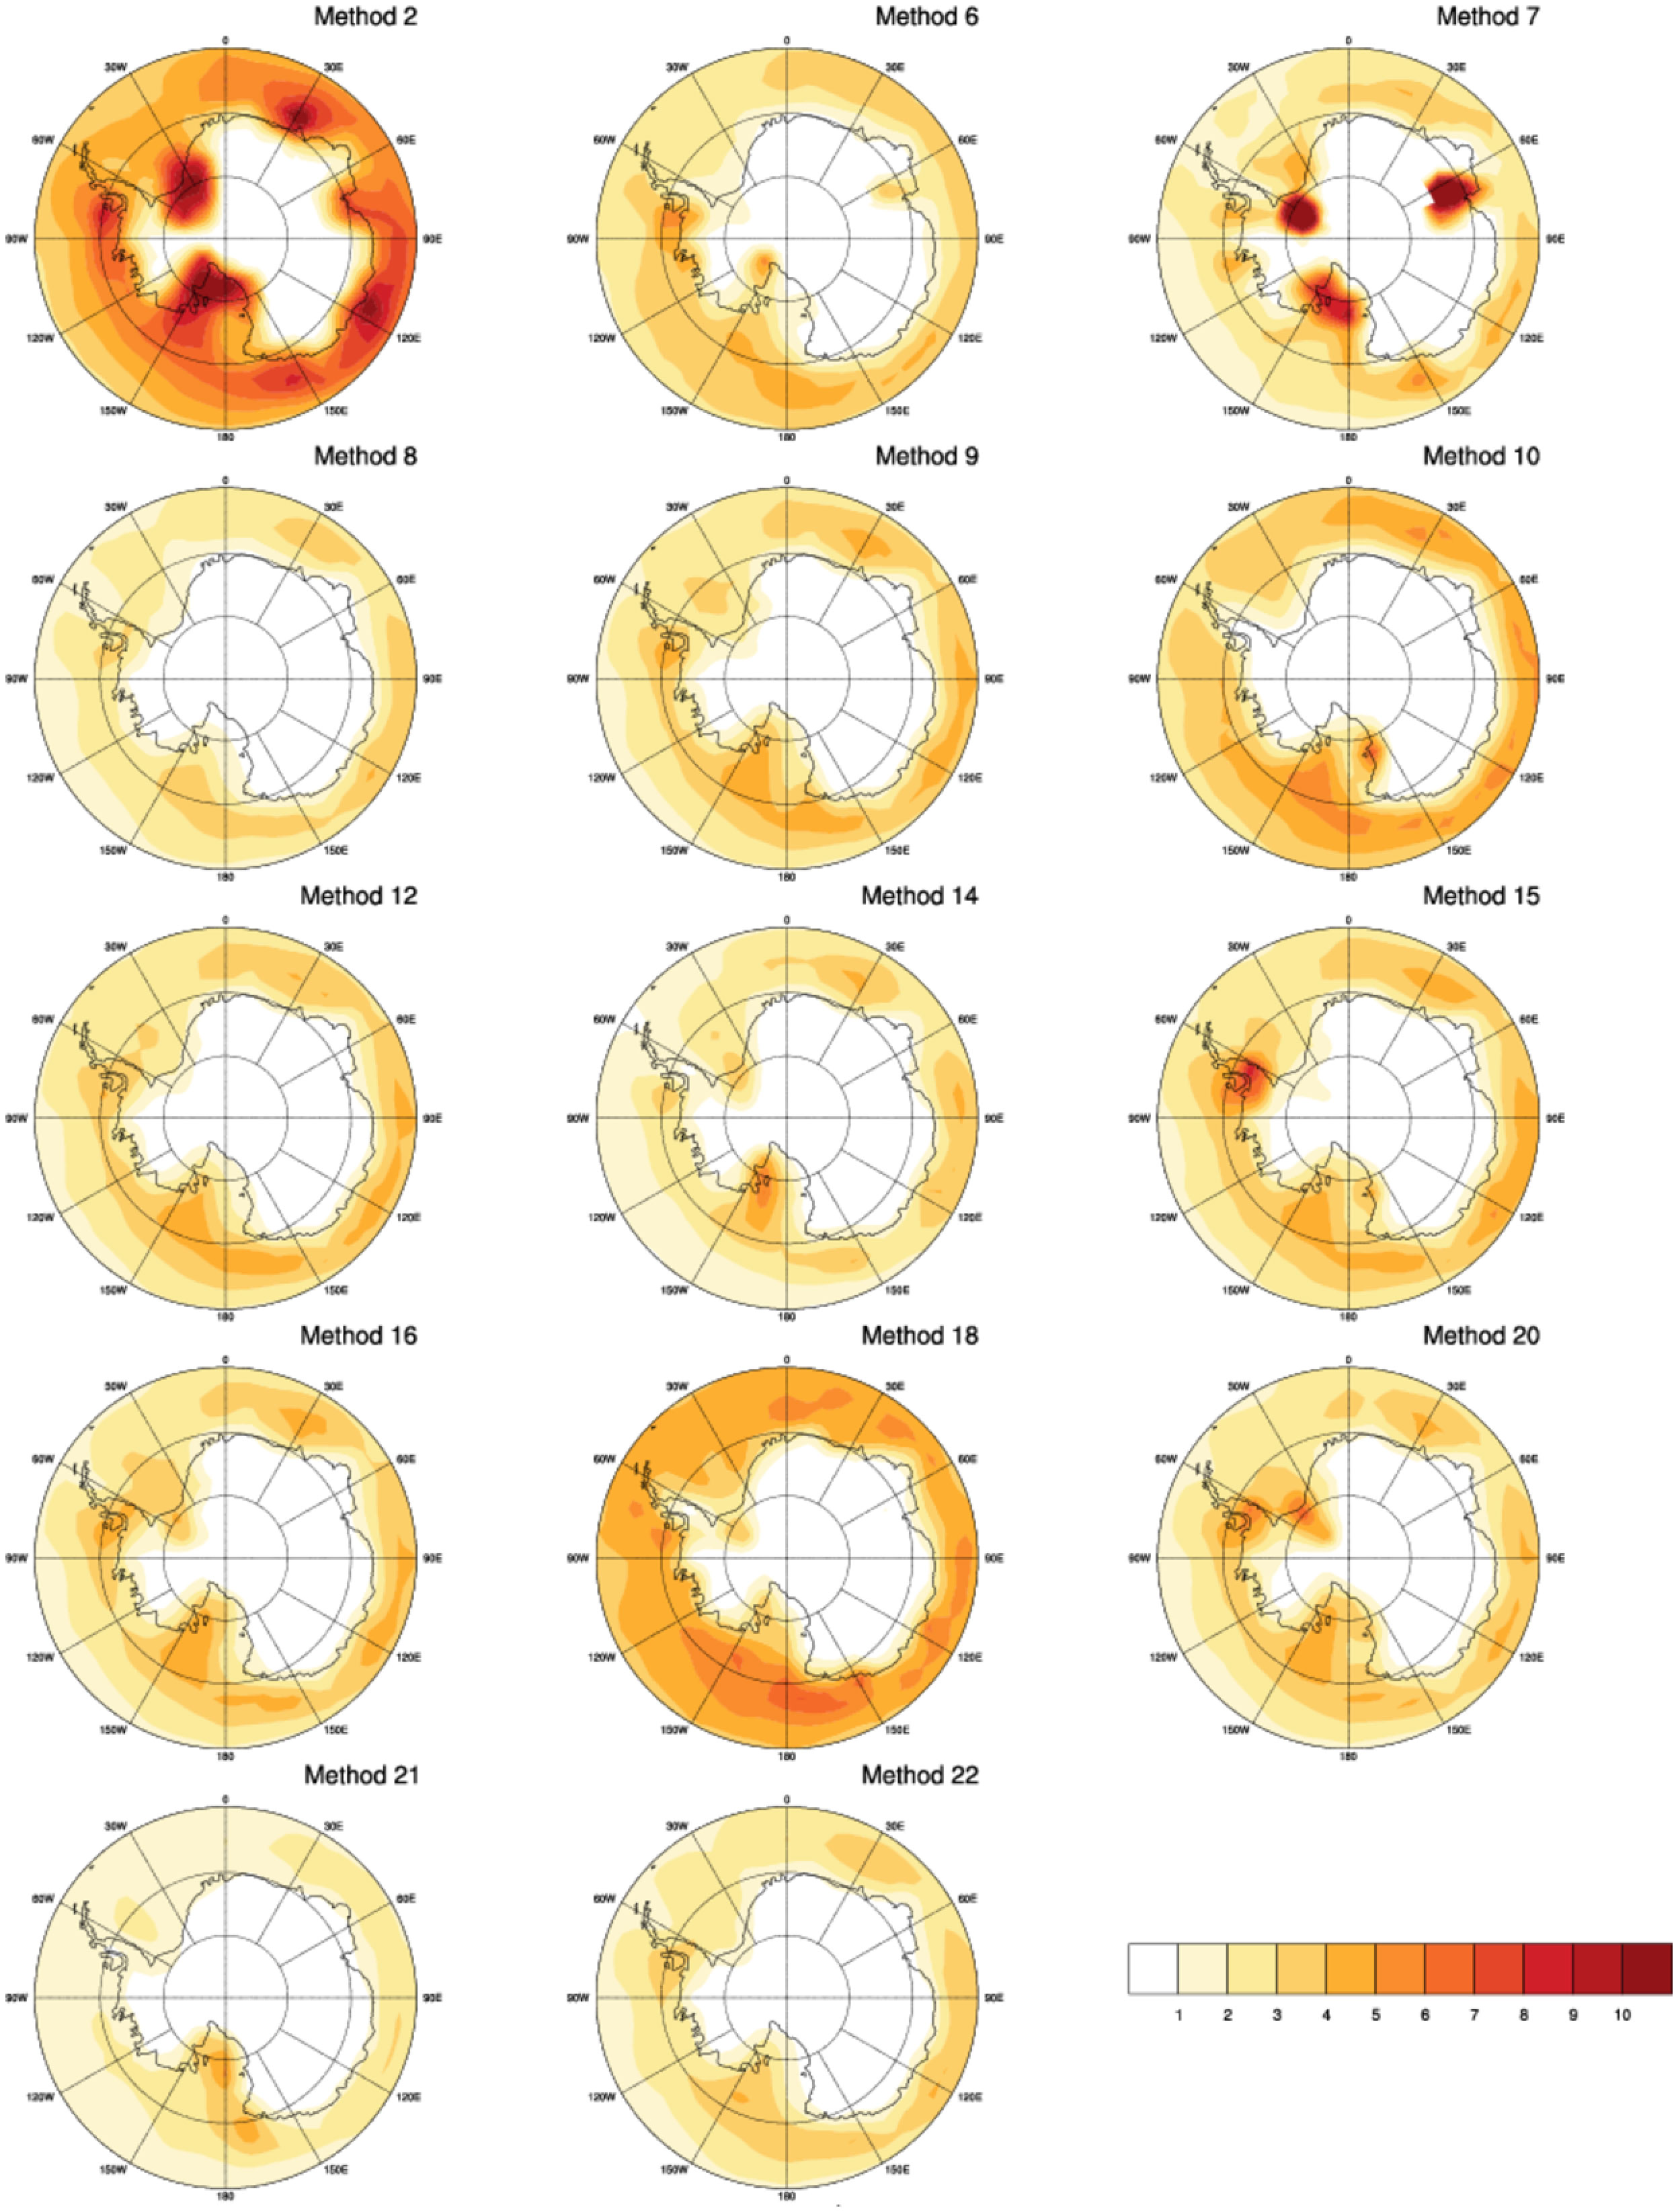
Fig. 4.
System density for winter (JJA) [cyclones per 103(lat)2 area per analysis].
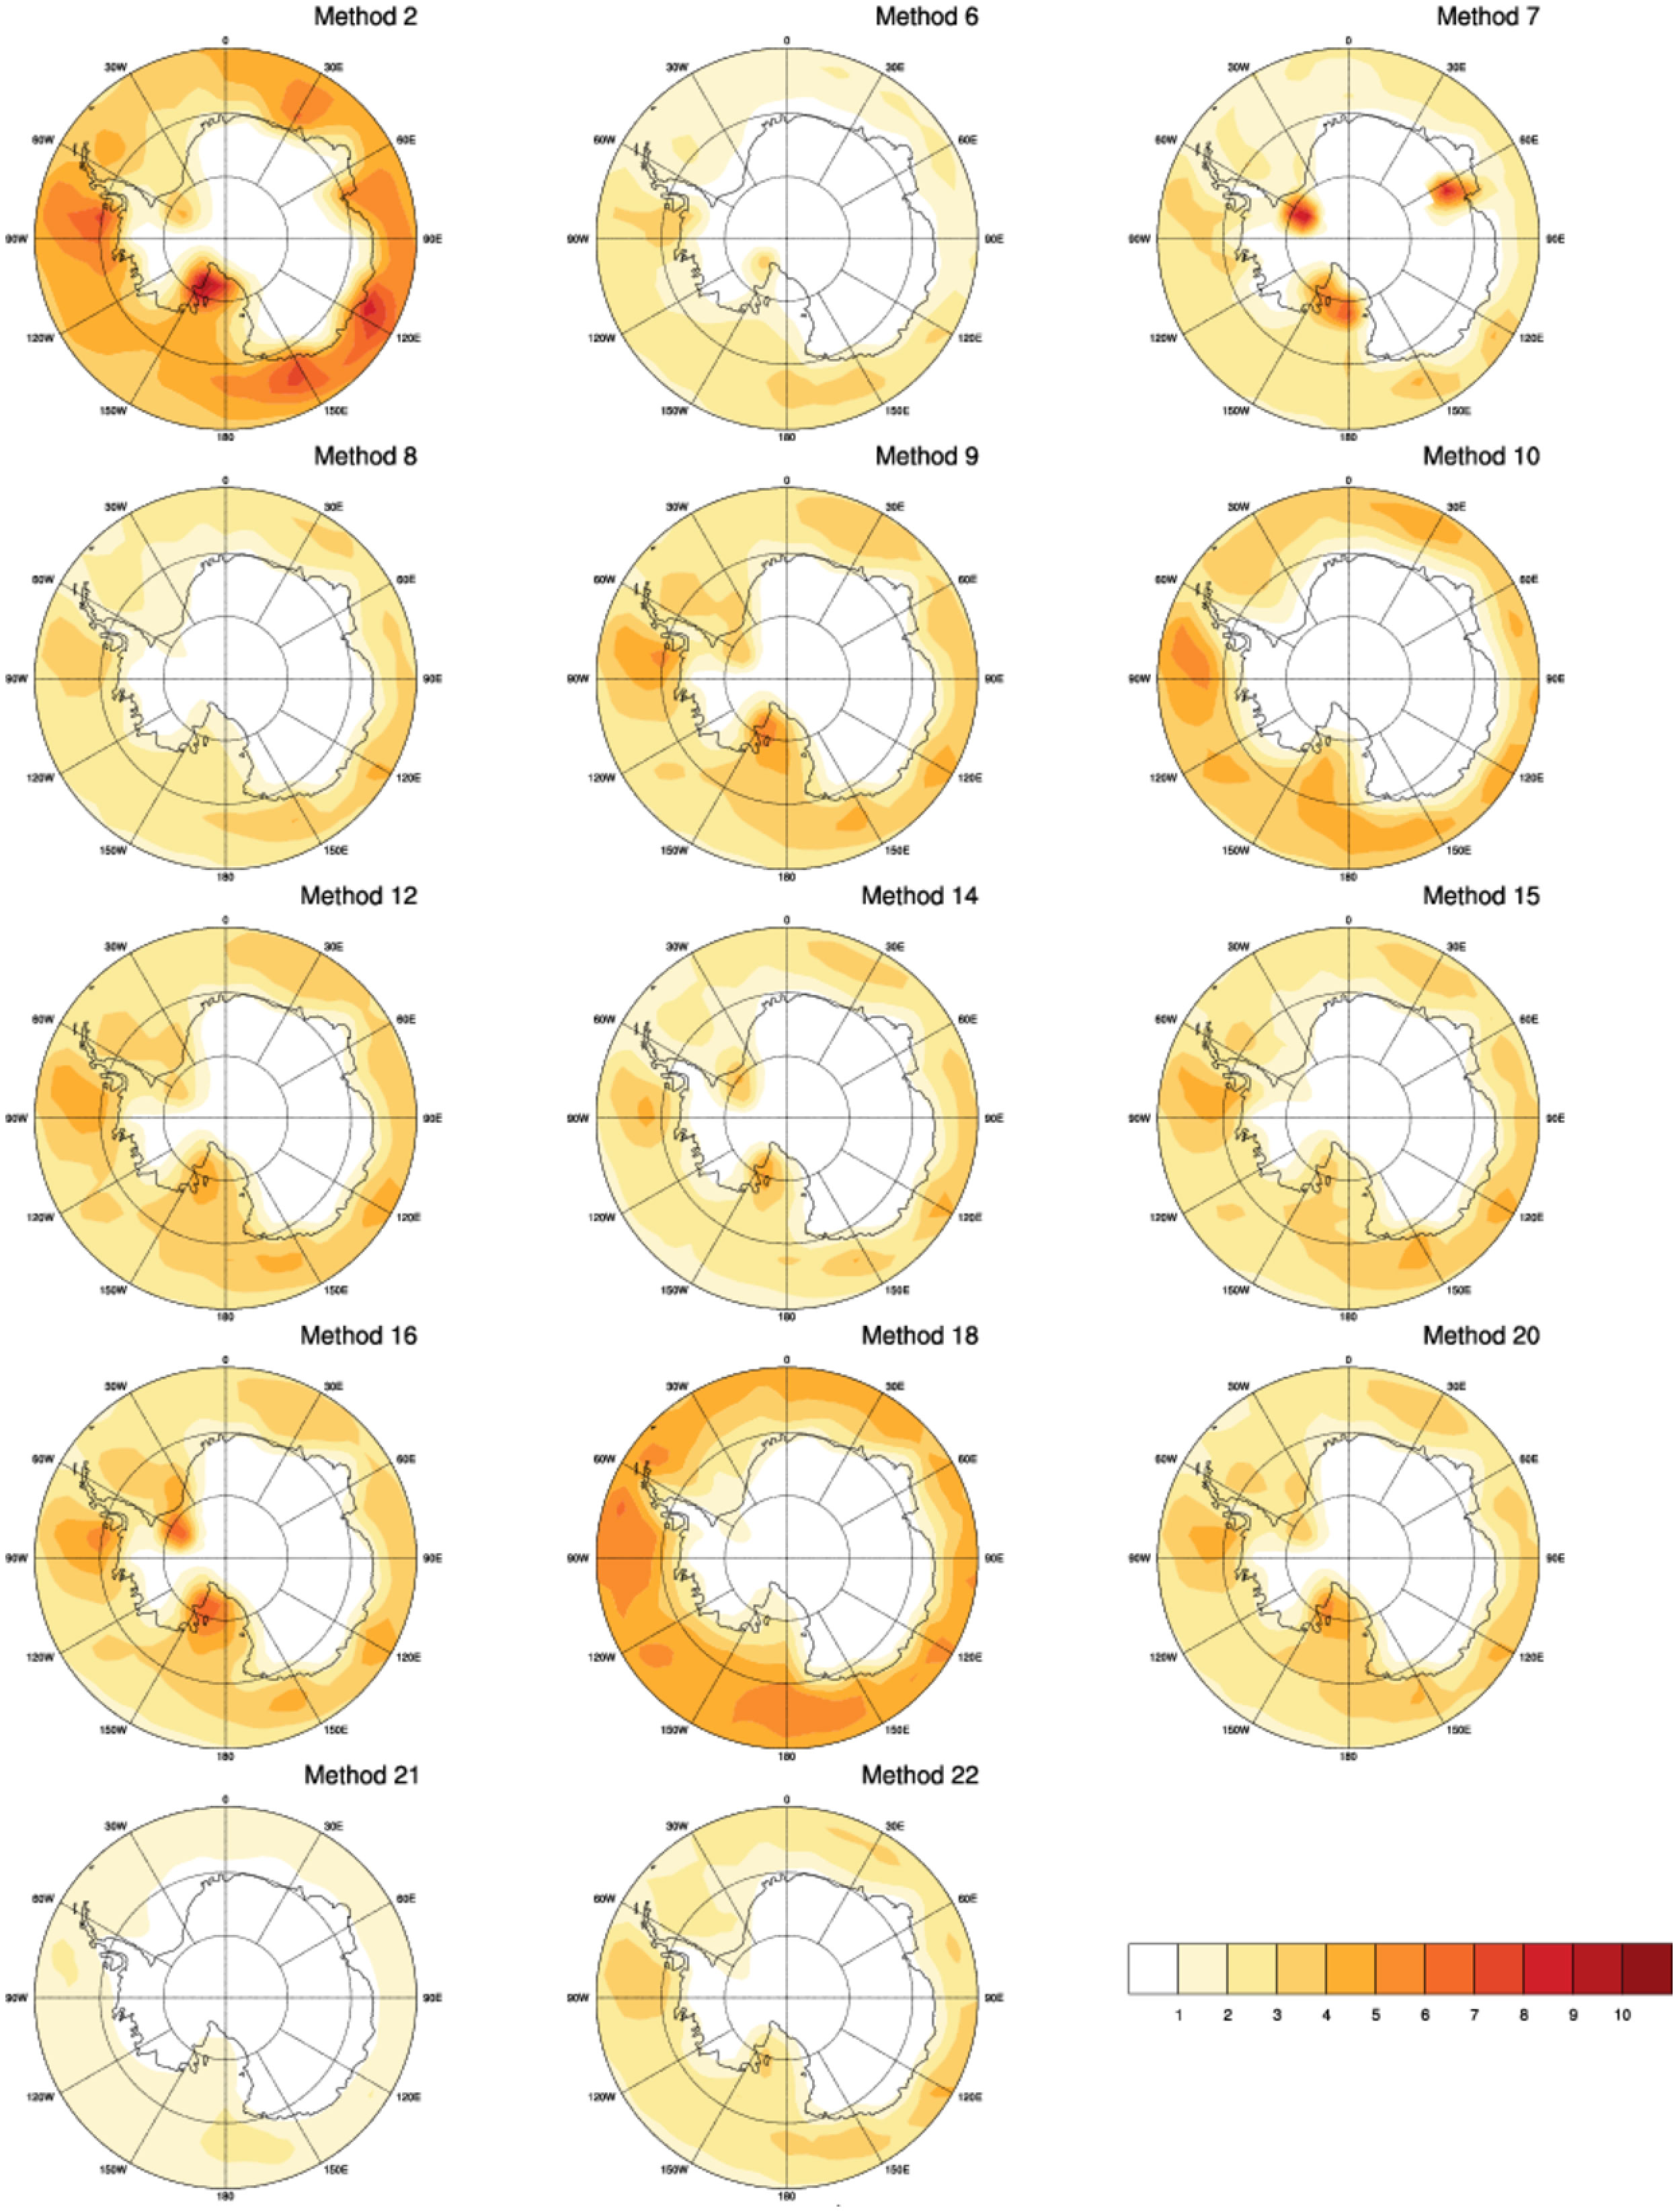
Fig. 5.
As Fig. 3 but for summer (DJF) [cyclones per 103(lat)2 area per analysis].
Table 2.
Number of S60 cyclones for winter (JJA, first column) and summer (DJF, first row) detected by each method, and track agreement between methods for winter (lower left triangular matrix) and summer (top-right triangular matrix). Values denote a nominal percentage agreement (relative to the lower number of tracks produced by the two methods) when both methods detect a track at a similar place and time. Values ≥50% are shaded (blue for winter, red for summer), with medium shading for ≥60%, and dark shading for ≥70%.
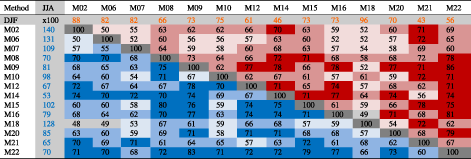
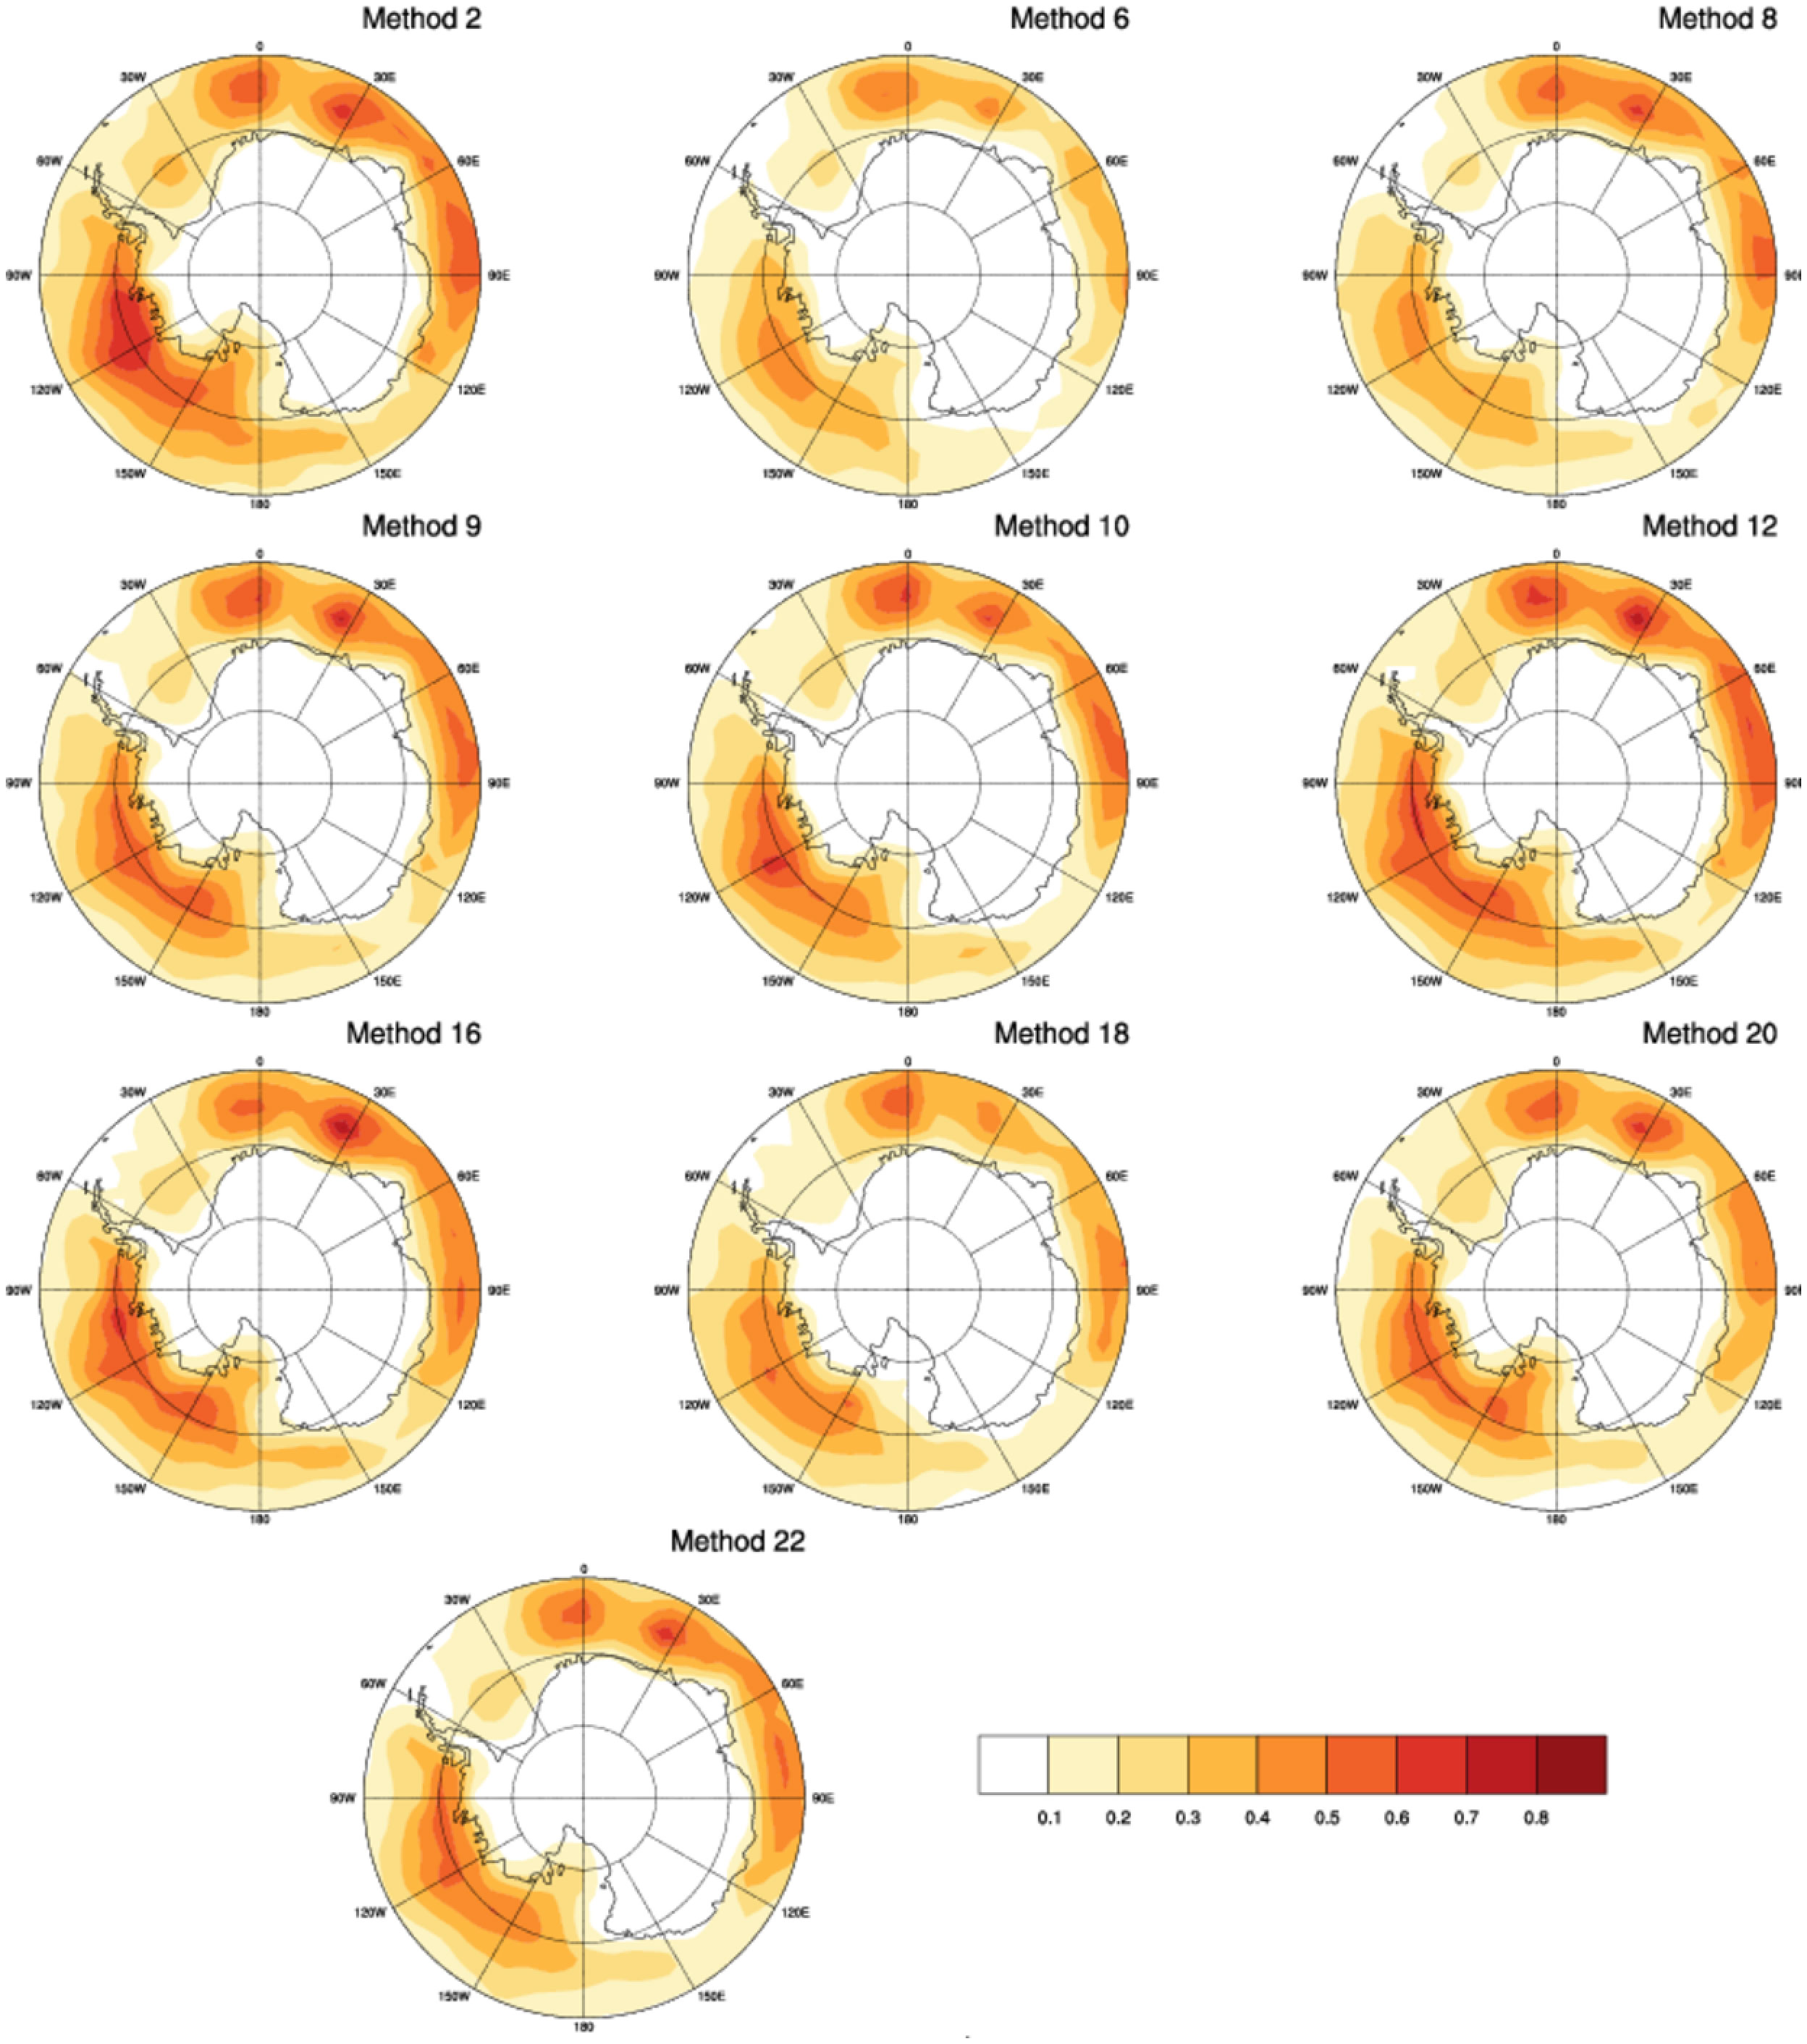
Fig. 6.
As Fig. 3 but for strong cyclones for winter (JJA) [cyclones per 103(lat)2 area per analysis].
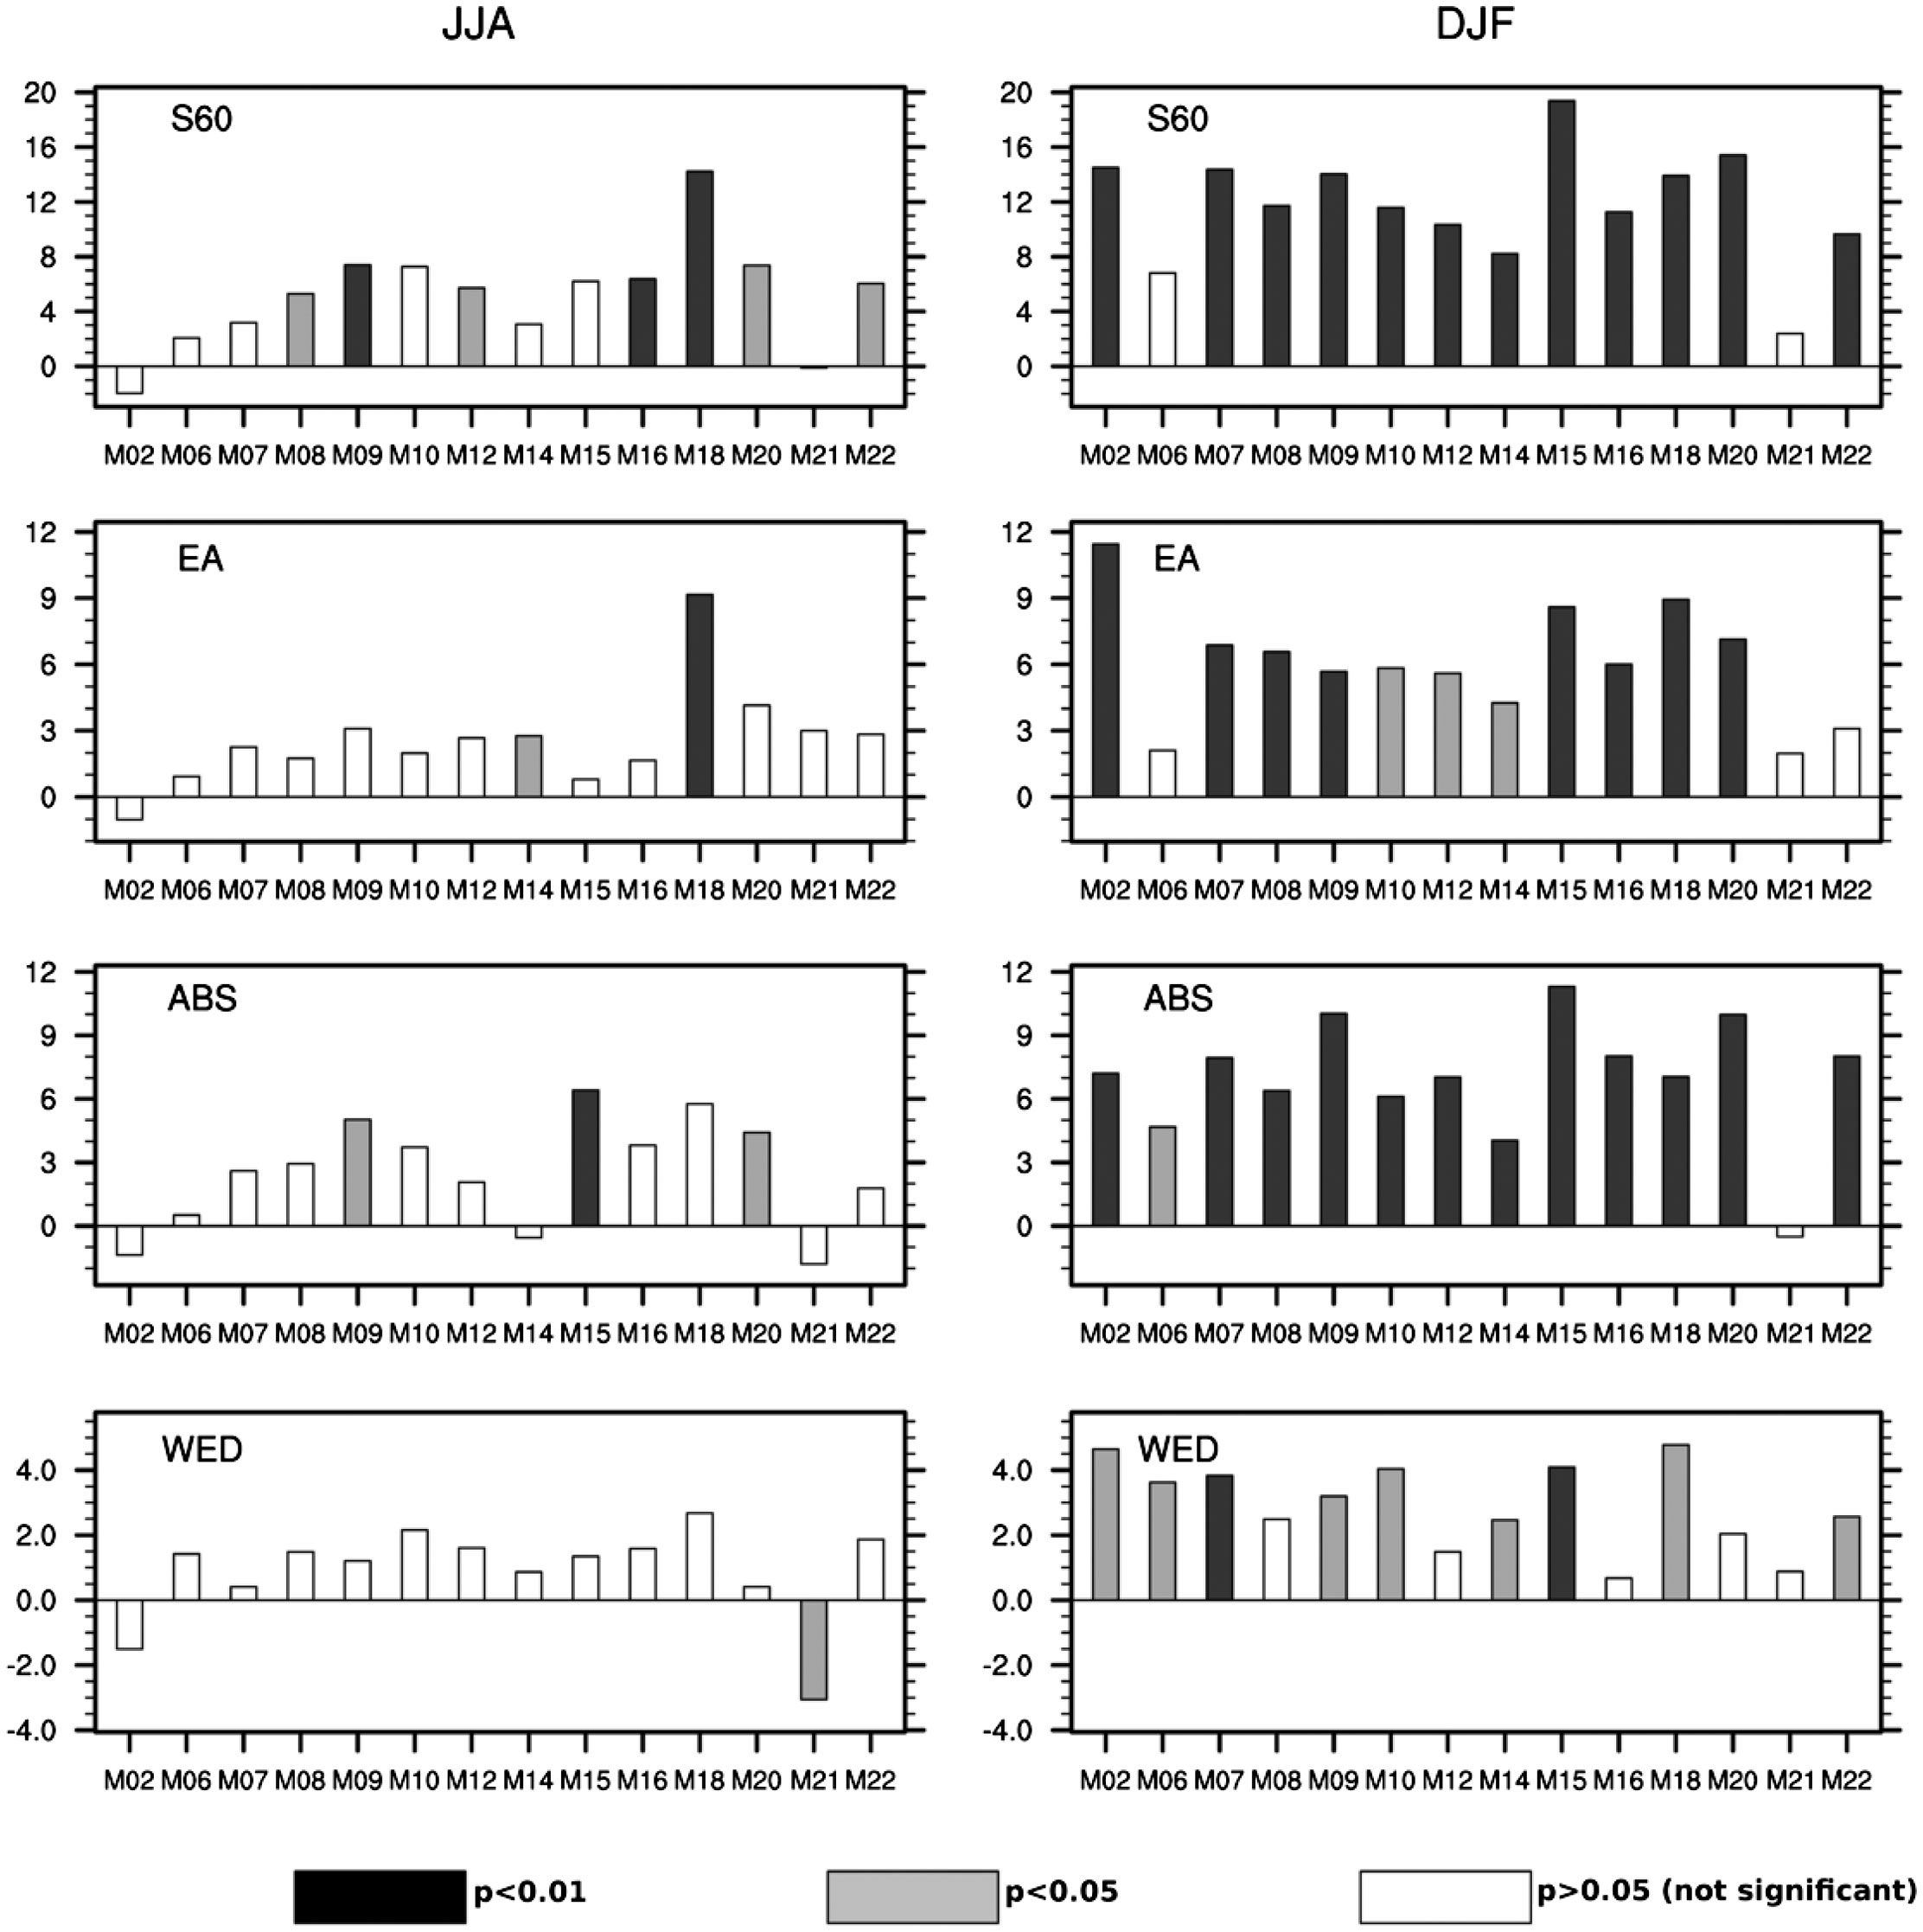
Fig. 7.
Decadal trends in the number of cyclone tracks for the regions S60, EA, WED, ABS, for (left) winter and (right) summer. The trends are calculated over the period 1979–2008.
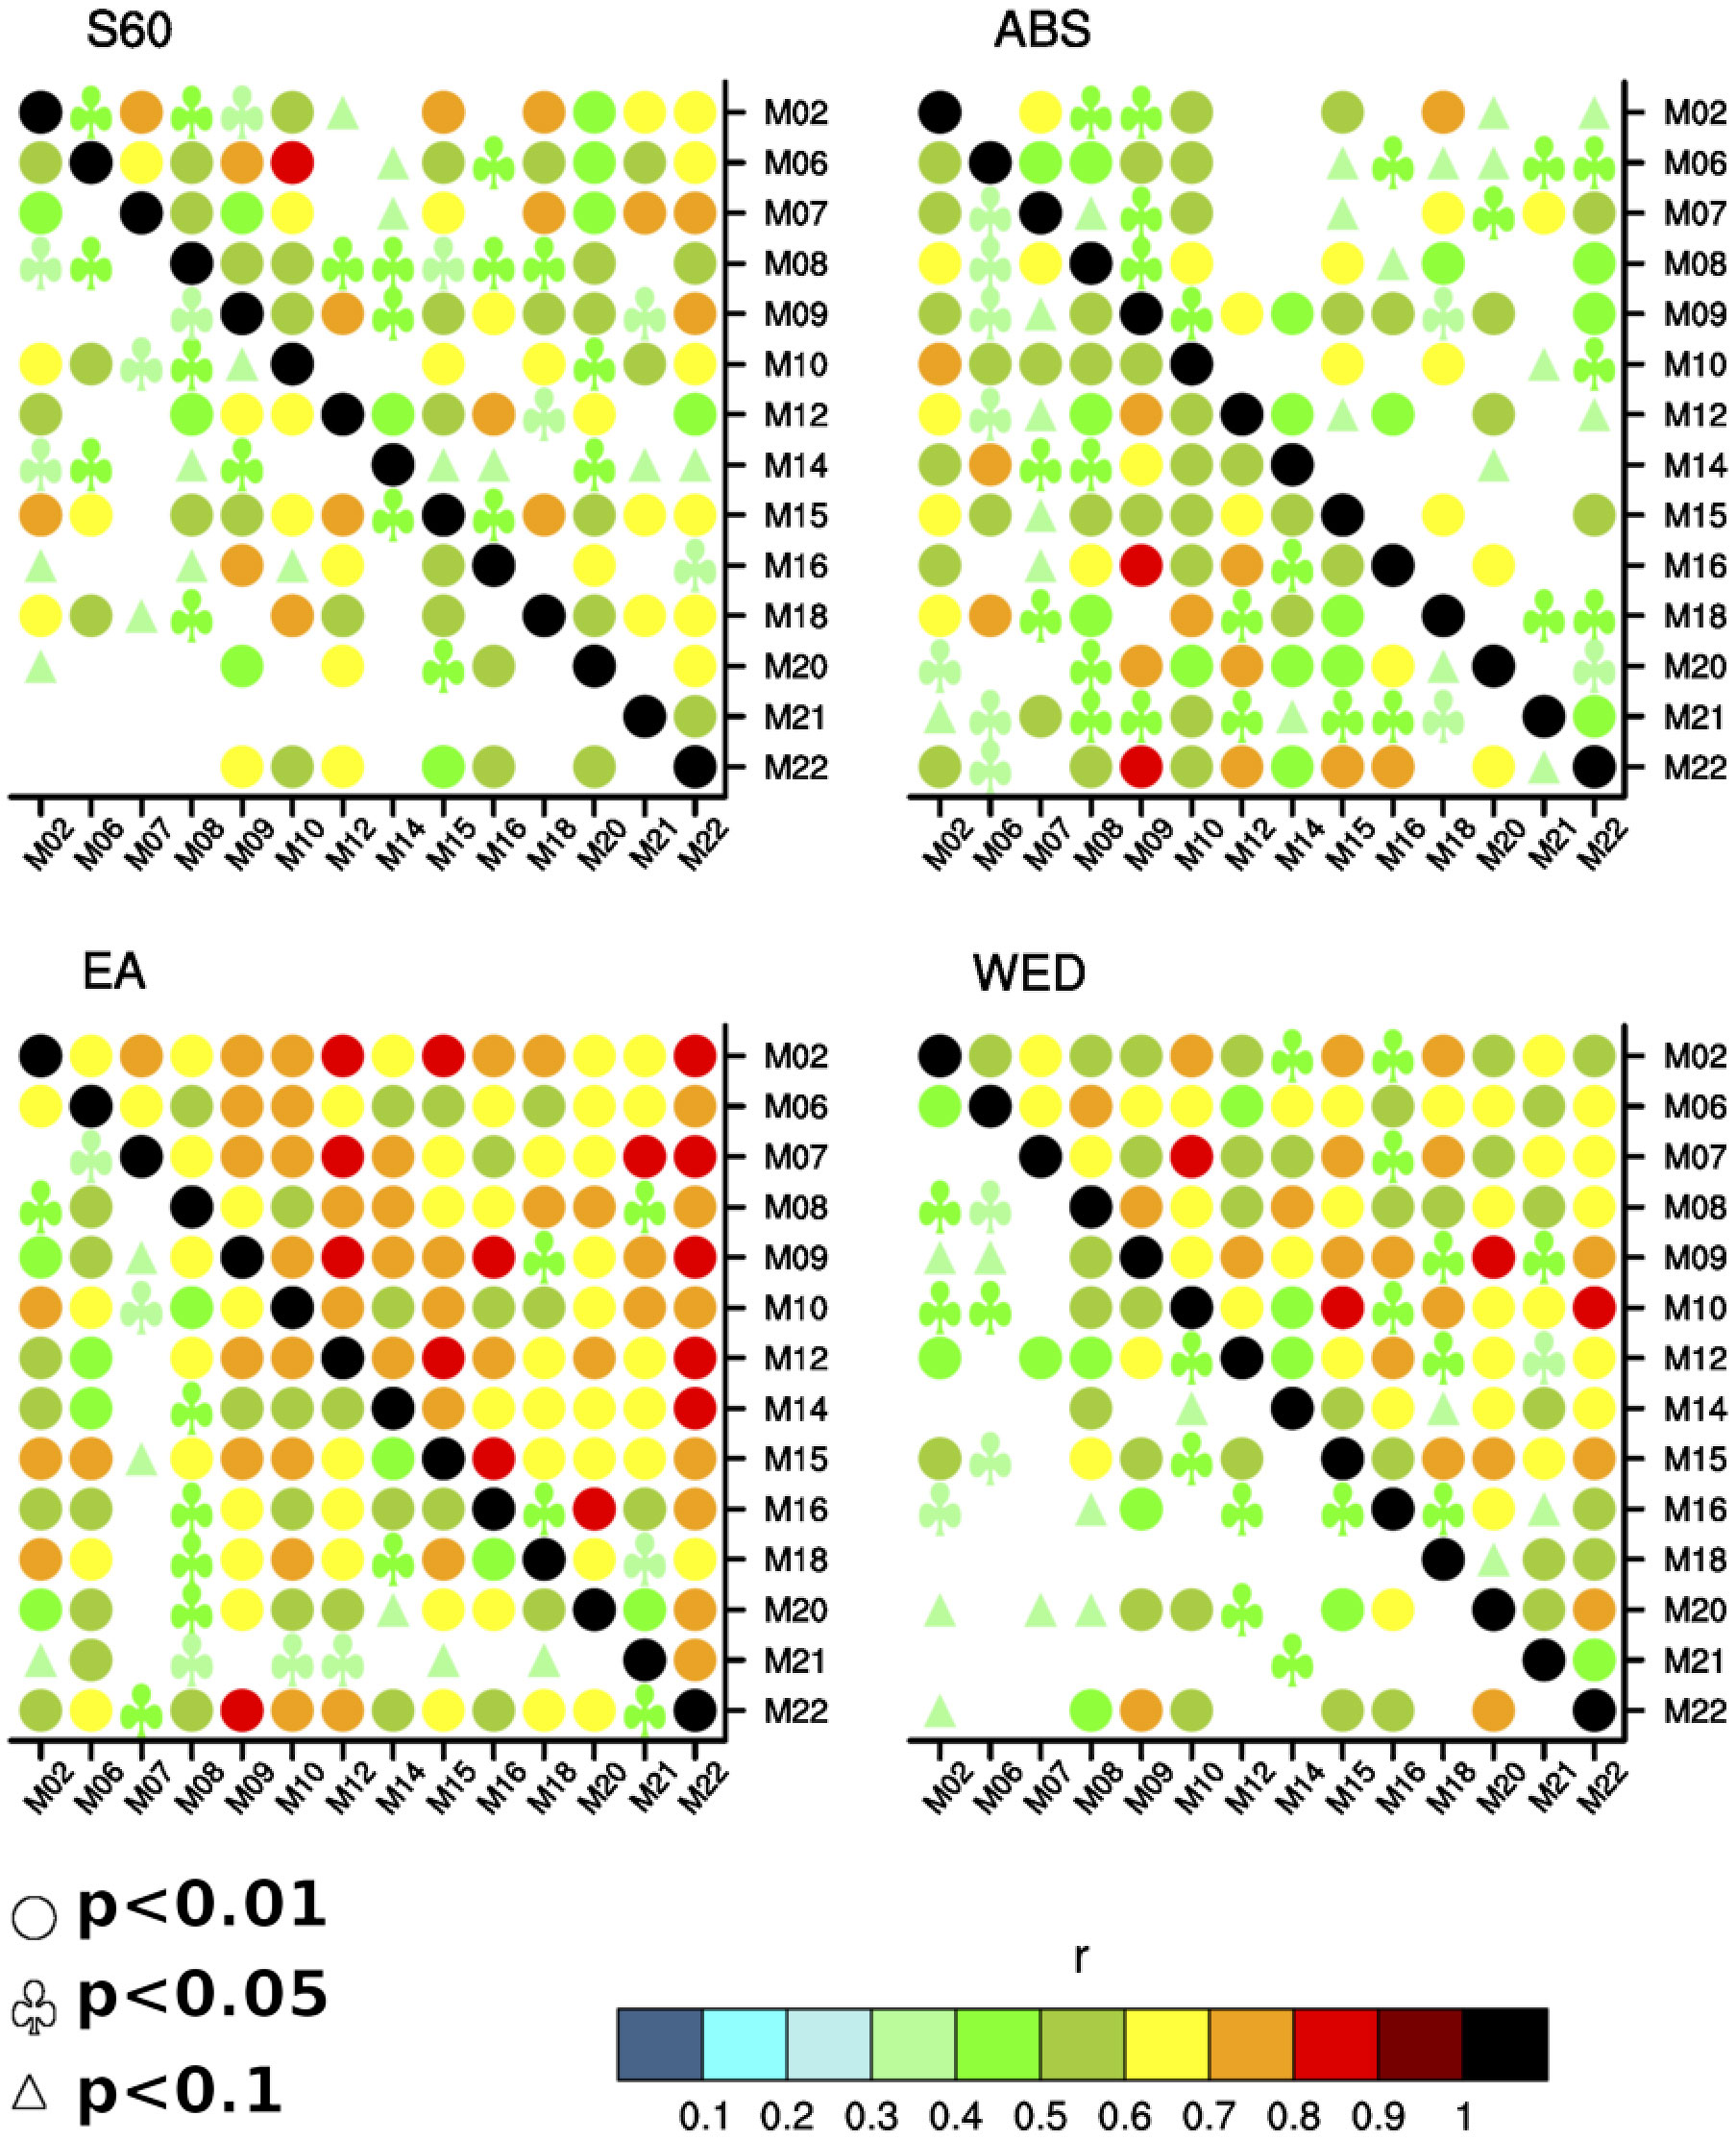
Fig. 8.
Cross correlation of detrended time series of the number of cyclone tracks for the regions S60, EA, WED, ABS for (upper right triangle) summer and (lower left triangle) winter. Symbols denote significance of the correlation. Non-significant values are not shown.
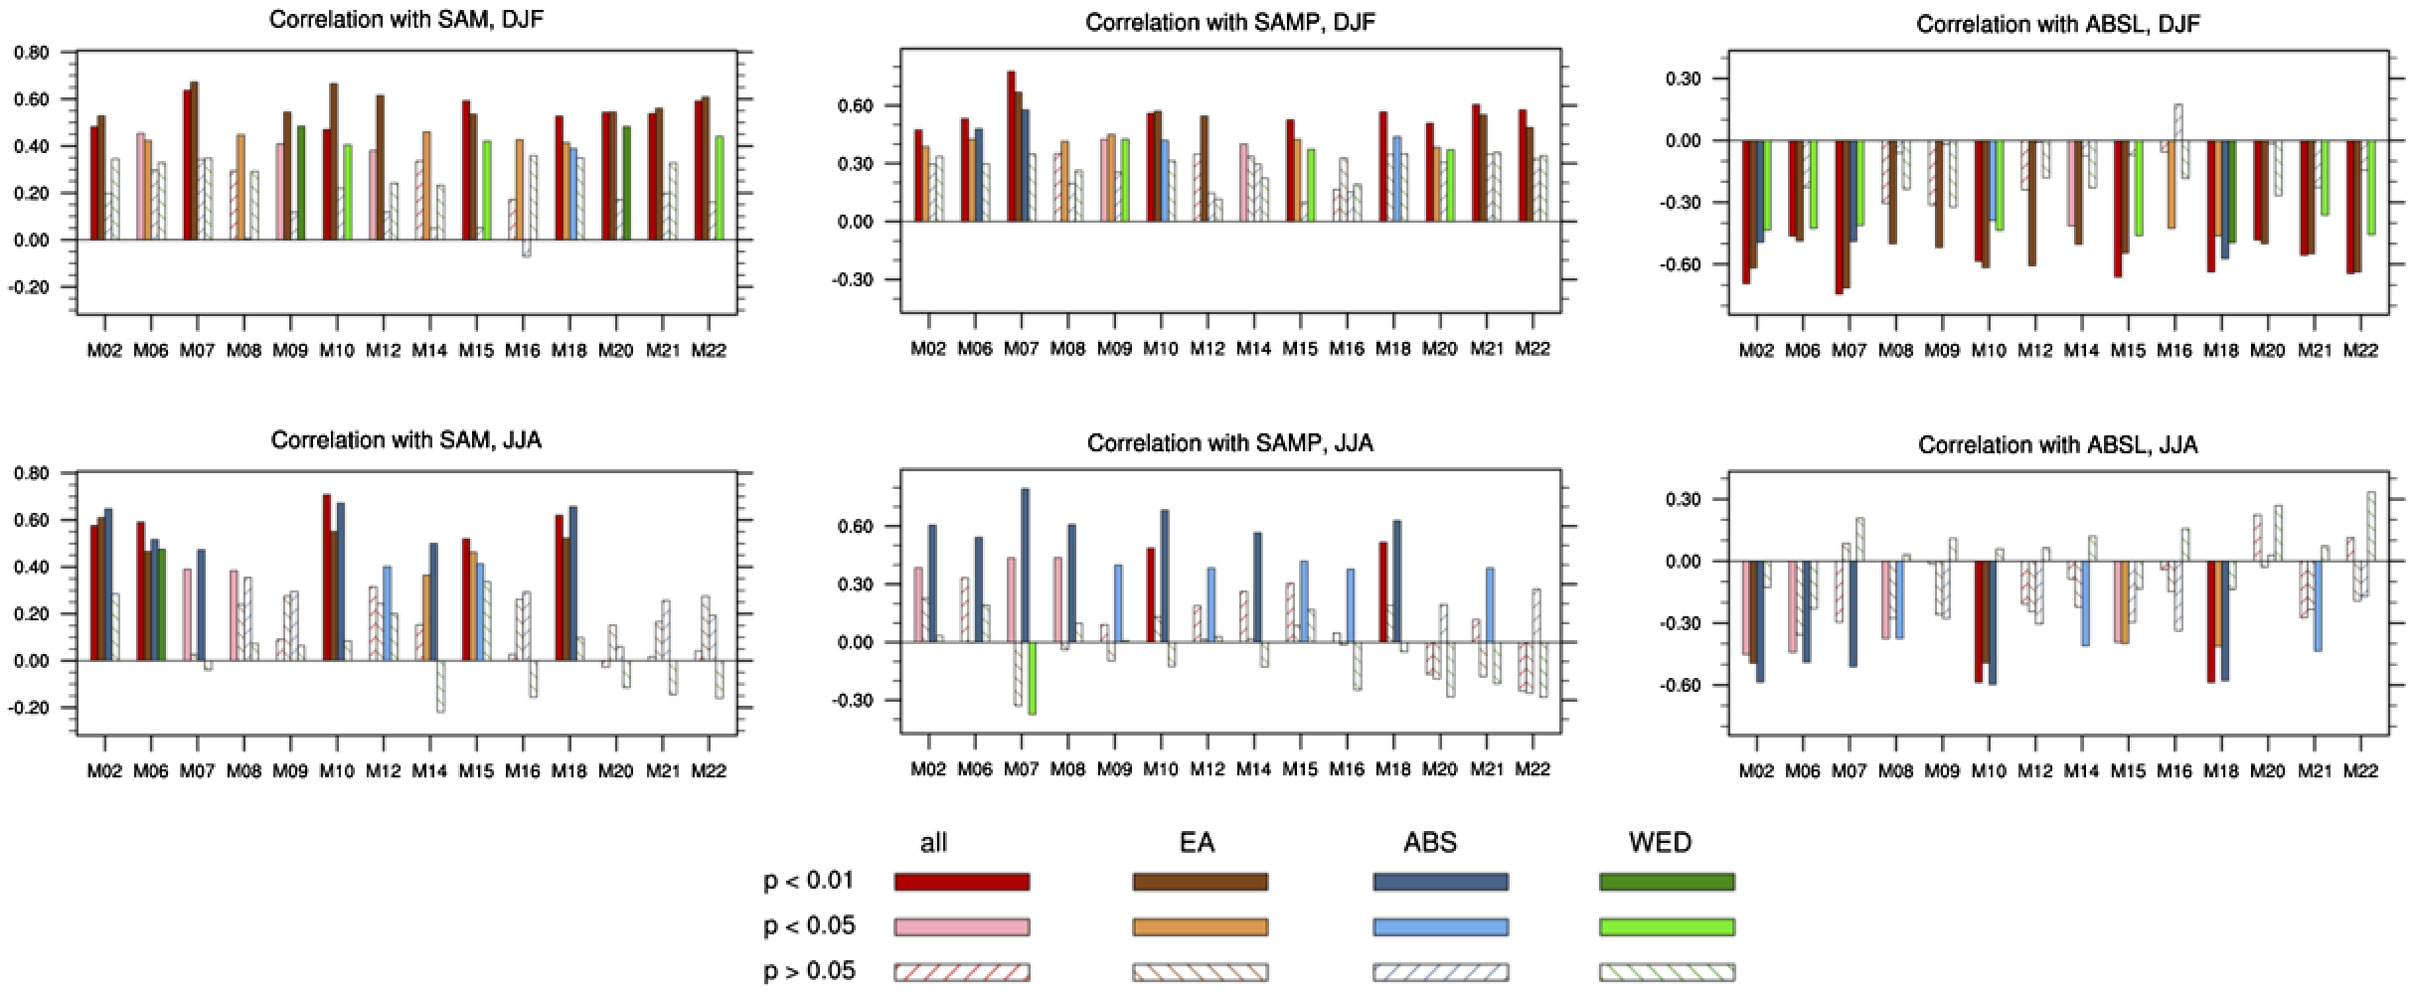
Fig. 9.
Correlation between the number of tracks and the index of SAM, SAMP, ABSL for (upper) summer and (lower) winter.
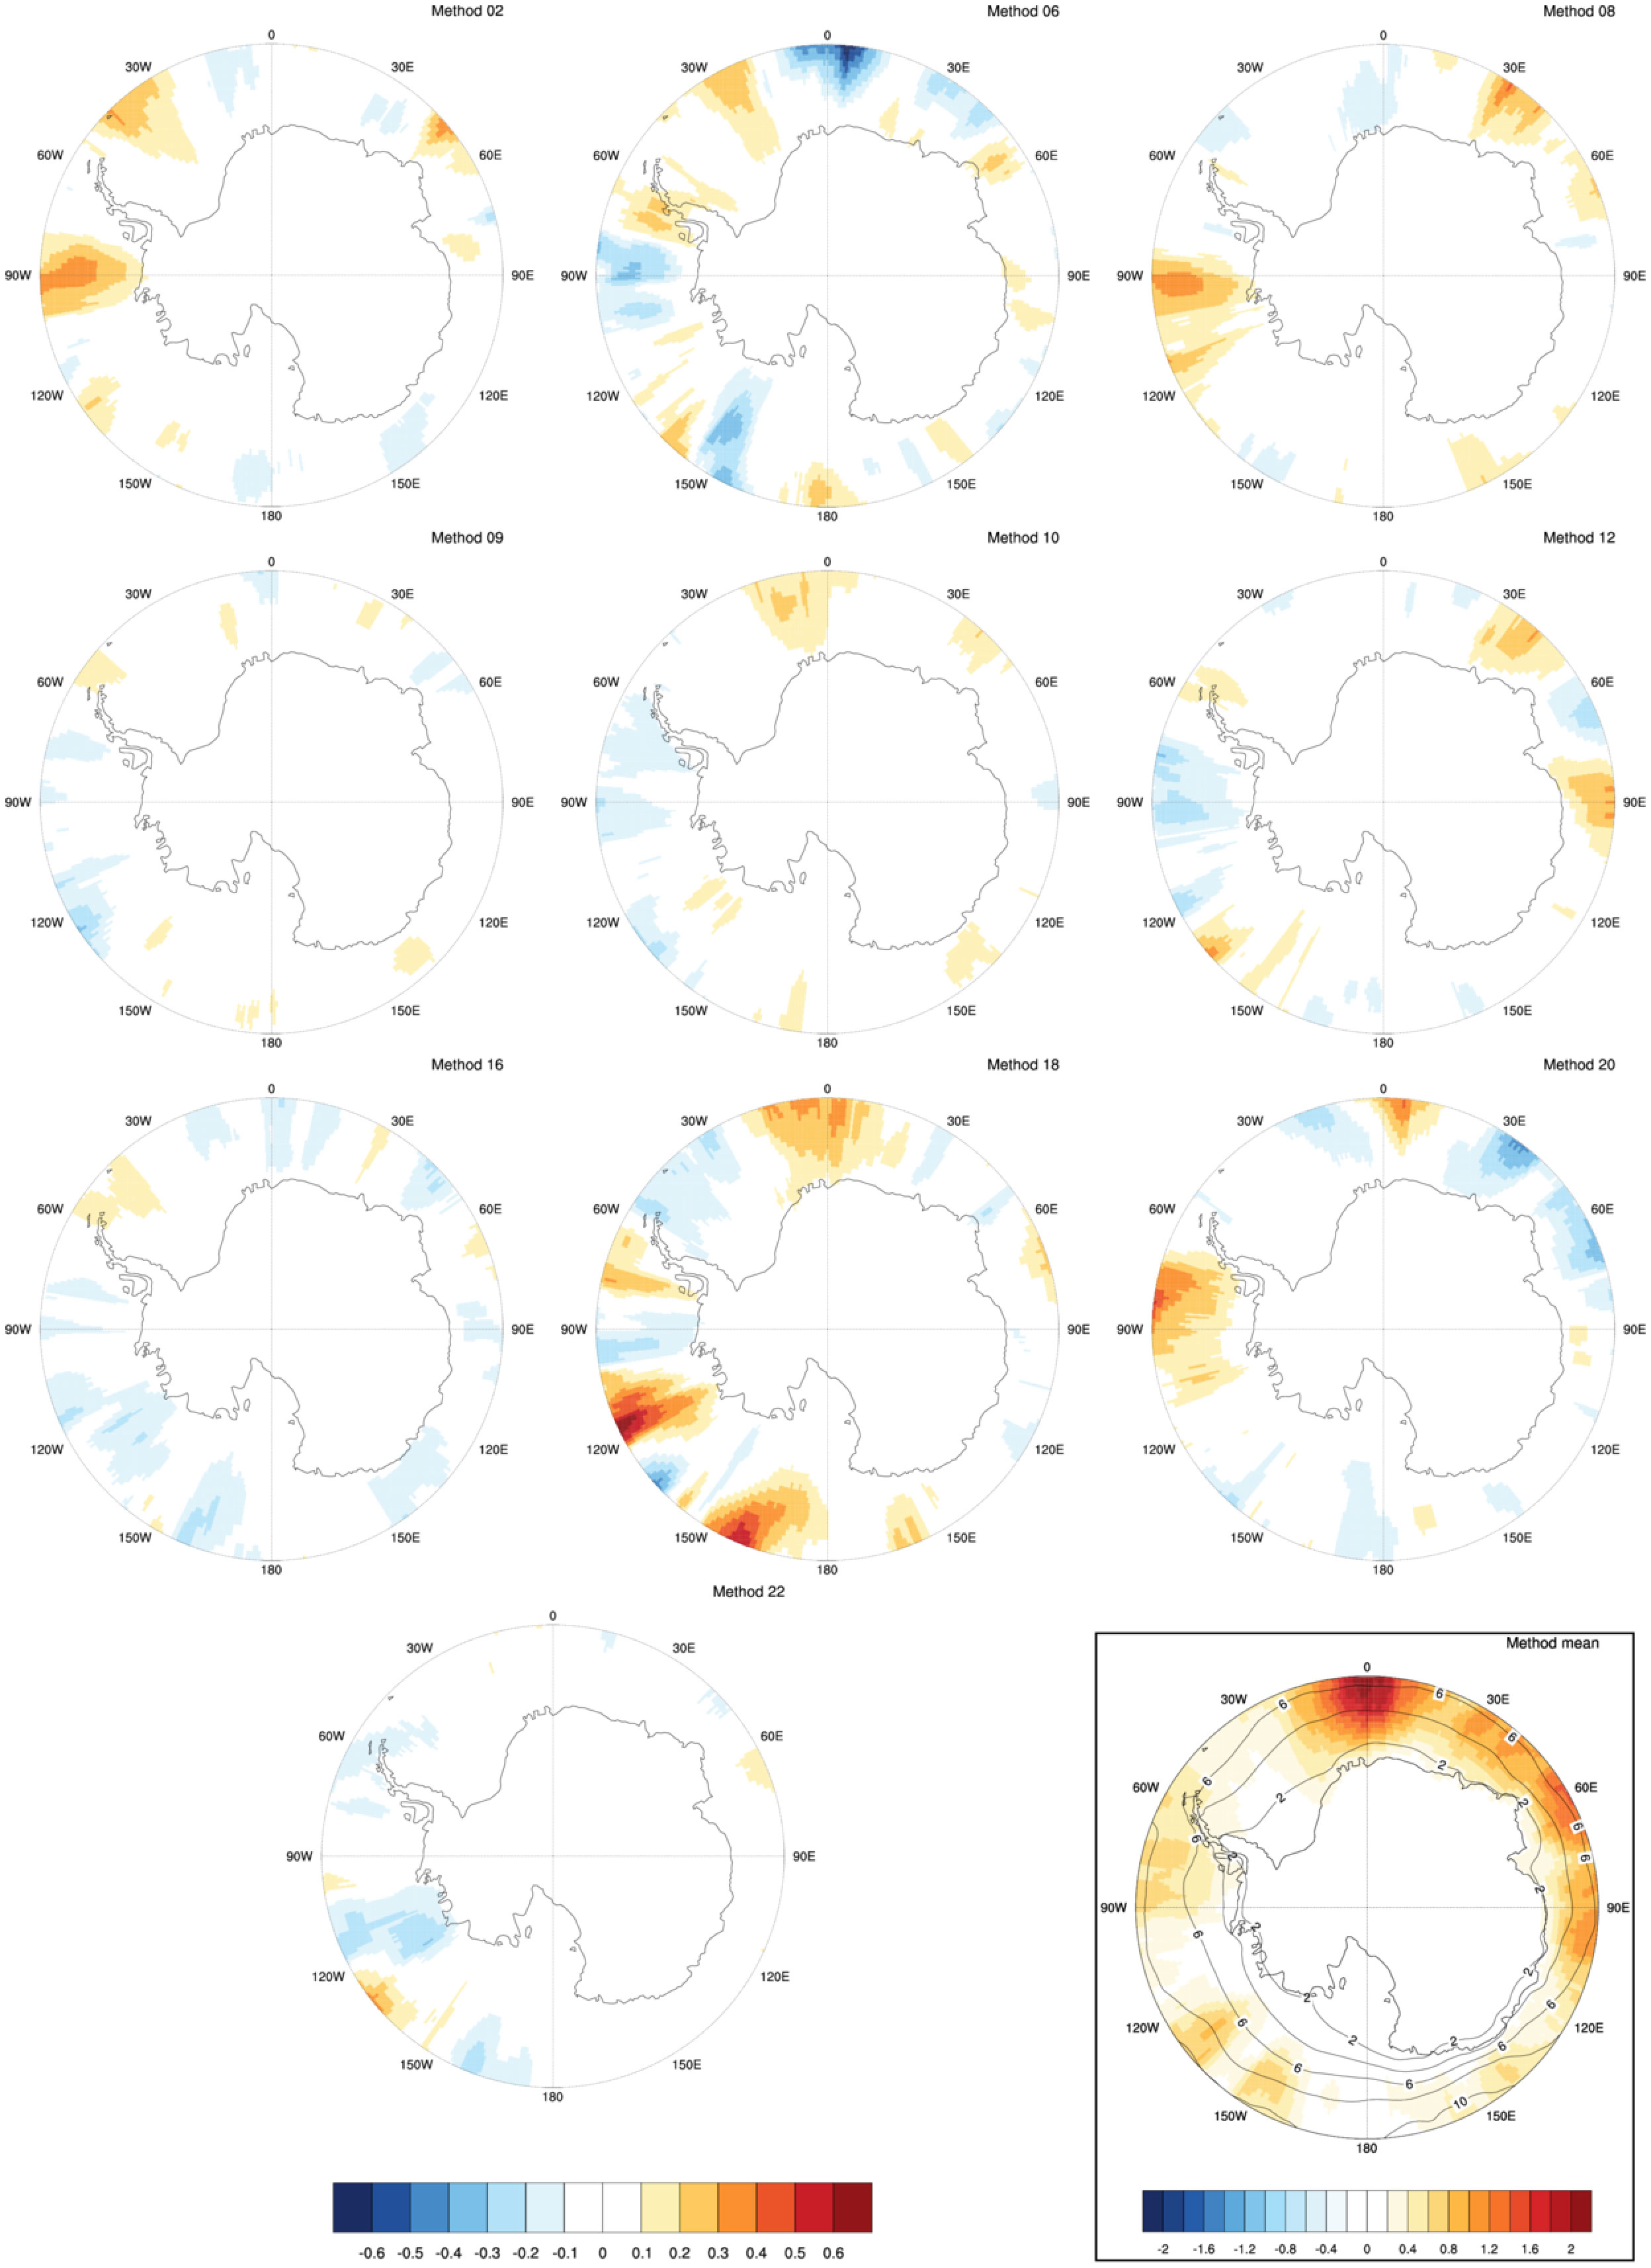
Fig. 10.
Composite of transient meridional moisture flux anomaly [kgm−1 s−1] for all days where the maximum intensity of strong winter (JJA) cyclones is identified (bottom box) for the method mean. Moisture flux is calculated in a 60° longitudinal sector around cyclone center. Flux anomalies (color shadings) are calculated with respect to the long term (1979–2008) mean for JJA (contour lines). Each method panel shows the flux deviation w.r.t. to the method mean. Note the different color bar for the method mean and the deviations of the mean. Poleward moisture flux is defined to be positive.