
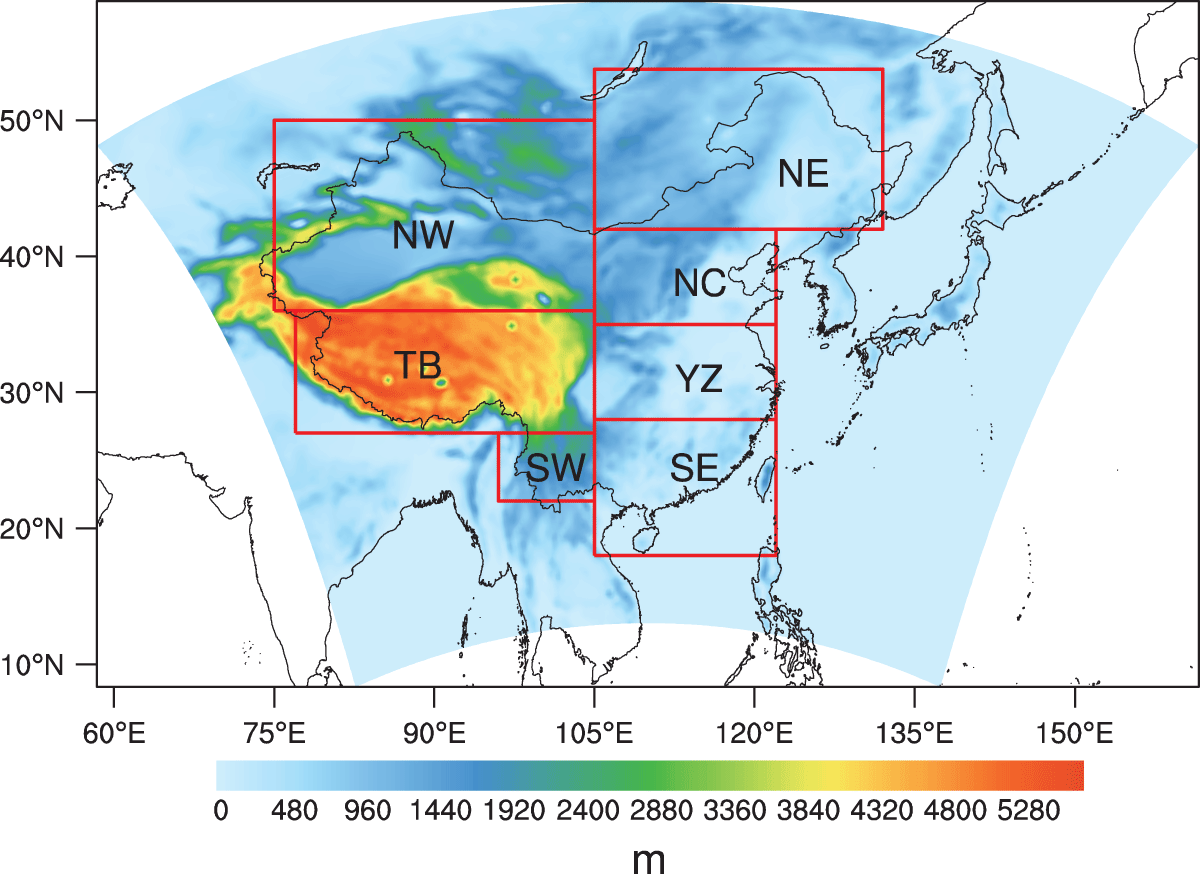
Fig. 1.
Model domain and topography (units: m) over china. Boxes represent the selected regions: Northeast China (NE), North China (NC), Yangtze River (YZ), Southeast China (SE), Northwest China (NW), Tibetan Plateau (TB) and Southwest China (SW).
Table 1.
Indicator, acronym and definition of three precipitation extreme indices used in the study.
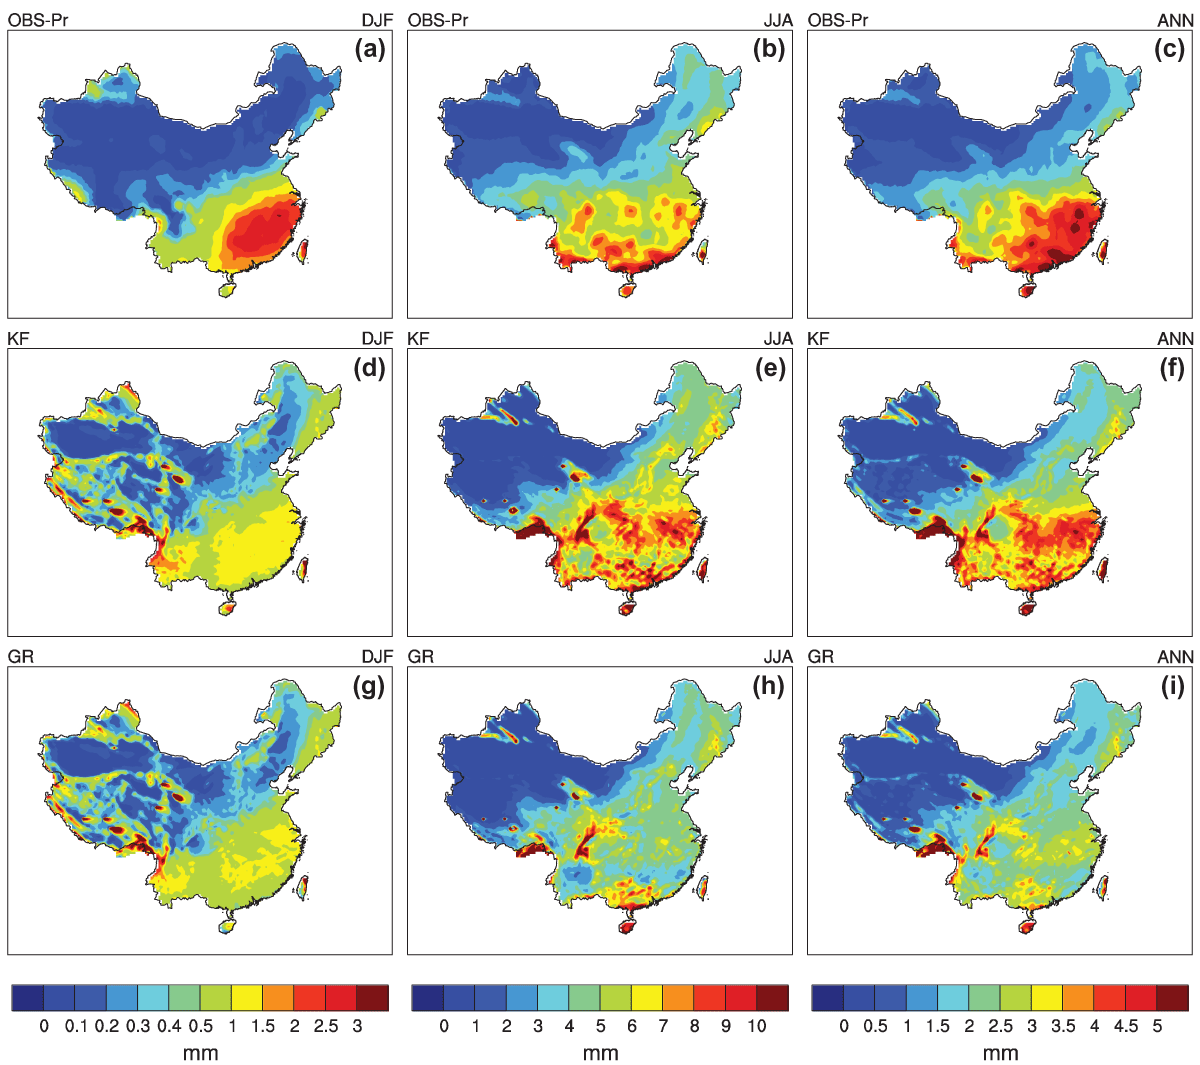
Fig. 2.
Spatial distributions of seasonal mean (DJF (a, d, g), JJA (b, e, h), ANN (c, f, i)) precipitation (units: mm) during 1982–2004 from observation (a–c), WRF model with Kain–Fritsch (d–f) and Grell (g–i) cumulus schemes. Note that the colourbar scales are different.
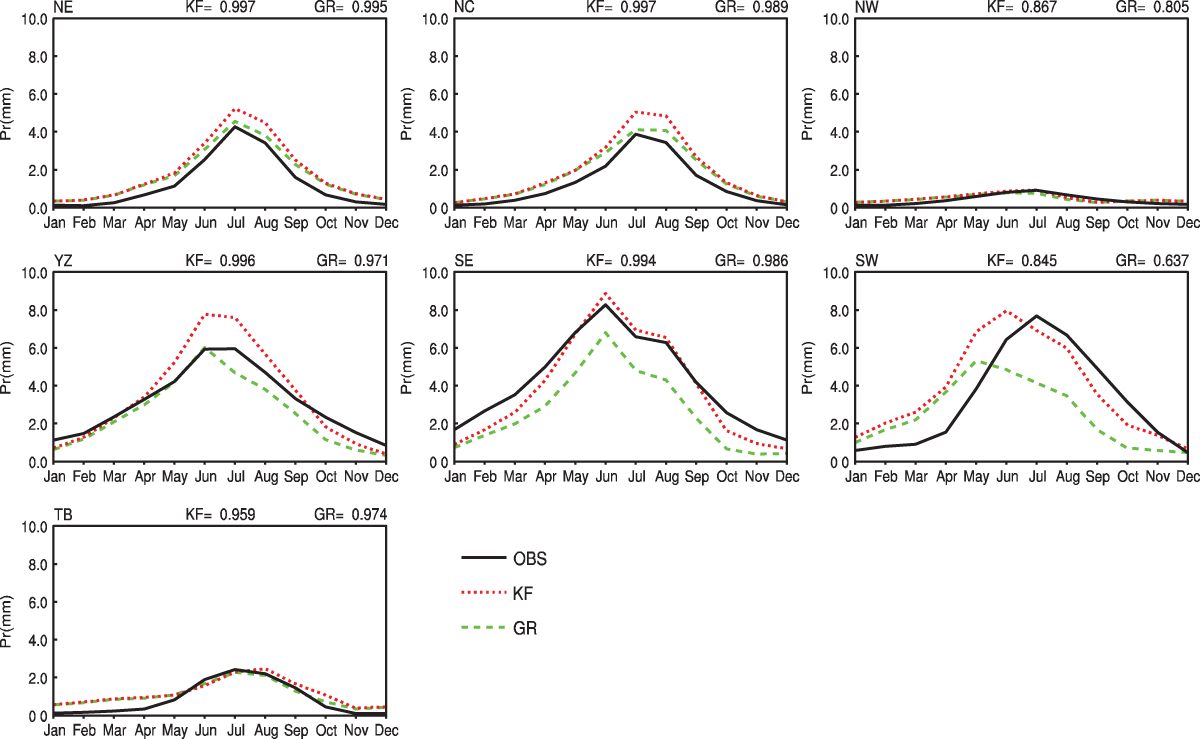
Fig. 3.
Annual cycle of precipitation (units: mm) over sub-regions during 1982–2004 from observation (solid black line), and WRF model with Kain–Fritsch (dotted red line) and Grell cumulus (dashed green line) schemes. The annual cycle correlation coefficients of the result of Kain–Fritsch and Grell cumulus schemes with observation are labelled at the top of each panel.
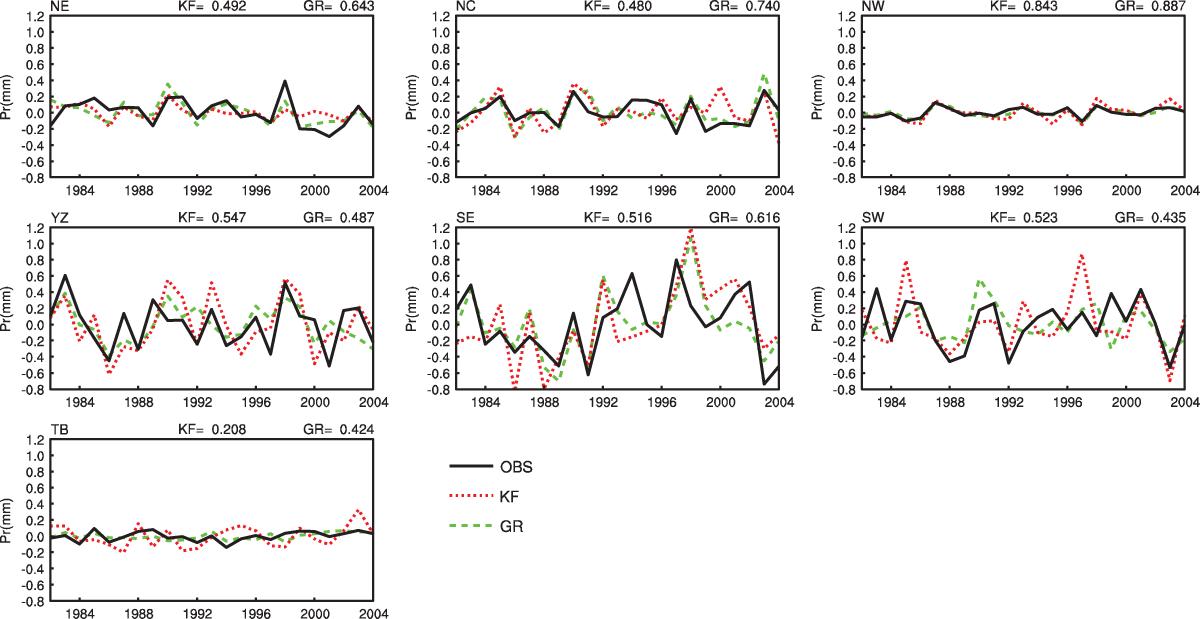
Fig. 4.
Interannual anomalies of area averaged summer precipitation (units: mm) over sub-regions during 1982–2004 from observation (solid black line), and WRF model with Kain–Fritsch (dotted red line) and Grell cumulus (dashed green line) schemes. The interannual correlation coefficients of the result of Kain–Fritsch and Grell cumulus schemes with observation are labelled at the top of each panel.
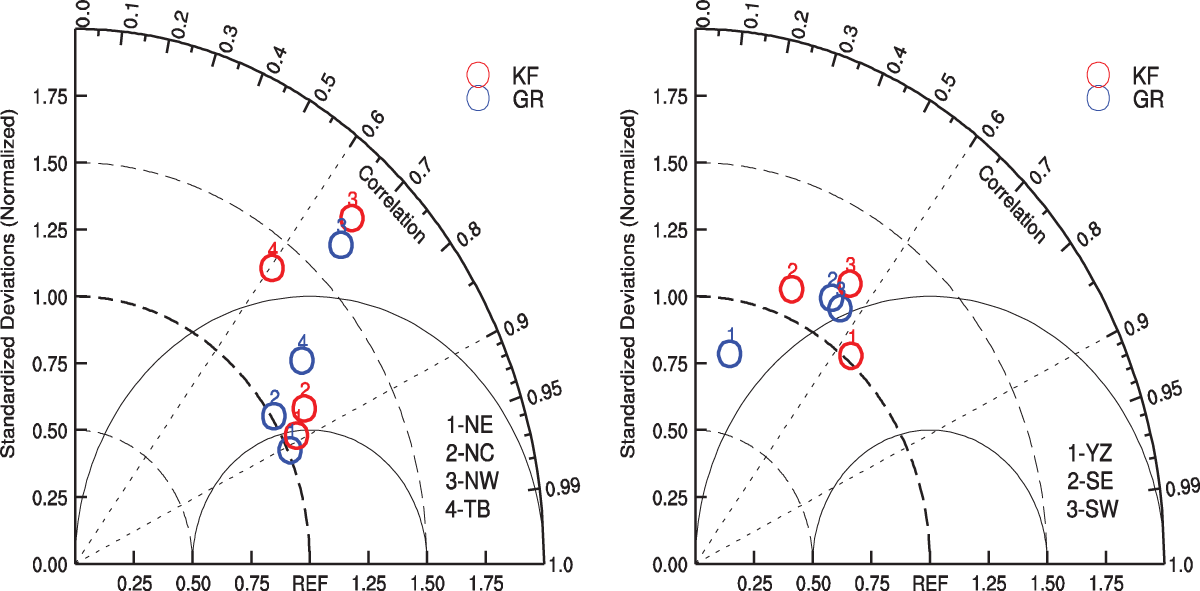
Fig. 5.
Taylor diagrams for the summer mean precipitation over dry (left panel) and wet (right panel) regions from WRF model with Kain–Fritsch (red circles) and Grell (blue circles) cumulus schemes.
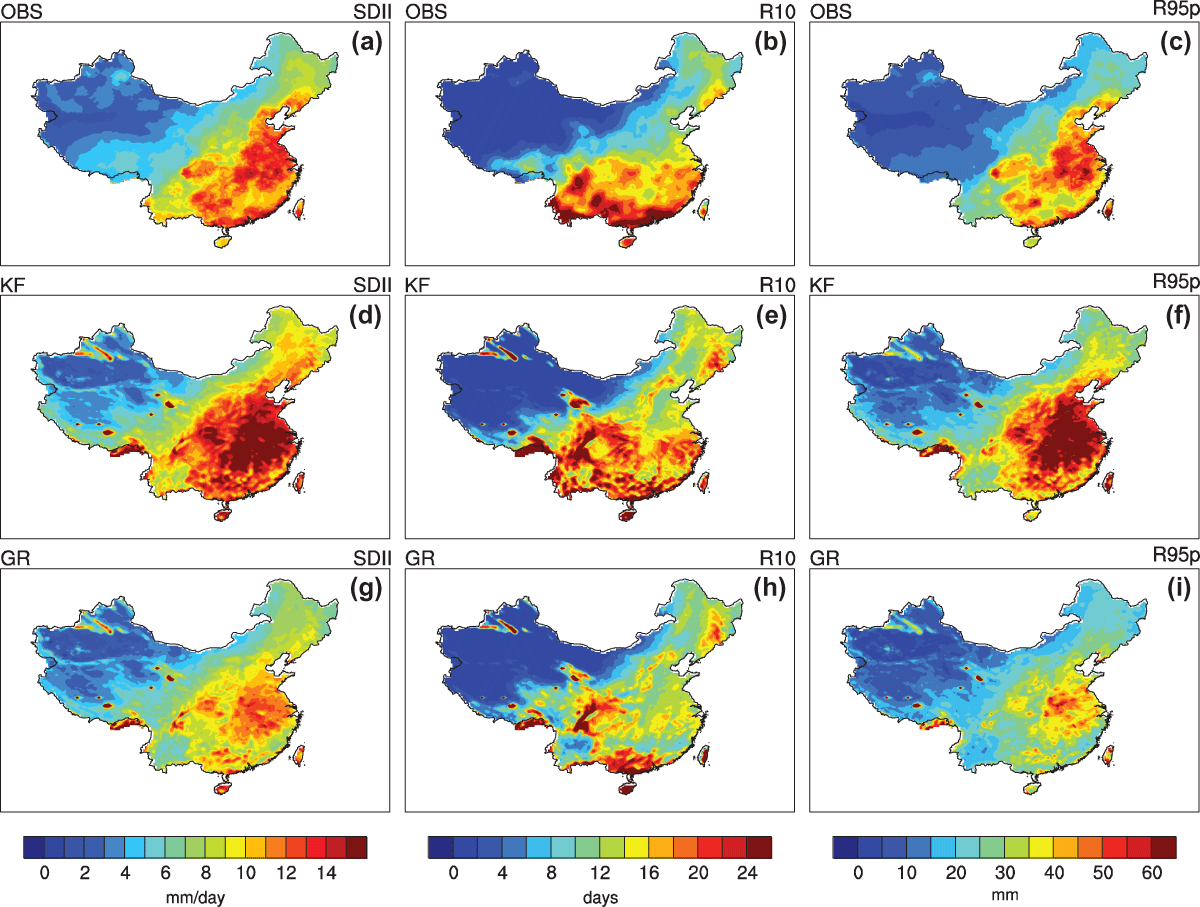
Fig. 6.
Spatial distributions of summer extreme precipitation indices (SDII (a, d, g), units: mm/day; R10 (b, e, h), units: days; R95p (c, f, i), units: mm) from observation (a–c), WRF model with Kain–Fritsch (d–f) and Grell (g–i) schemes. Note that the colourbar scales are different.
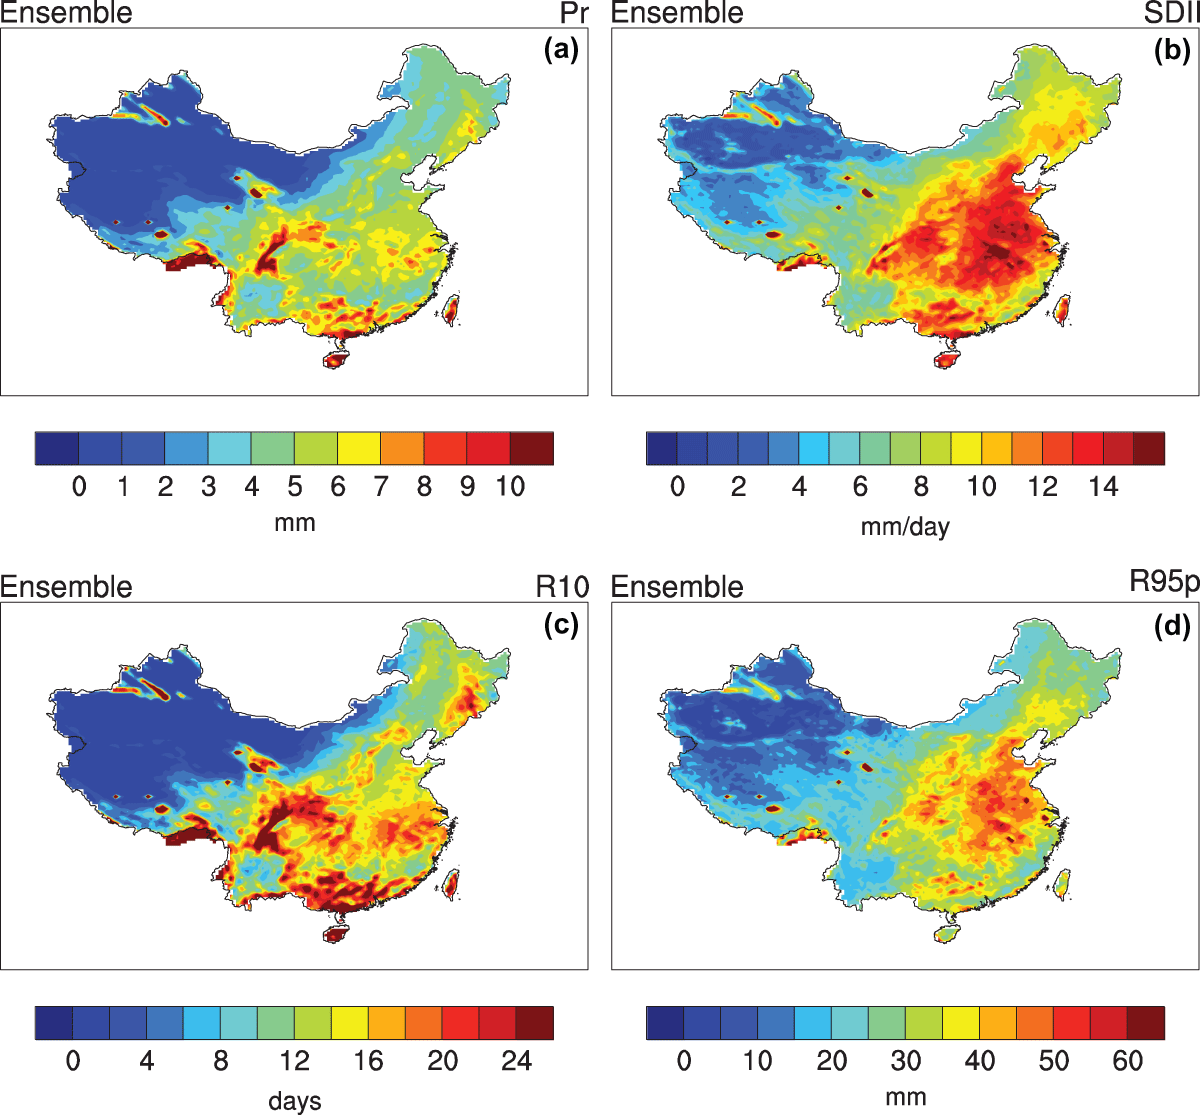
Fig. 7.
Spatial distributions of ensemble summer mean precipitation (a), (Pr, units: mm) and extreme precipitation indices (b–d) (SDII (b), units: mm/day; R10 (c), units: days; R95p (d), units: mm). Note that the colourbar scales are different.
Table 2.
RMSE of summer precipitation and extreme precipitation indices between Kain–Fritsch, Grell, Ensemble and observation.
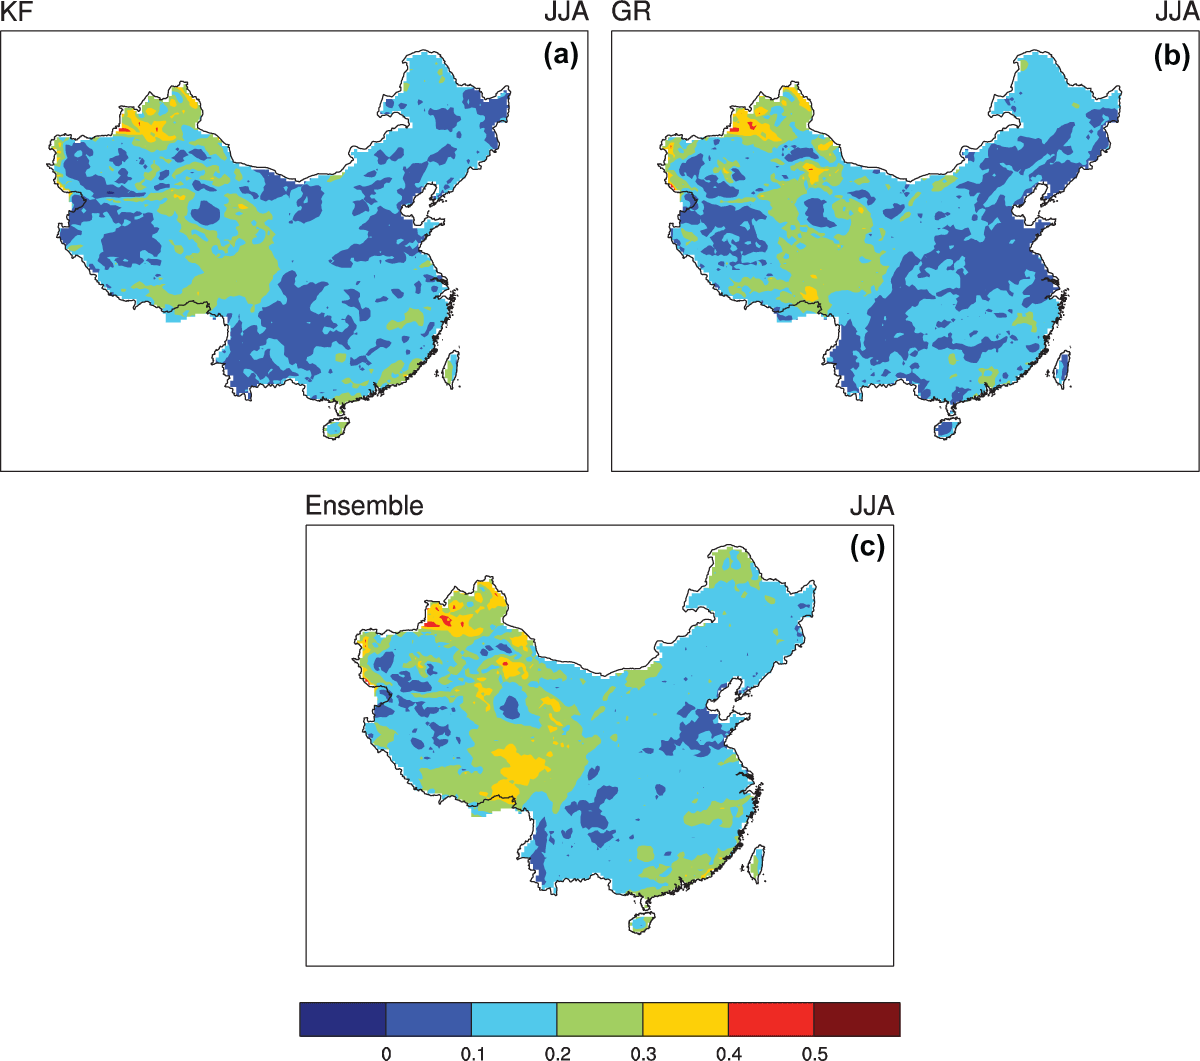
Fig. 8.
Spatial distributions of 1982–2004 temporal correlation coefficient of summer mean precipitation for WRF model with Kain–Fritsch (a), Grell cumulus schemes (b) and their ensemble result (c).
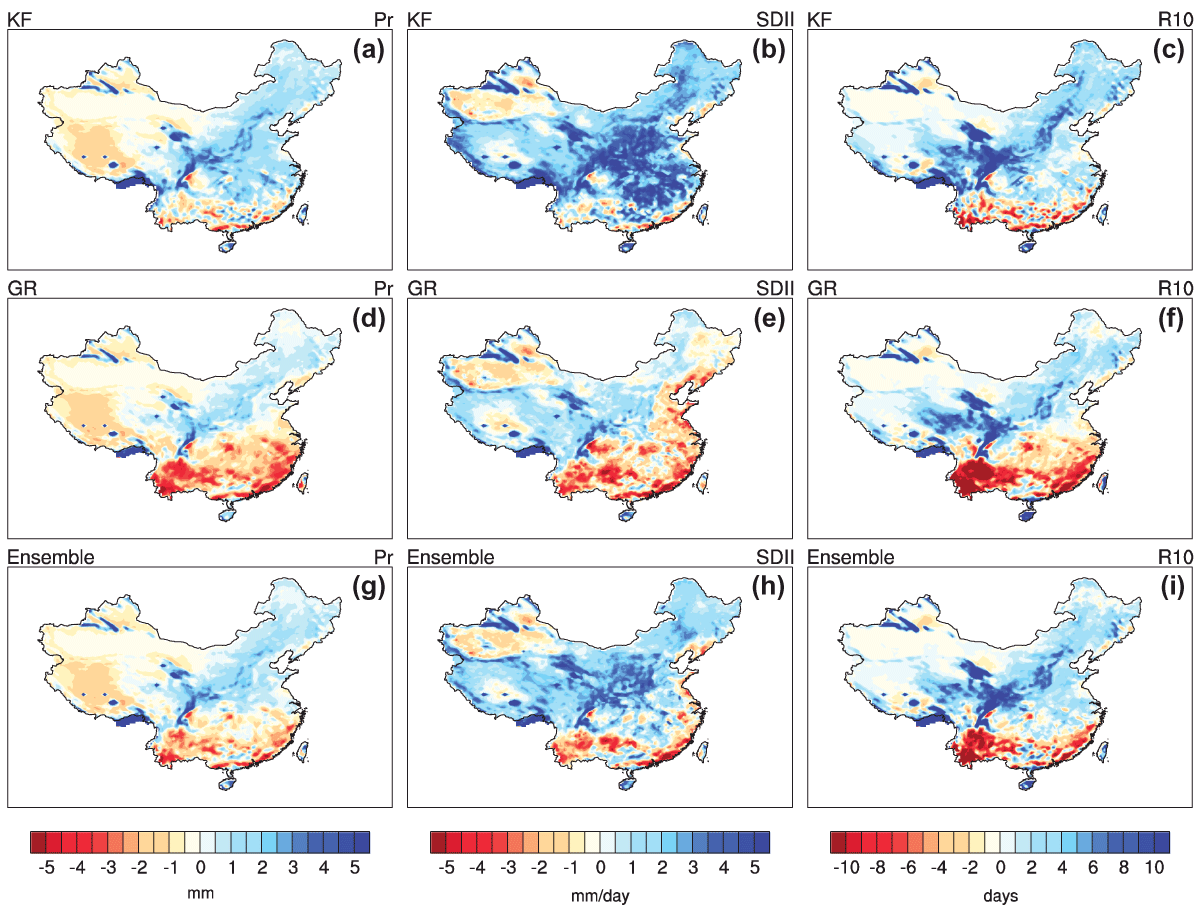
Fig. 9.
Spatial distributions of 1982–2004 biases of summer mean precipitation (a, d, g) (Pr, units: mm) and extreme precipitation indices (b, c, e, f, h, i) (SDII (b, e, h), units: mm/day; R10 (c, f, i), units: days) from WRF model with Kain–Fritsch (a–c), Grell (d–f) cumulus schemes and their ensemble result (g–i). Note that red colours represent a dry bias and blue colours represent a wet bias and the colourbar scales are different.