
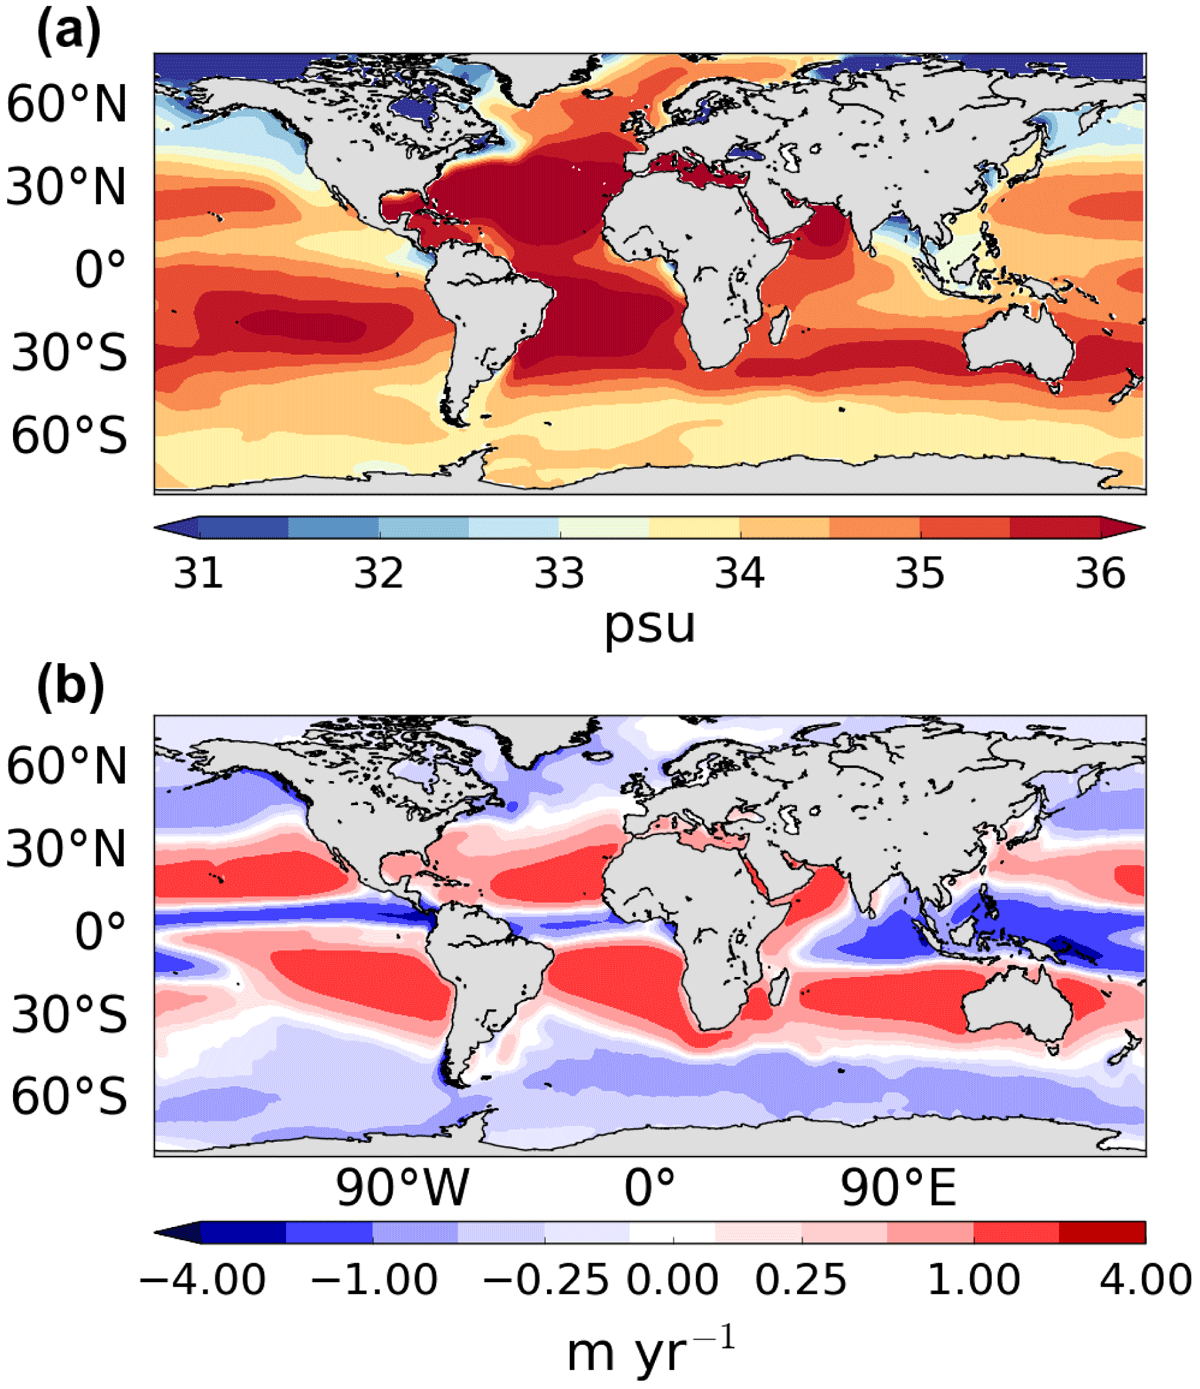
Figure 1.
(a) Annual mean SSS (1955–2012) from the World Ocean Atlas (Zweng et al., 2013) and (b) Annual mean (1979–2014) from ERA-Interim vertically integrated moisture flux divergence. Gaussian filter applied to smooth data.
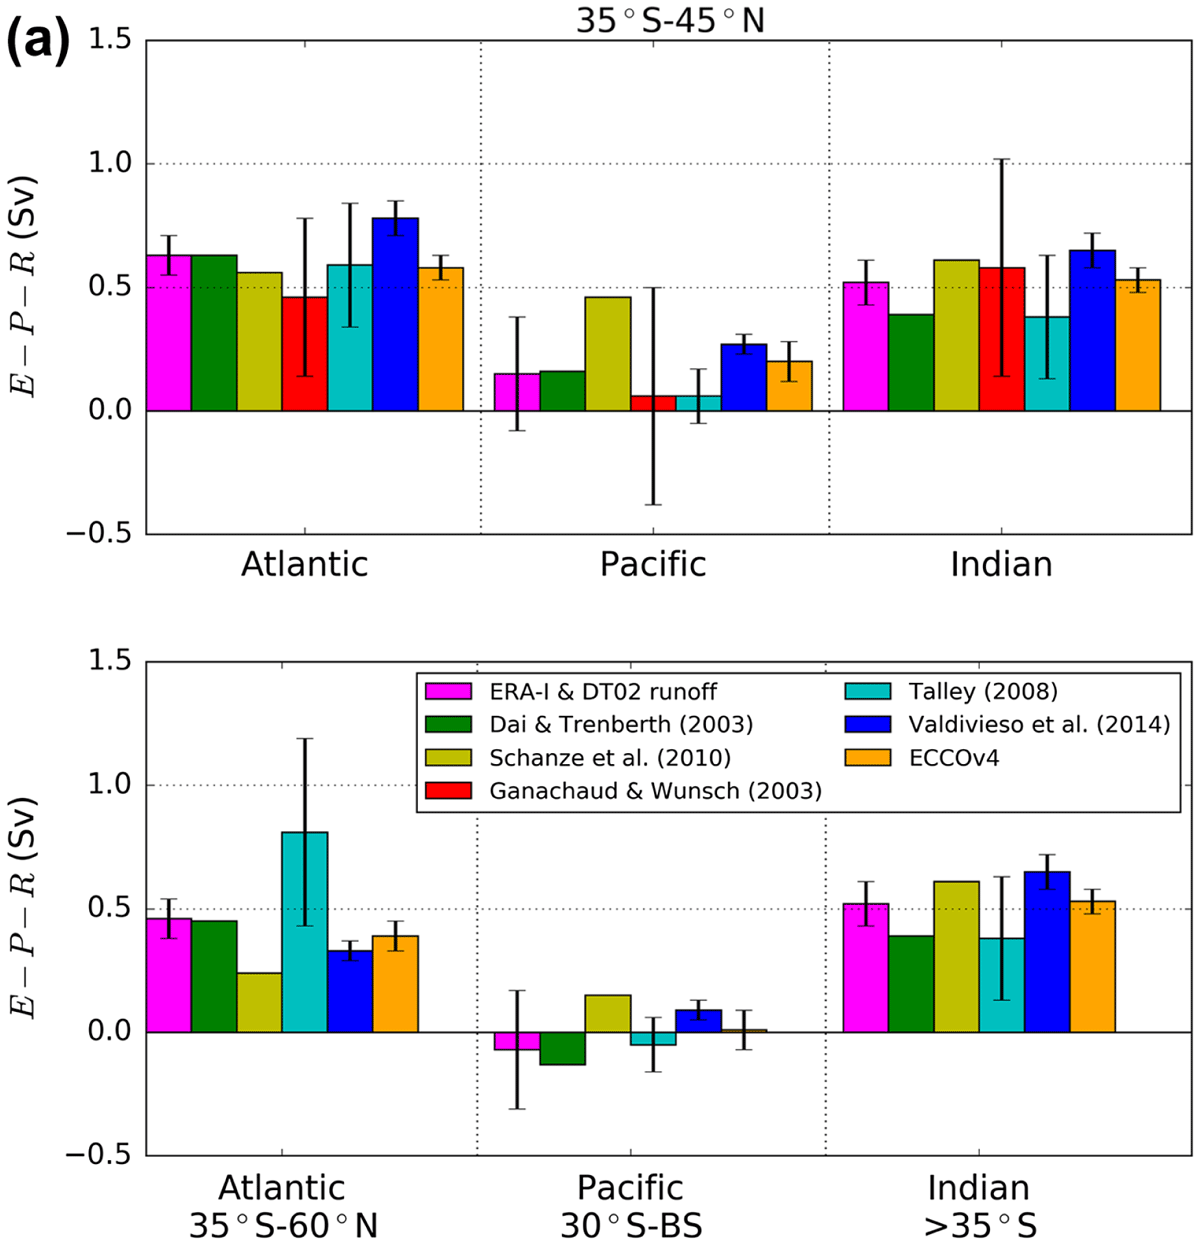
Figure 2.
Basin-integrated net freshwater flux () for each ocean basin over different latitudinal extents: (a) approximately 35S-45N and (b) approximately 35S-65N. The latitude boundaries shown are approximate and do not apply to each estimate. Exact boundaries used in calculating each estimate are shown in Table 1. Estimates based on atmospheric data are shown first followed by the oceanographic estimates.
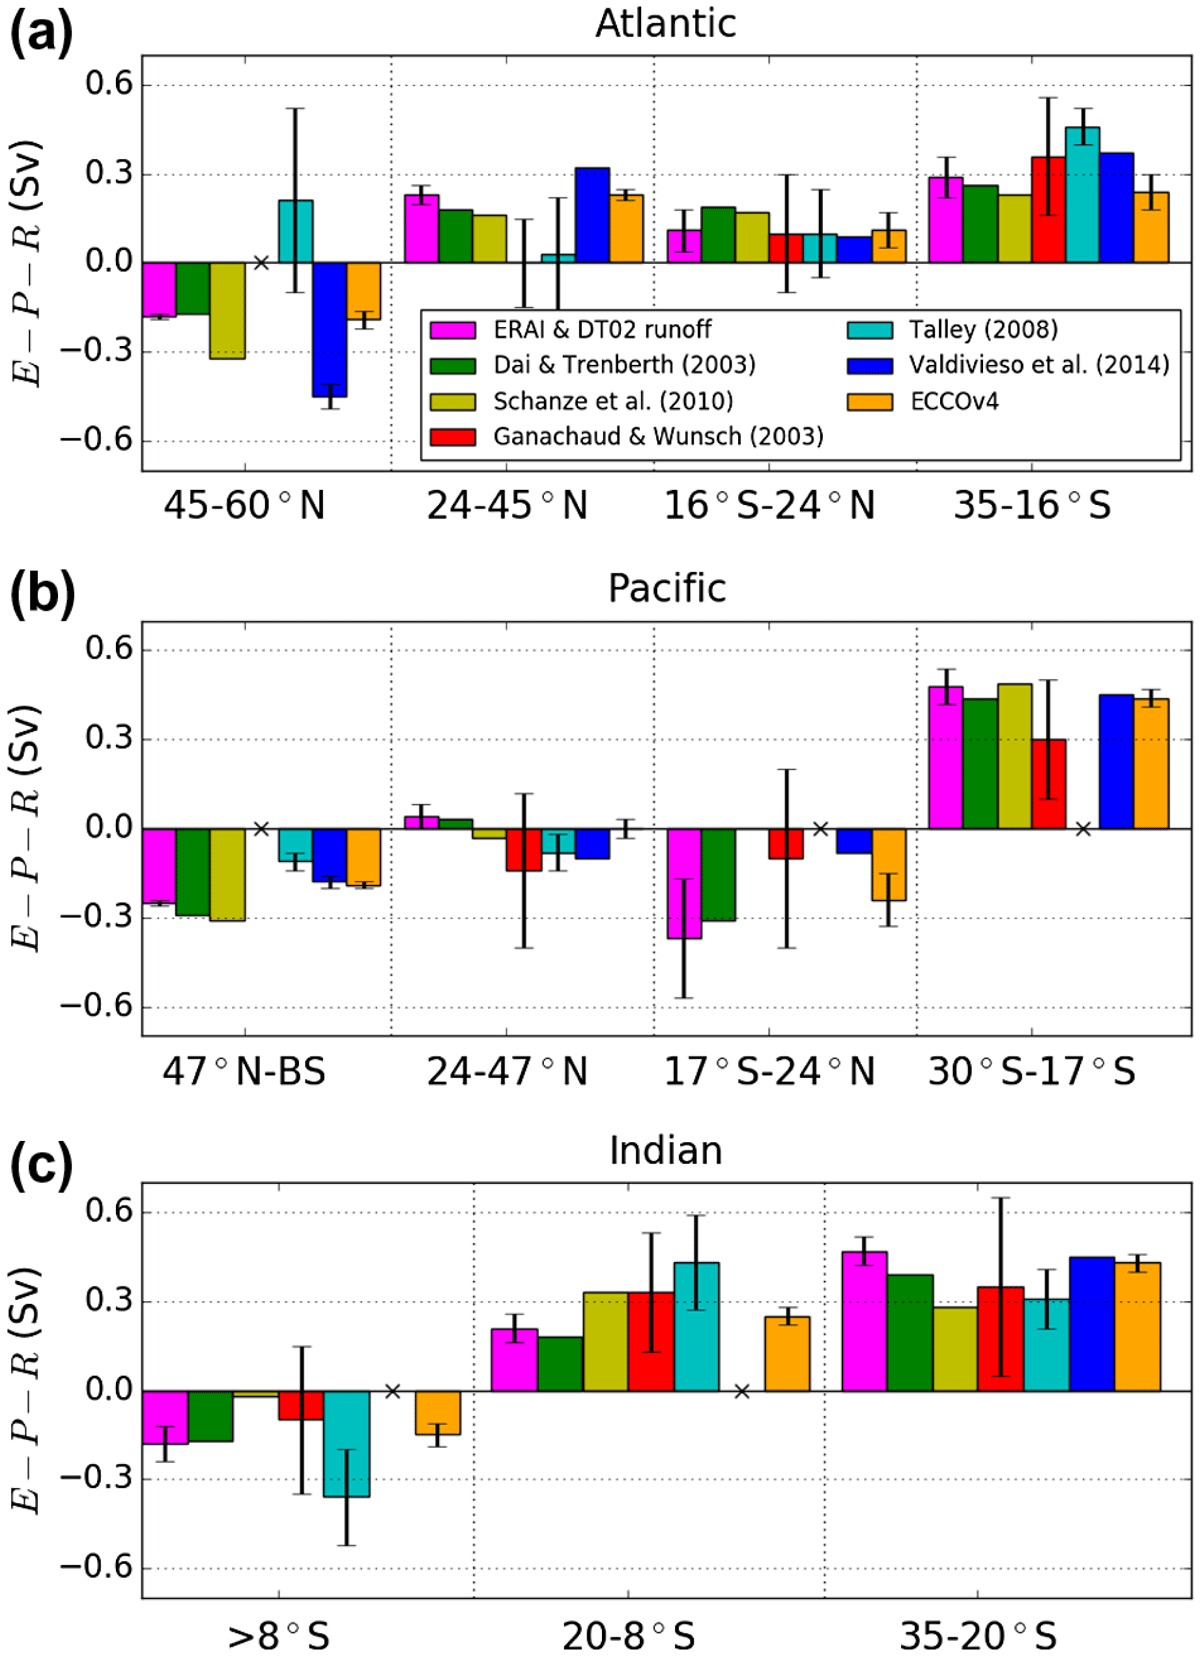
Figure 3.
for latitude bands within the (a) Atlantic, (b) Pacific and (c) Indian oceans for the estimates described in section 3. Latitudes below each subfigure refer to those used to break up ERA-Interim. The exact boundaries used in calculating each estimate are shown in Table 1. Crosses denote that there is no estimate provided for a band, otherwise .
Table 1.
Table of latitude boundaries for each of the estimates shown in Figs. 2 and 3. The Mediterranean and Baltic Seas are included in the ERA-Interim estimate at the relevant basin scales and in the latitude bands where they join the main Atlantic Ocean. BS refers to the Bering Strait and a star denotes that the latitudes shown are only approximate.
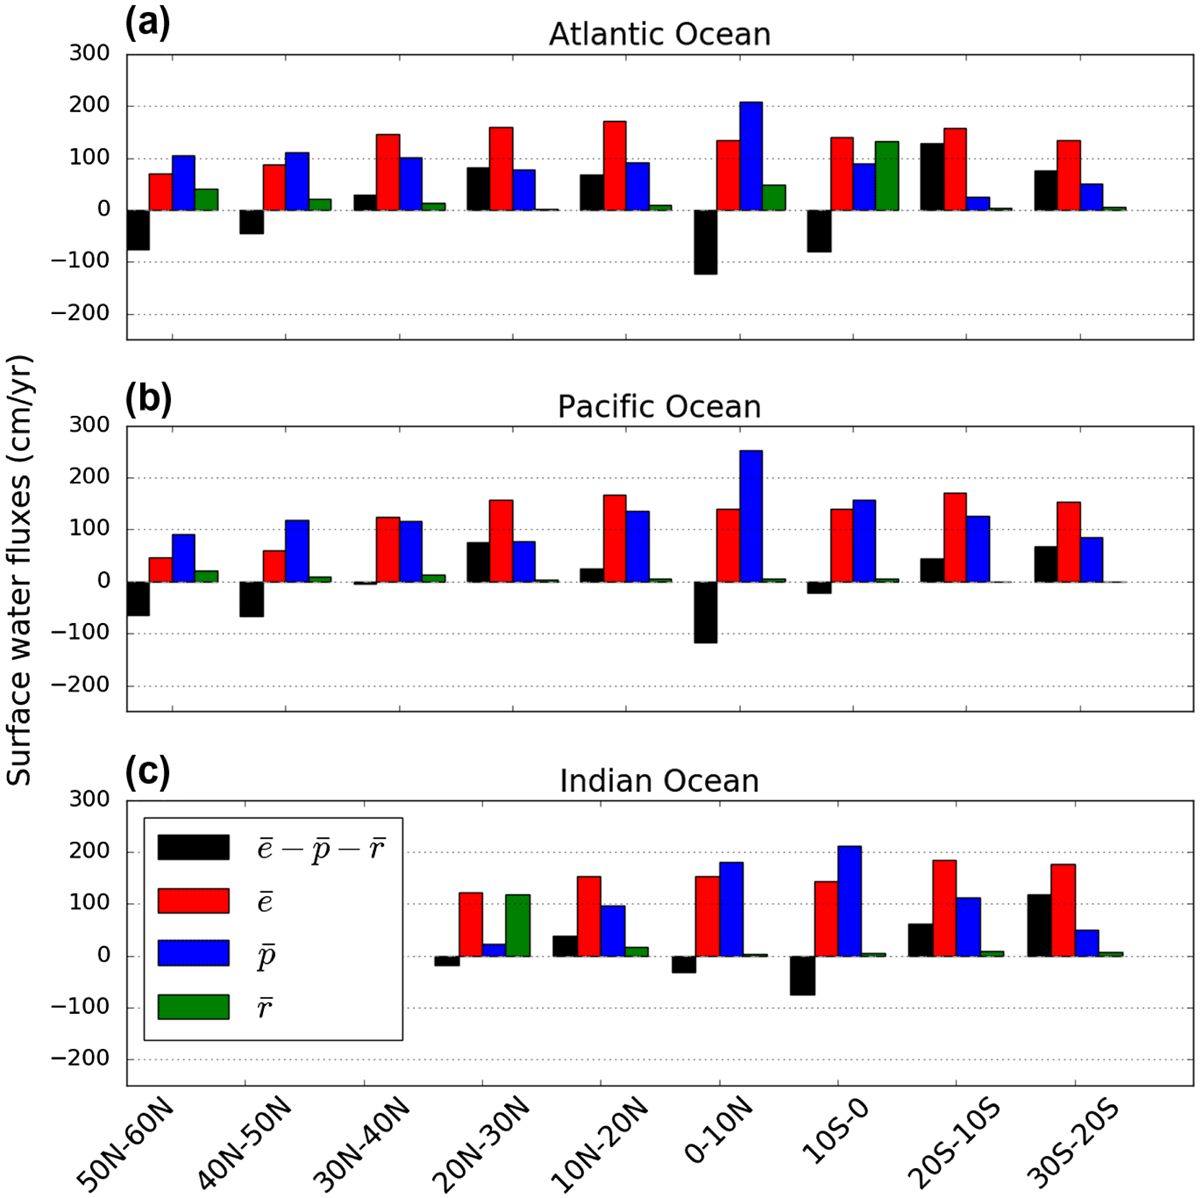
Figure 4.
Annual mean area-averaged ERA-Interim (1979–2014) surface water fluxes in 10 latitude bands for the (a) Atlantic, (b) Pacific and (c) Indian oceans with Dai and Trenberth (2002) run-off divided into the same 10 latitude bands.
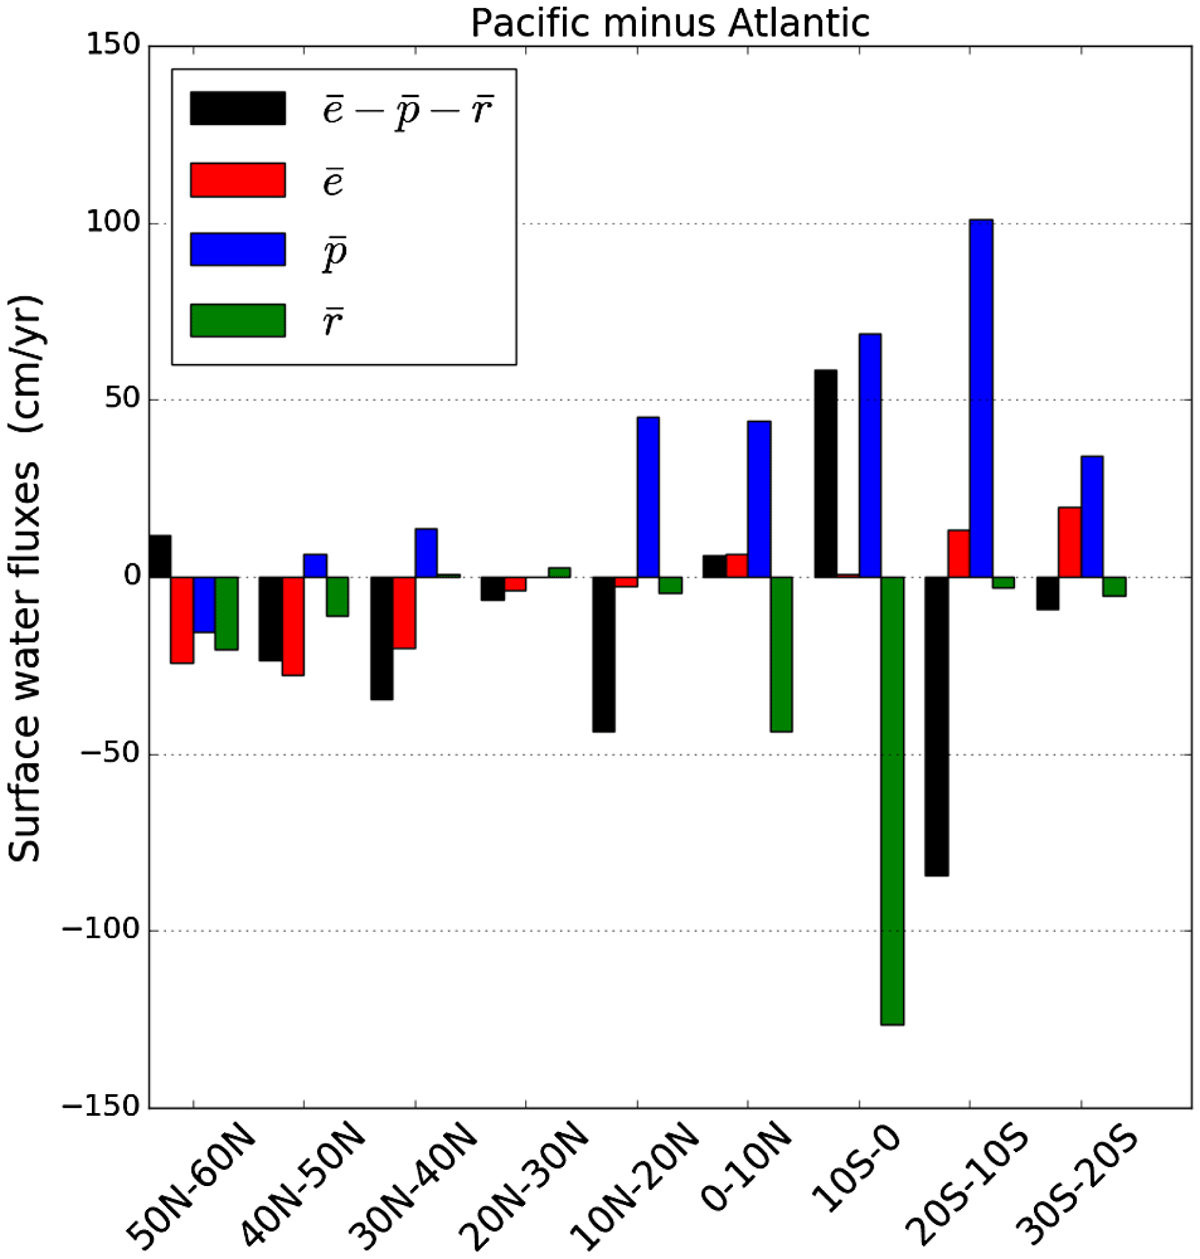
Figure 5.
Differences between area-averaged annual mean ERA-Interim (1979–2014) Pacific and Atlantic surface water fluxes in 10 latitude bands scaled by area with Dai and Trenberth (2002) run-off divided into the same 10 latitude bands.
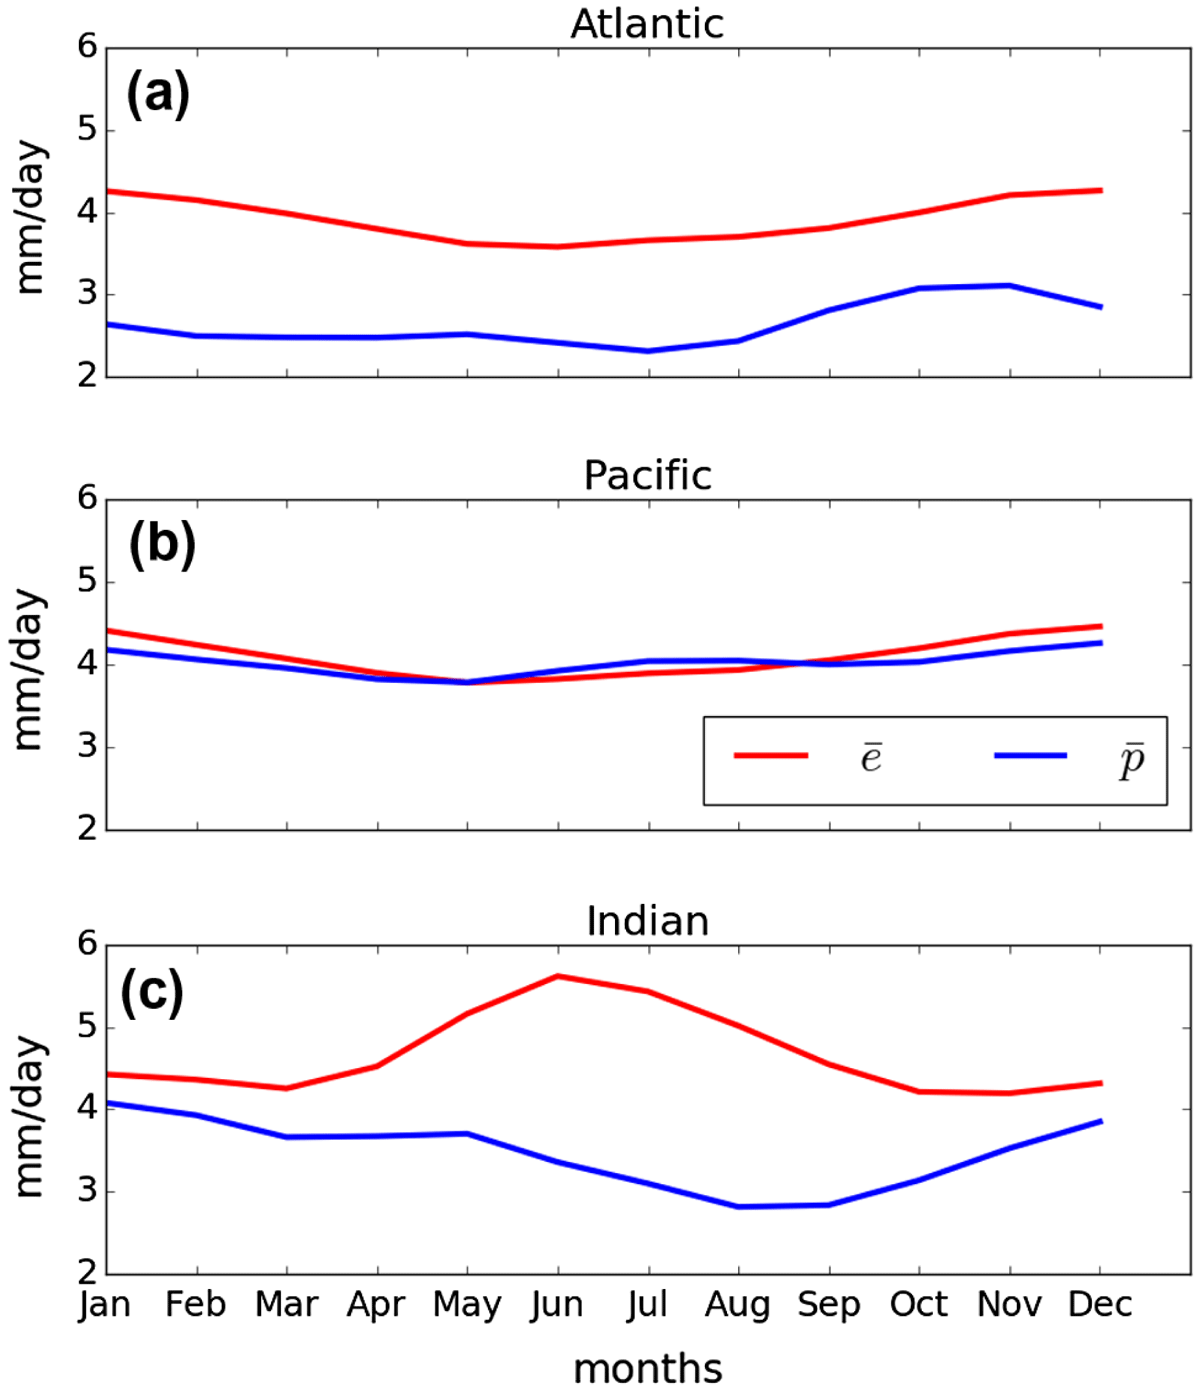
Figure 6.
Climatological monthly means (1979–2014) of ERA-Interim and for the (a) Atlantic (35S-60N), (b) Pacific (30S-Bering Strait) and (c) Indian (S) Oceans at basin scale (first row of ERA-Interim columns in Table 1).
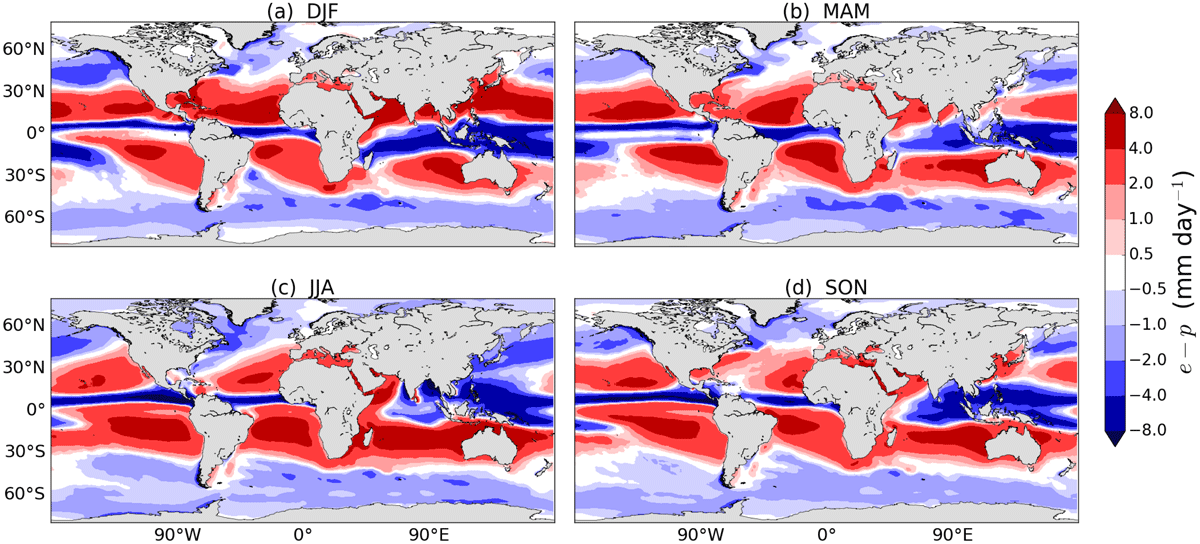
Figure 7.
Climatological seasonal mean ERA-Interim from accumulated surface forecasts 1980–2014 for (a) December–January–February (DJF), (b) March–April–May (MAM), (c) June–July–August (JJA) and (d) September–October–November (SON).
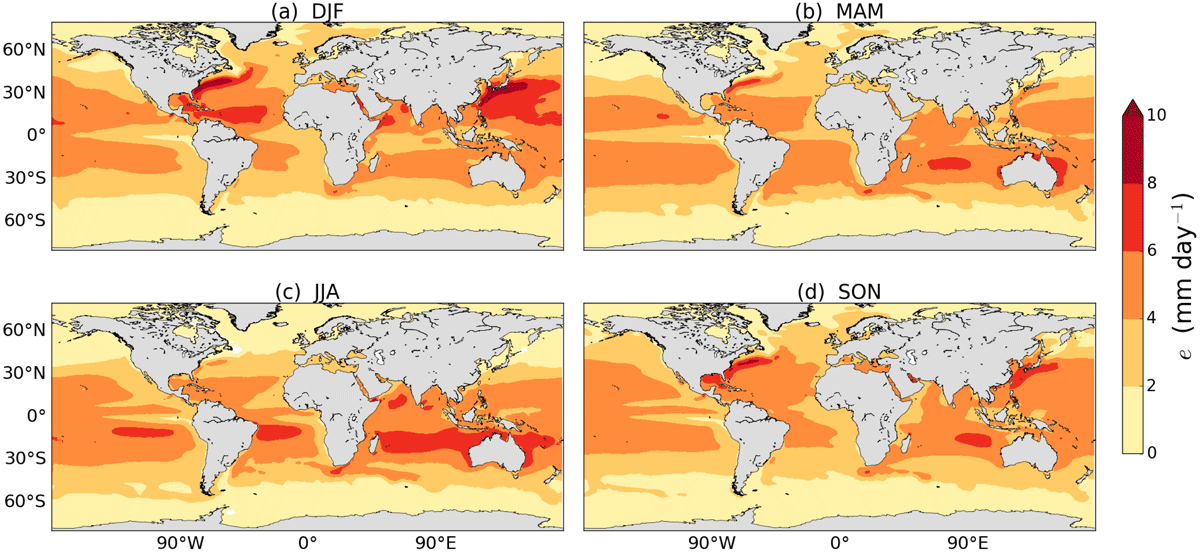
Figure 8.
Climatological seasonal mean ERA-Interim evaporation 1980–2014 for (a) DJF, (b) MAM, (c) JJA and (d) SON.
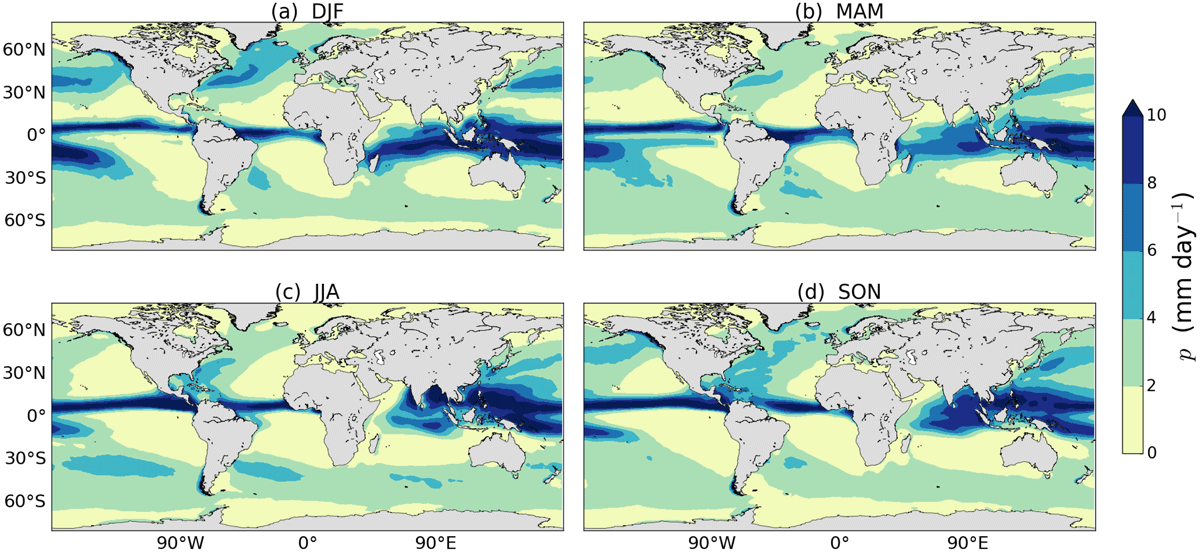
Figure 9.
Climatological seasonal mean ERA-Interim precipitation 1980–2014 for (a) DJF, (b) MAM, (c) JJA and (d) SON.
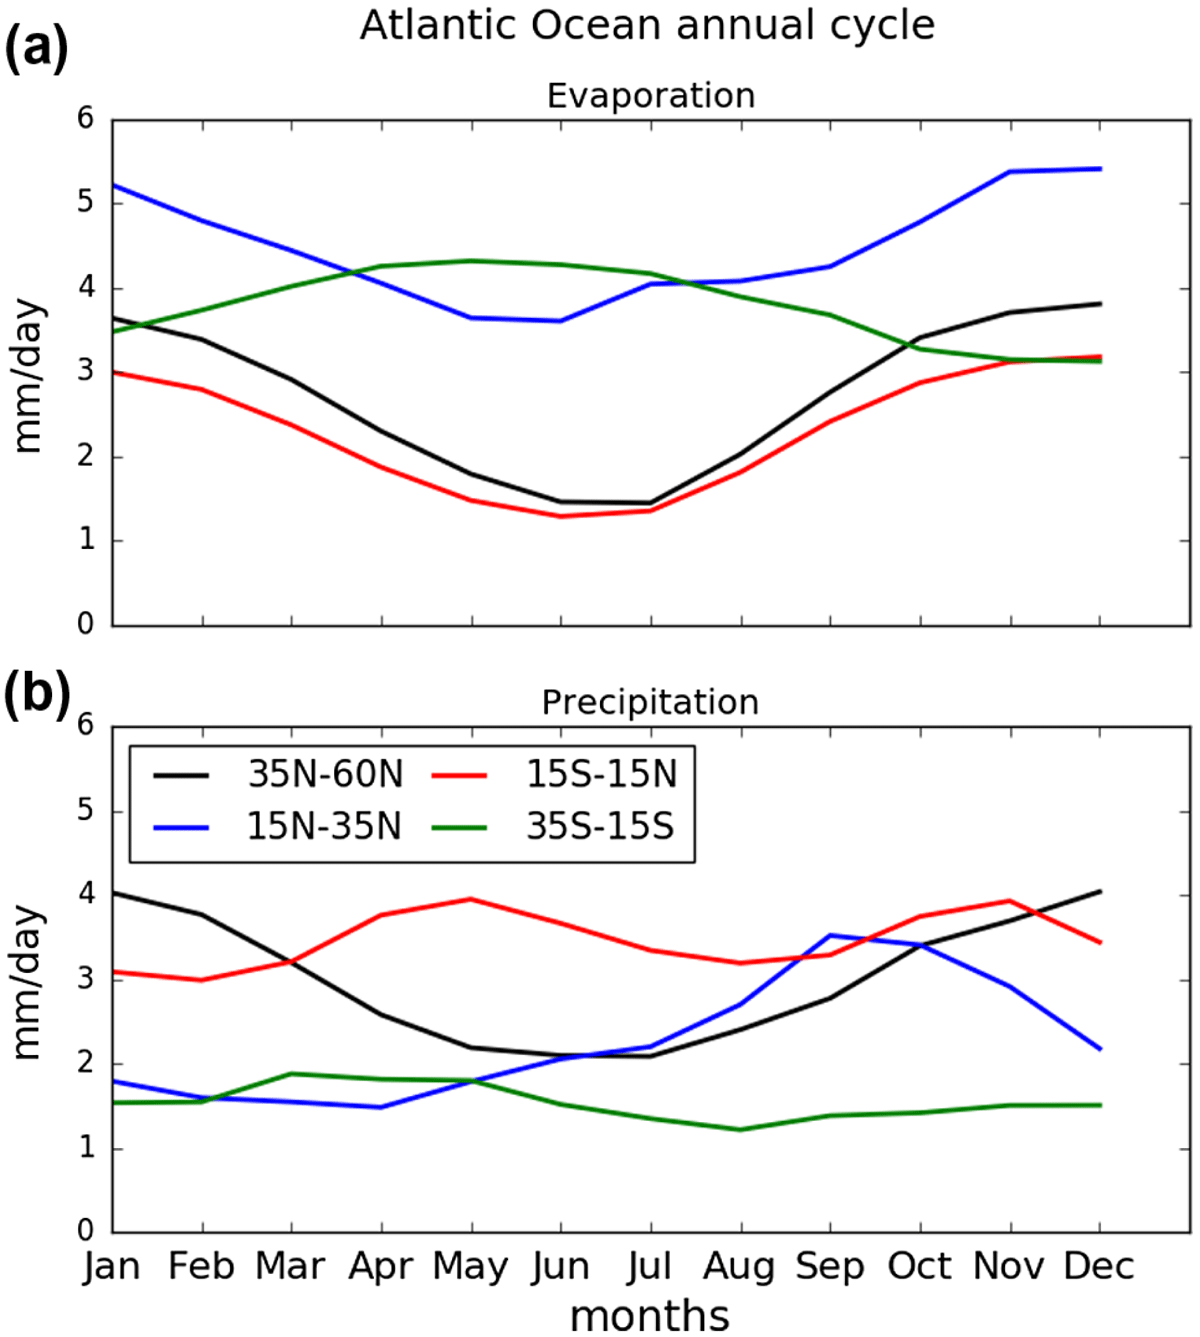
Figure 10.
Climatological monthly means of ERA-Interim (1979–2014) Atlantic Ocean area-averaged (a) evaporation and (b) precipitation in latitude bands representing the tropics, subtropics and northern hemisphere extratropics.
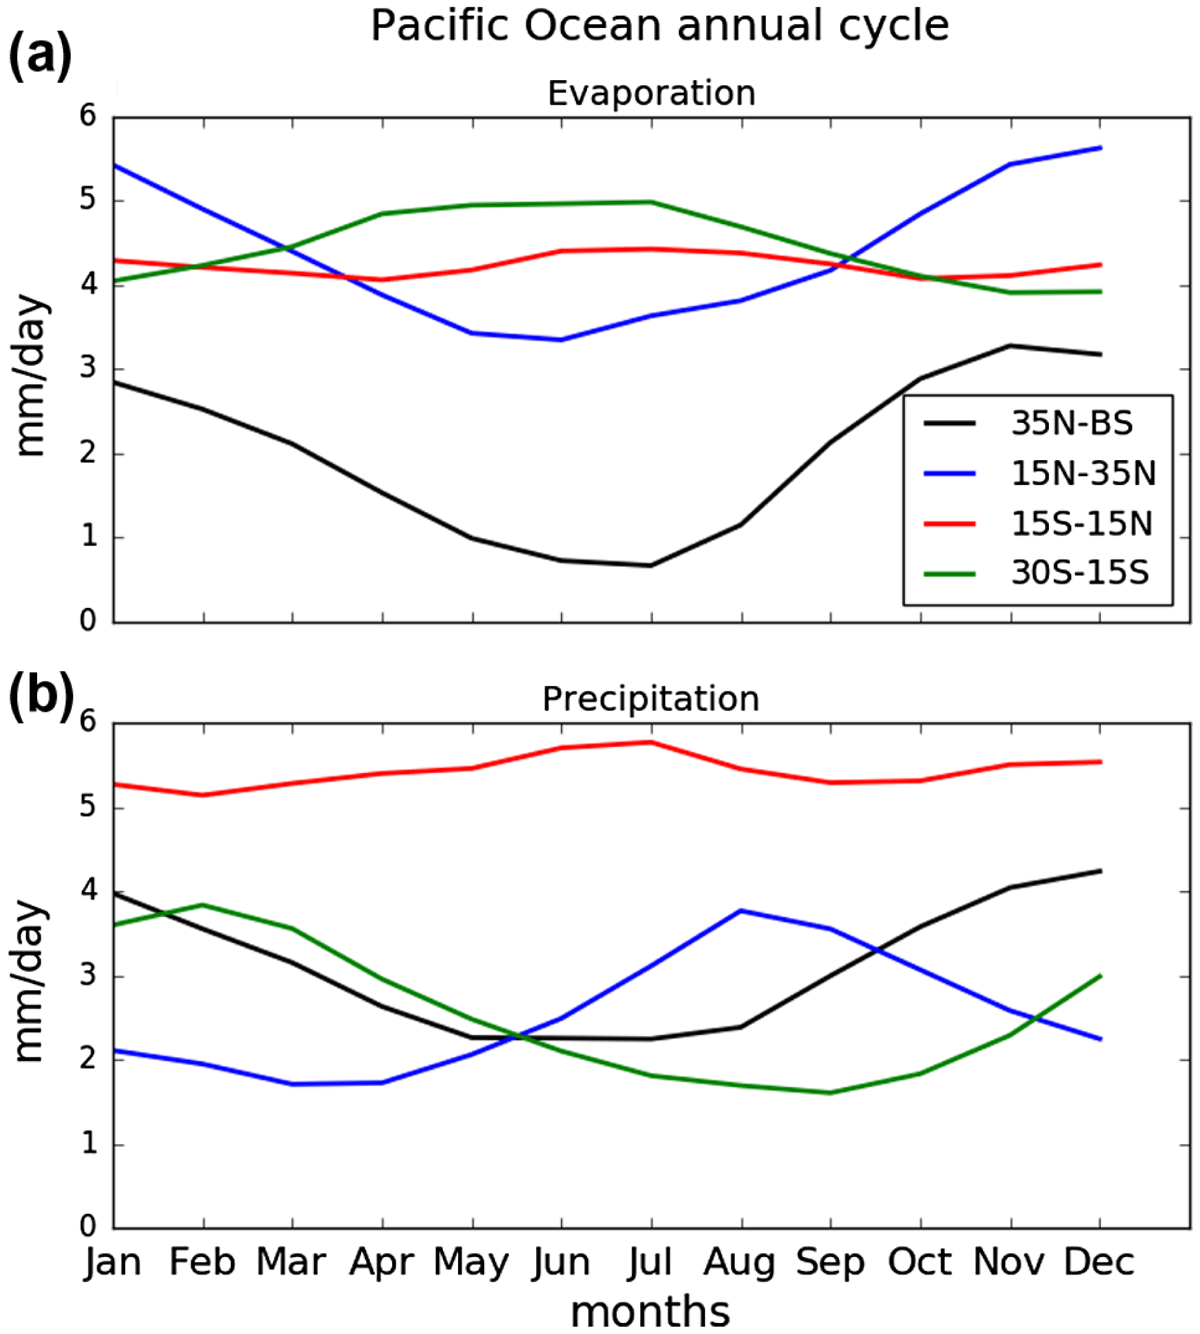
Figure 11.
Climatological monthly means of ERA-Interim (1979–2014) of Pacific Ocean area-averaged (a) evaporation and (b) precipitation in latitude bands representing the tropics, subtropics and northern hemisphere extratropics.
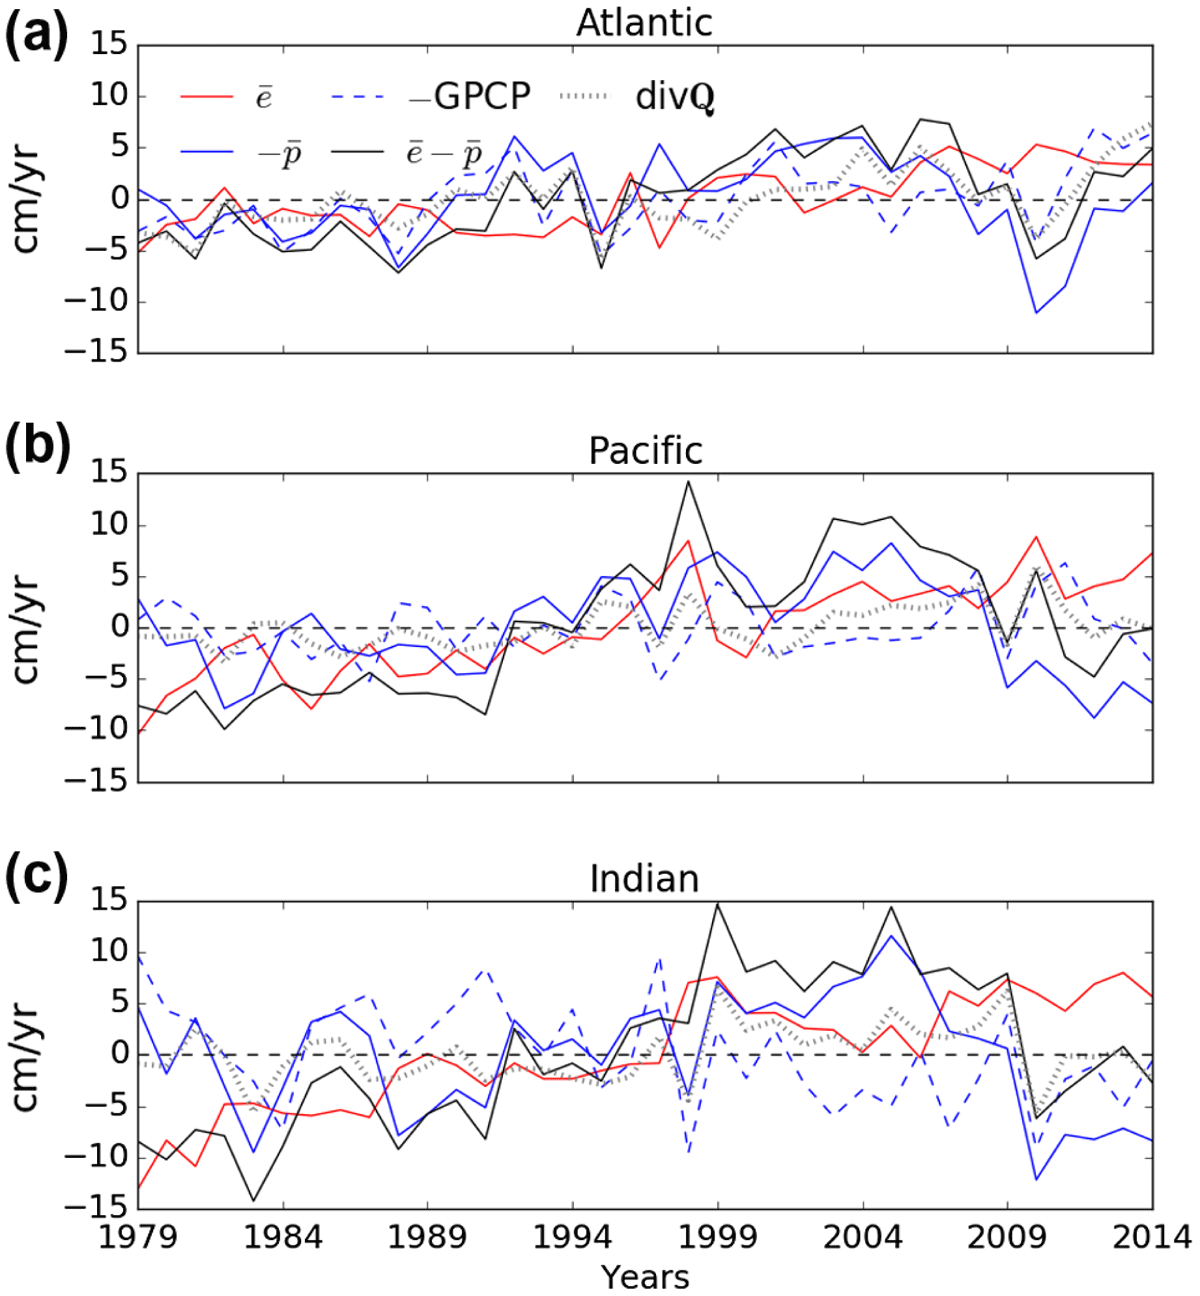
Figure 12.
Yearly anomalies from the 1979–2014 area-averaged annual mean ERA-Interim , , , and -GPCP for the (a) Atlantic, (b) Pacific and (c) Indian oceans at basin scale (first row of ERA-Interim columns in Table 1).