
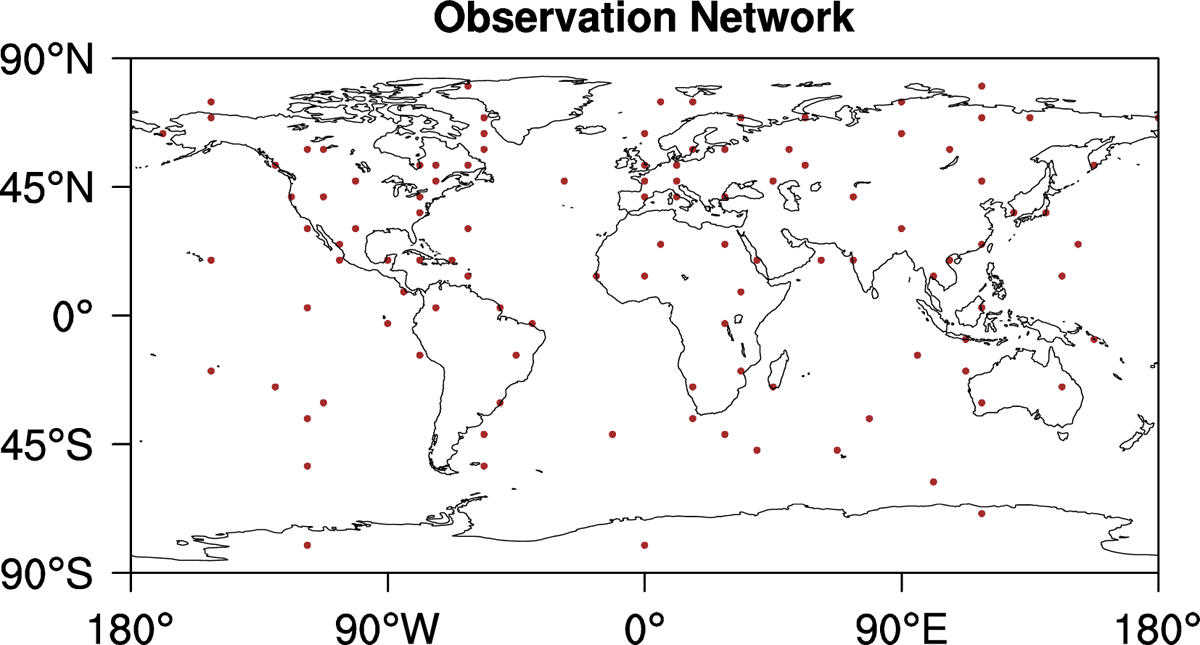
Fig. 1.
Distribution of simulated observations (hollow circle).
Table 1.
Estimated values of parameters , α and ρ 1 with the Statistical Analysis and Forecast Error (SAFE) estimation in PT14 and its enhanced version proposed here for the 500 hPa global (GB), Northern (NH) and Southern (SH) Hemisphere, and Tropical belt (TRO) regions. The actual values of the parameters and the SEM corresponding to the 95% significance level are also shown.
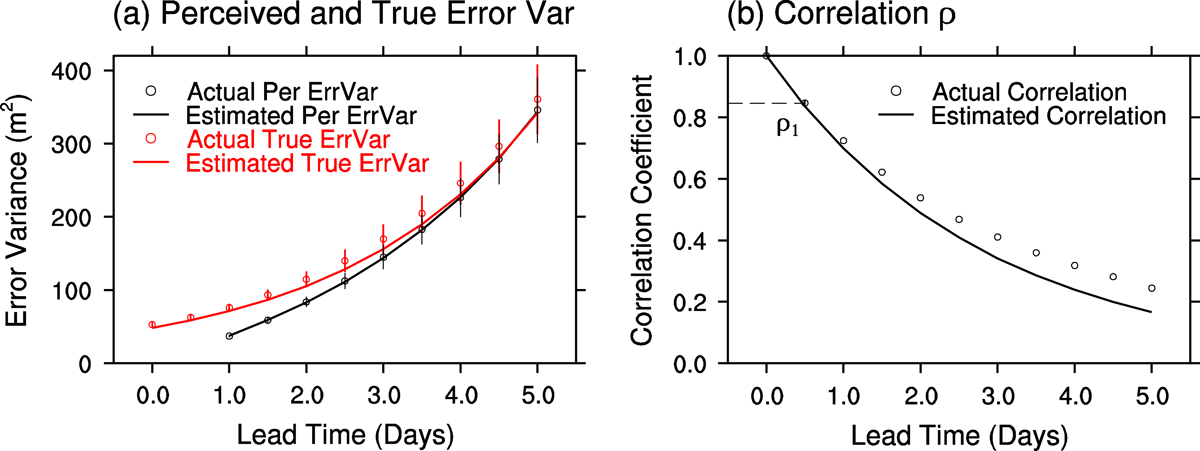
Fig. 2.
(a) Globally (vertically and horizontally) averaged 90-day time mean perceived (black) and true (red) forecast error variances, and (b) resulting correlation of true forecast and analysis errors as a function of lead time. Hollow circles and lines represent actual and estimated values (assuming exponential error growth), respectively. Vertical bars show the 95% confidence interval corresponding to sampling uncertainty in the time mean error estimates. Since ρ i (i > 1) is a simple function of ρ 1, a confidence interval is shown only for ρ 1. The estimated and actual values of the unknown parameters are = 48.12, α = 0.392, ρ 1 = 0.836 and 53.0, 0.38, 0.85, respectively.
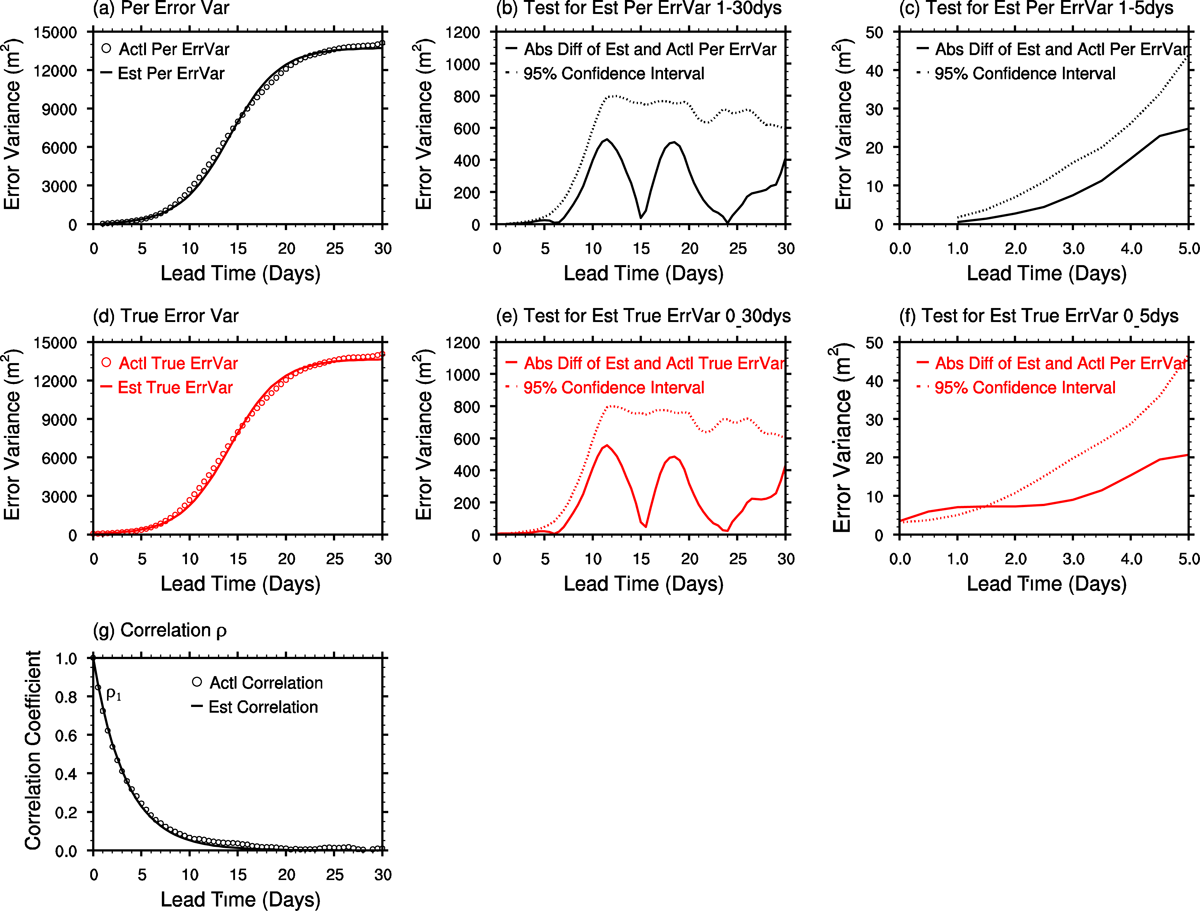
Fig. 3.
Globally (both vertically and horizontally) averaged 90-day time mean actual (open circles) and simulated (assuming logistic error growth, continuous lines) perceived (a) and true (d) forecast error variances, and their absolute differences (continuous lines for perceived (b and c, the latter a zoom-in version of b), and true error (e and zoom-in f), as well as the 95% confidence level corresponding to sampling uncertainty in the time mean estimates (dotted curves). The correlation between true analysis and forecast errors is shown in (g). The estimated and actual values for the known parameters are = 56.5, α = 0.38, ρ 1 = 0.86, S ∞ = 13672.8, and 53.0, 0.38, 0.85, 13889.1, respectively.
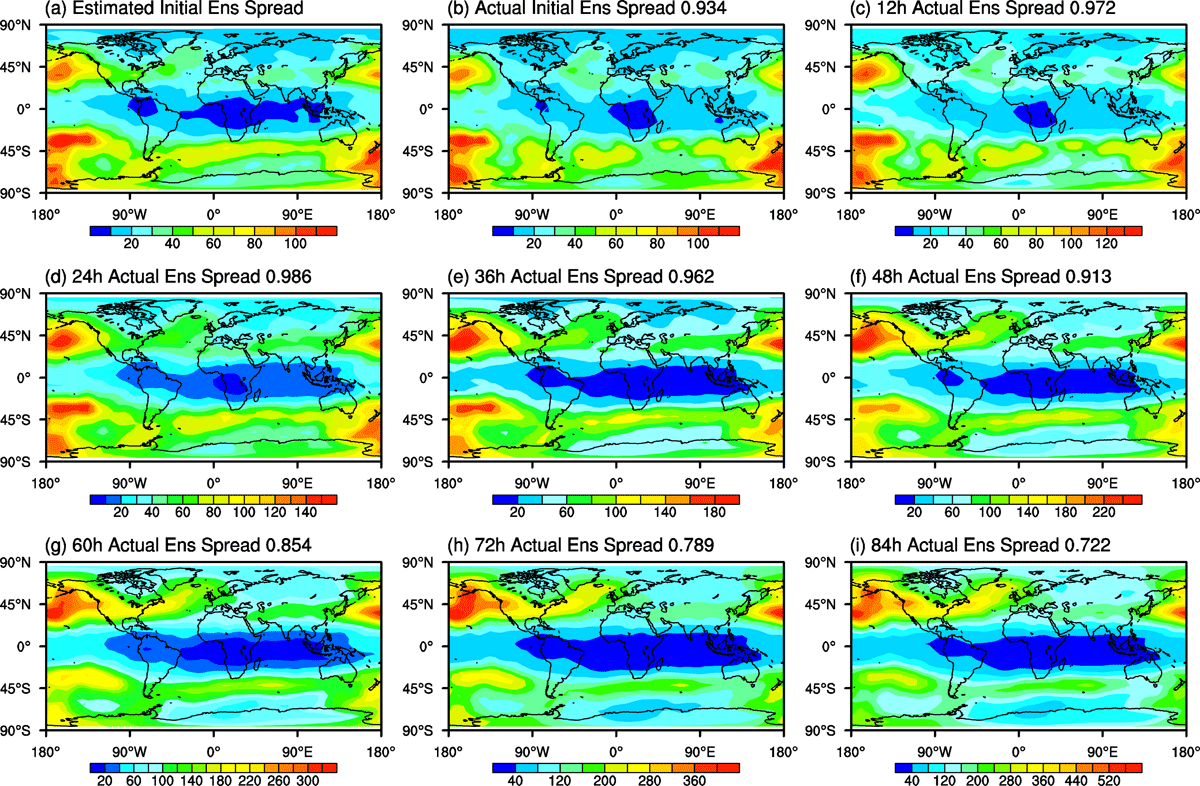
Fig. 4.
Distribution of 90-day sample mean estimated (a) and actual (b) 500 hPa initial ensemble spread and actual 12–84-h ensemble spread. The spatial correlations of panels (b–i) to (a) are listed above the panels.
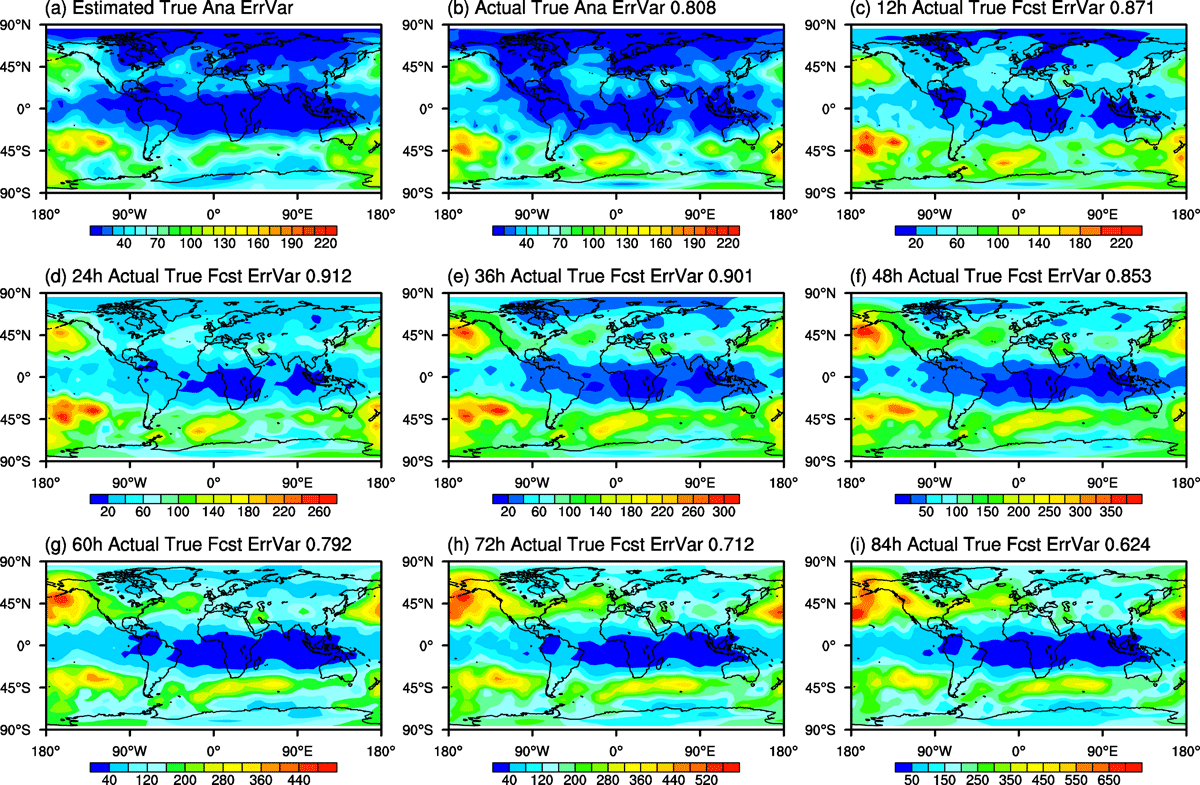
Fig. 5.
Distribution of 90-day sample mean estimated (a) and actual (b) 500 hPa analysis error variances and 12–84-h actual true forecast error variances. The spatial correlations of panels (b–i) to (a) are listed above the panels.
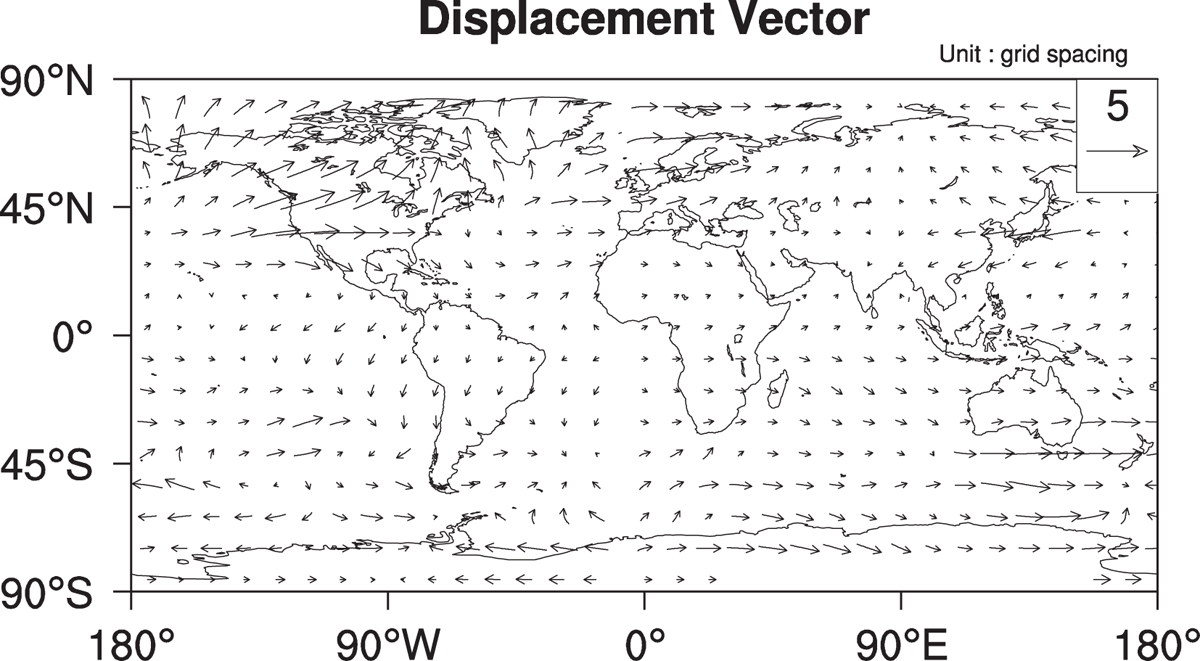
Fig. 6.
Estimated displacement vector field transposing Fig. 4b to a.
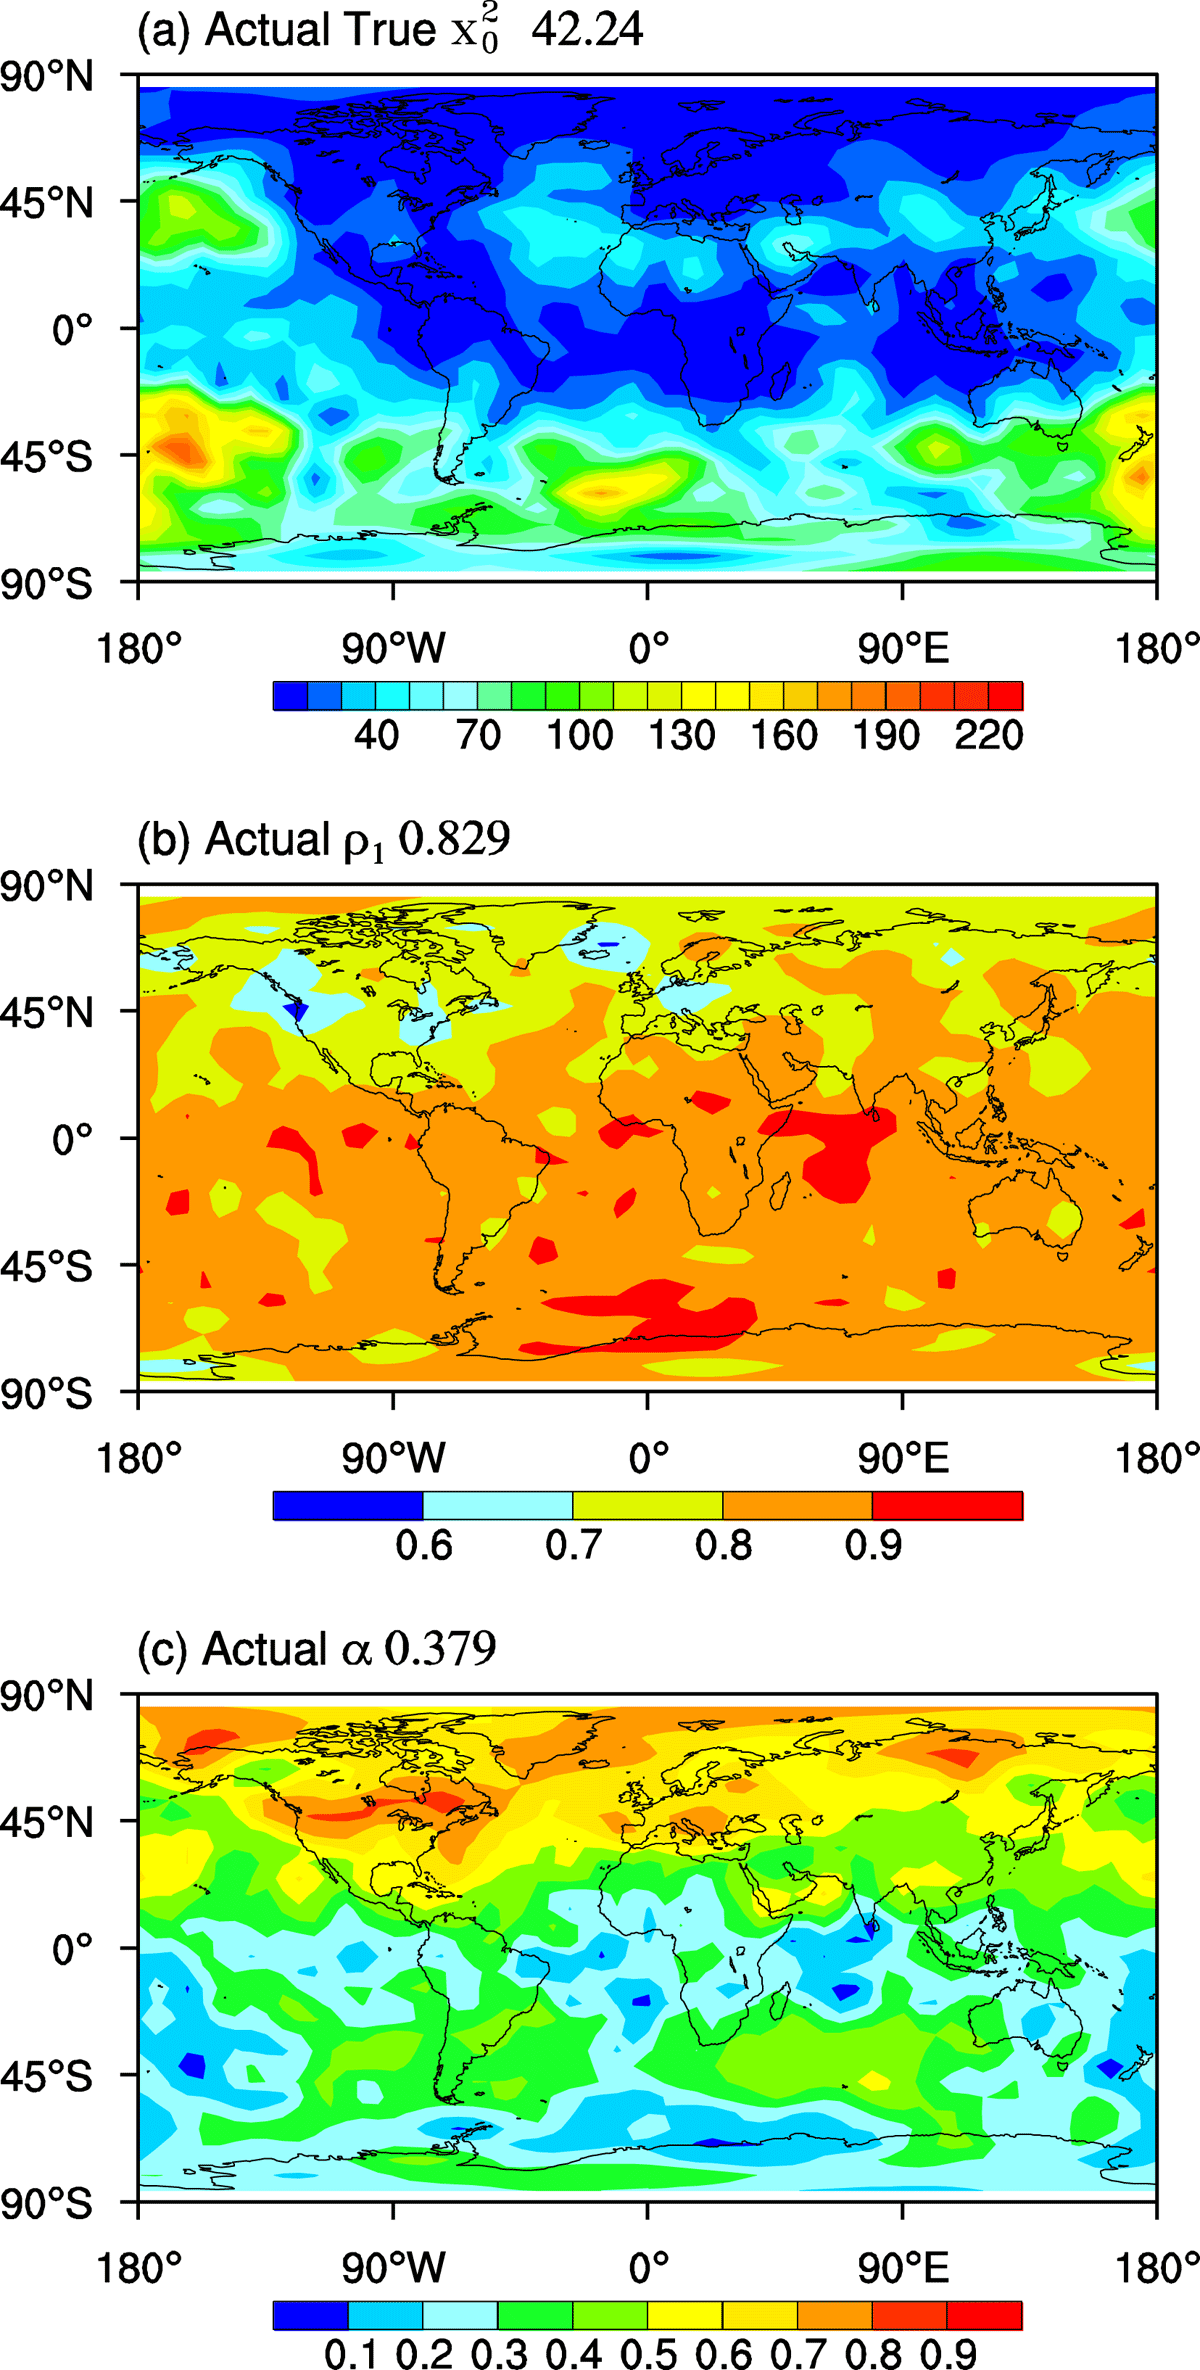
Fig. 7.
Distribution of the actual values for the 500 hPa parameters (a) analysis error variance , (b) correlation of analysis and background forecast errors ρ 1 and (c) exponential growth rate. Global mean values are 42.24, 0.829 and 0.379, respectively.
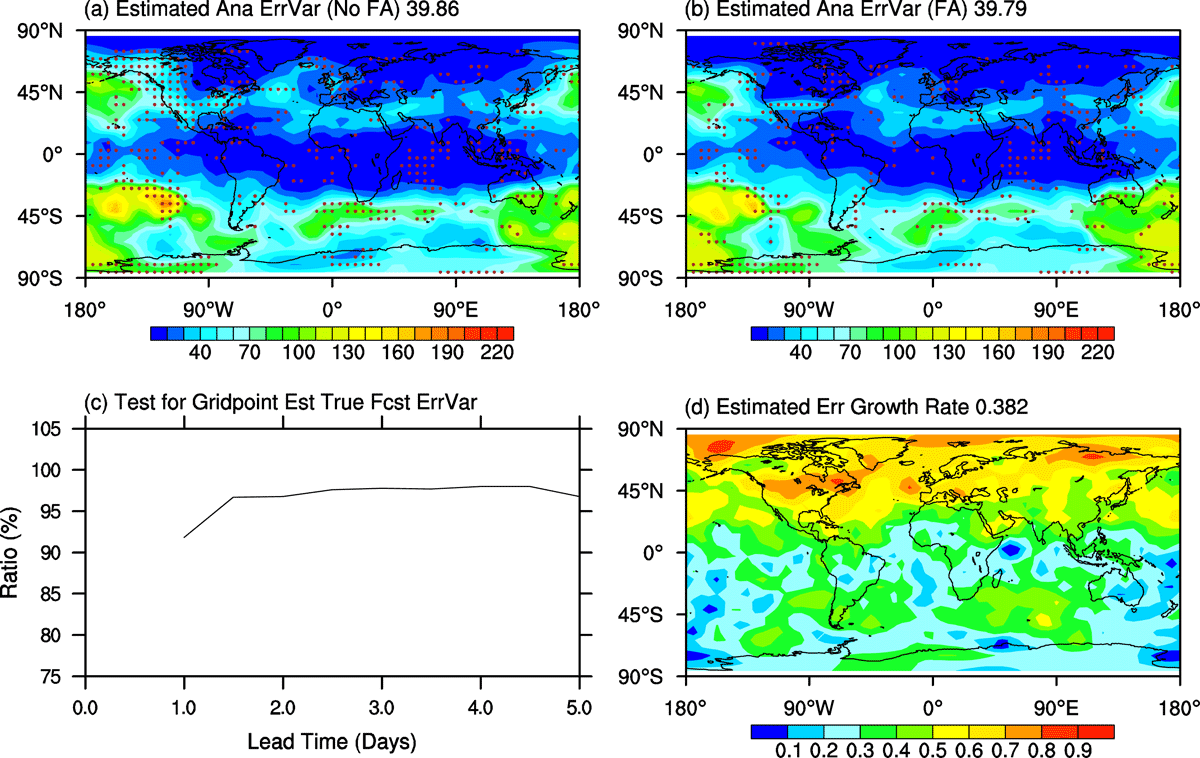
Fig. 8.
Distribution of estimated 500 hPa analysis error variance without (a) and with (b) the application of field alignment (FA) technique, and the estimated exponential error growth rate (d). Global mean value of (a), (b) and (d) are 39.86, 39.79 and 0.382, respectively. (c) Percentage of gridpoints with estimated true forecast error variance within the 95% sampling confidence interval of their respective actual time mean values. For further details, see text.