
Table 1.
Table containing a list of all the markers used to identify the models, model name, the institute that conducted the experiments, the values of AMOC at 26.5°N, at 34°S and at 26.5°N. The values with a grey shading for fall within the range of observational estimates. The stars behind the model names indicate the models for which freshwater fluxes were available in the CMIP5 model database.
 ACCESS1-0*CSIRO-BOM15.97-0.038-0.695
 ACCESS1-3*CSIRO-BOM17.26-0.004-0.826
 bcc-csm1-1BCC15.85+0.099-0.388
 bcc-csm1-1-mBCC19.28+0.112-0.519
 BNU-ESMGCESS24.03+0.513-0.741
 CanESM2CCCMA13.89+0.153-0.589
 CCSM4NCAR18.33+0.198-0.730
 CESM1-BGCNSF-DOE-NCAR19.31+0.188-0.777
 CESM1-CAM5NSF-DOE-NCAR19.39+0.240-0.677
 CESM1-CAM5-1-FV2NSF-DOE-NCAR18.87+0.303-0.627
 CESM1-FASTCHEMNSF-DOE-NCAR18.09+0.194-0.733
 CESM1-WACCMNSF-DOE-NCAR20.42+0.301-0.713
 CMCC-CESM*CMCC13.46-0.233-0.544
 CMCC-CM*CMCC12.01-0.130-0.474
 CMCC-CMS*CMCC12.53-0.224-0.506
 CNRM-CM5*CNRM-CERFACS10.63+0.002-0.487
 CNRM-CM5-2*CNRM-CERFACS13.76+0.039-0.564
 CSIRO-Mk3-6-0*CSIRO-QCCCE19.54+0.342-0.651
 EC-EARTH*EC-EARTH13.77+0.019-0.580
 FGOALS-g2LASG-CESS24.52+0.721-0.706
 FIO-ESMFIO14.04-0.160-0.645
 GFDL-CM3*NOAA GFDL20.5+0.104-0.739
 GFDL-ESM2G*NOAA GFDL18.16+0.176-0.733
 GFDL-ESM2M*NOAA GFDL20.31+0.150-0.716
 GISS-E2-H-CCNASA GISS9.49-0.103-0.275
 GISS-E2-RNASA GISS16.54-0.001-0.426
 GISS-E2-R-CCNASA GISS17.91-0.000-0.487
 HadGEM2-AONIMR/KMA15.67+0.177-0.439
 HadGEM2-CC*MOHC16.34+0.182-0.443
 HadGEM2-ES*MOHC14.49+0.143-0.387
 inmcm4INM15.4+0.230-0.216
 IPSL-CM5A-LR*IPSL9.27-0.112-0.343
 IPSL-CM5A-MR*IPSL11.93-0.062-0.483
 MIROC-ESM*MIROC11.9-0.030-0.530
 MIROC-ESM-CHEM*MIROC11.62-0.019-0.506
 MIROC5*MIROC15.89-0.036-0.648
 MPI-ESM-LR*MPI-M19.5+0.002-0.554
 MPI-ESM-MR*MPI-M15.61-0.117-0.584
 MPI-ESM-P*MPI-M18.09-0.014-0.515
 MRI-CGCM3*MRI10.36-0.006-0.327
 MRI-ESM1*MRI10.1-0.023-0.329
 NorESM1-M*NCC30.73+0.328-0.480
 NorESM1-ME*NCC31.15+0.359-0.432CMIP5 mean16.65+0.092-0.553
 SODA18.58-0.093-0.611
 GloSea5*MOHC15.87-0.086-0.620
 HadGEM3-GC2*MOHC17.61+0.020-0.653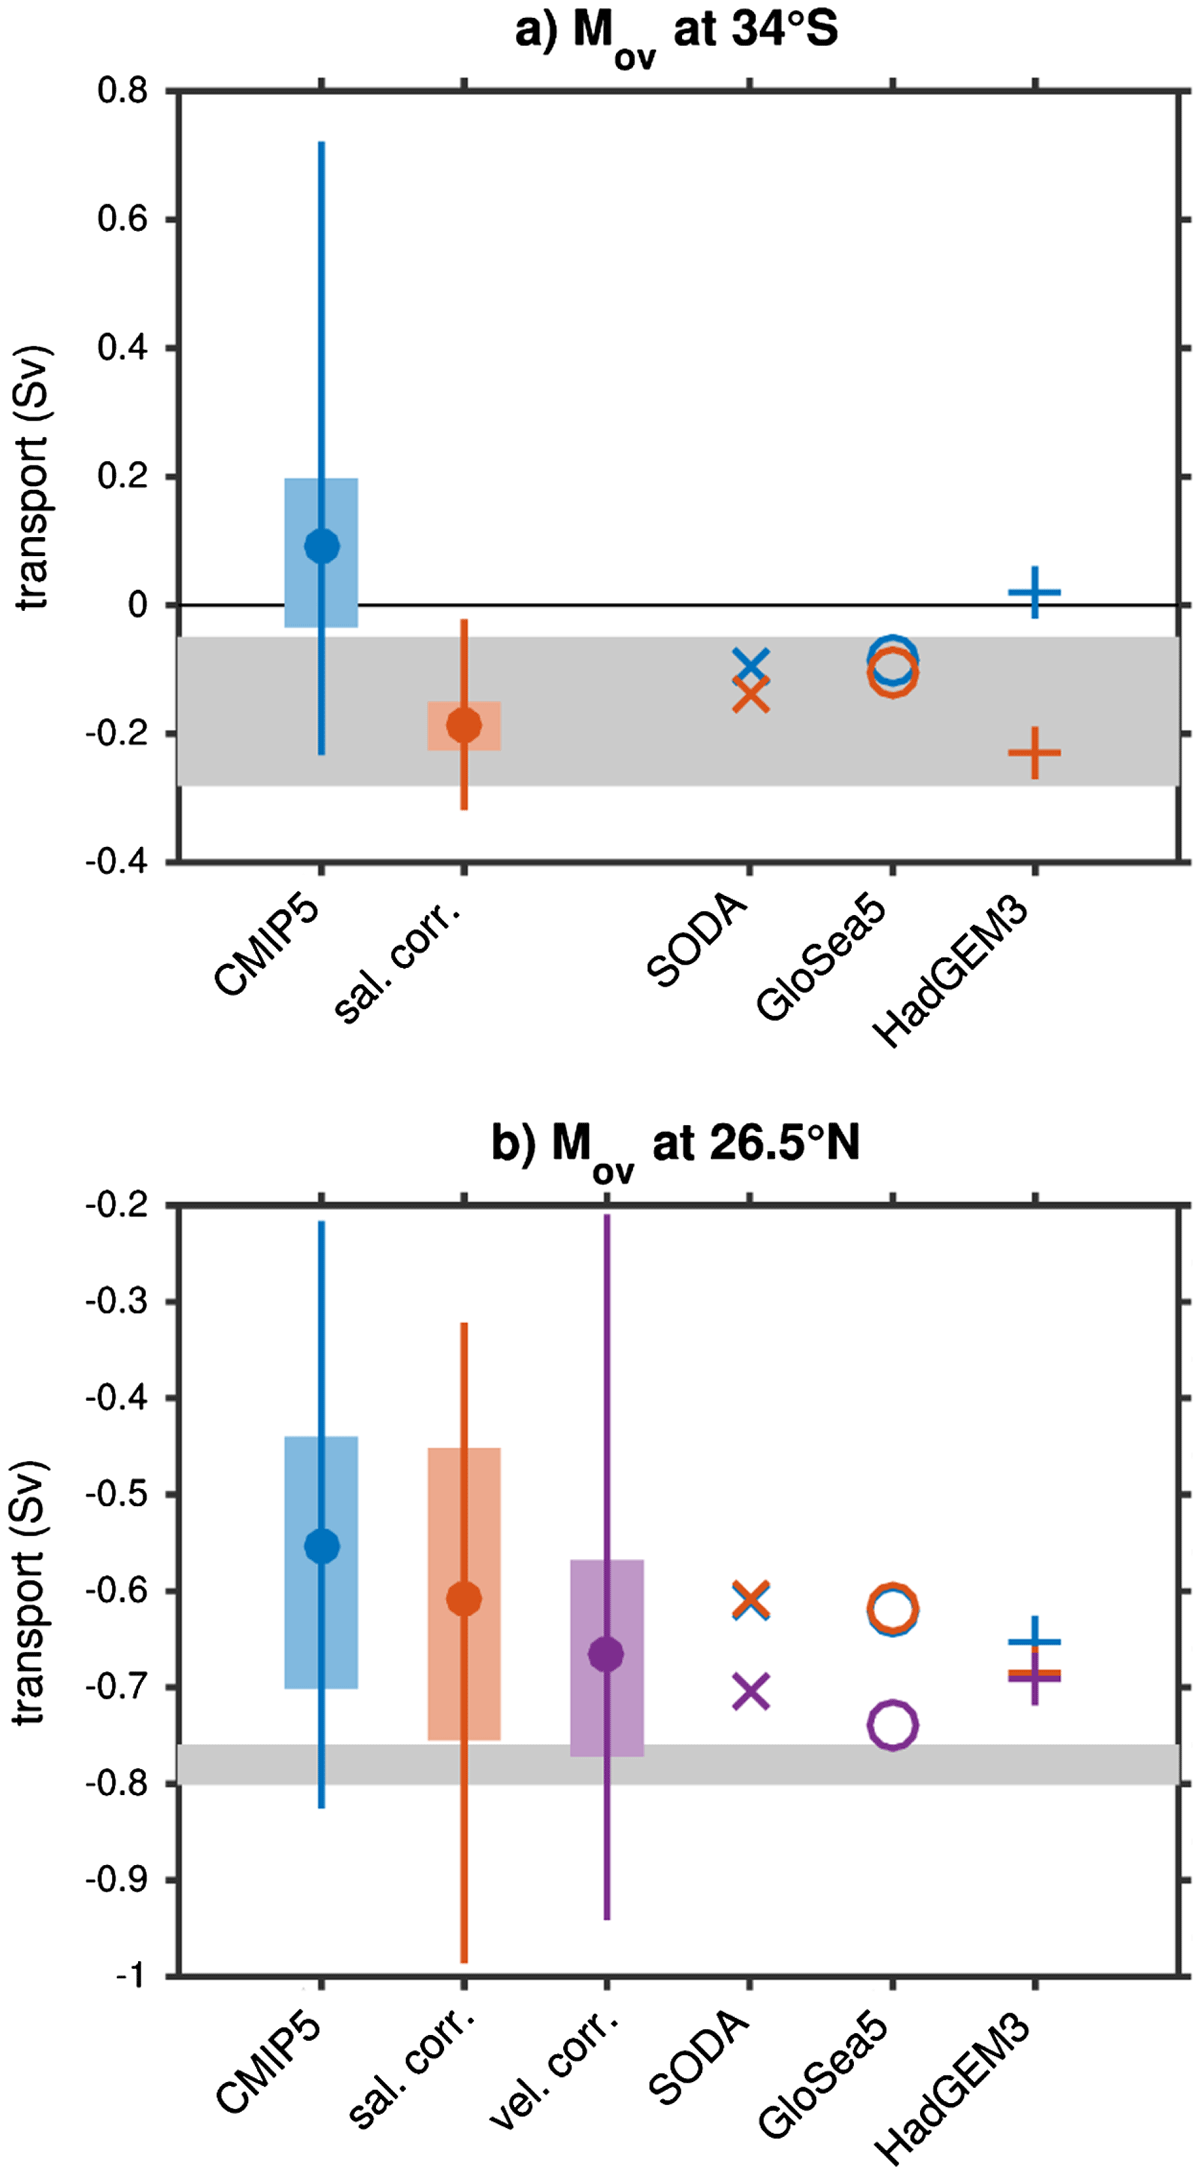
Figure 1.
The range of the values of a) at 34°S and b) at 26.5°N for the historical mean (blue), salinity bias corrected (orange) and for 26.5°N velocity bias corrected (purple). For the CMIP5 models the range of model values (vertical line), multi-model mean (dot) and the range of the models falling in the middle half (shaded box). The shading indicates the observational estimates of at 34°S as estimated by Garzoli et al. (2013) (note that other observational estimates fall within that range) and at 26.5°N as computed by McDonagh et al. (2015).
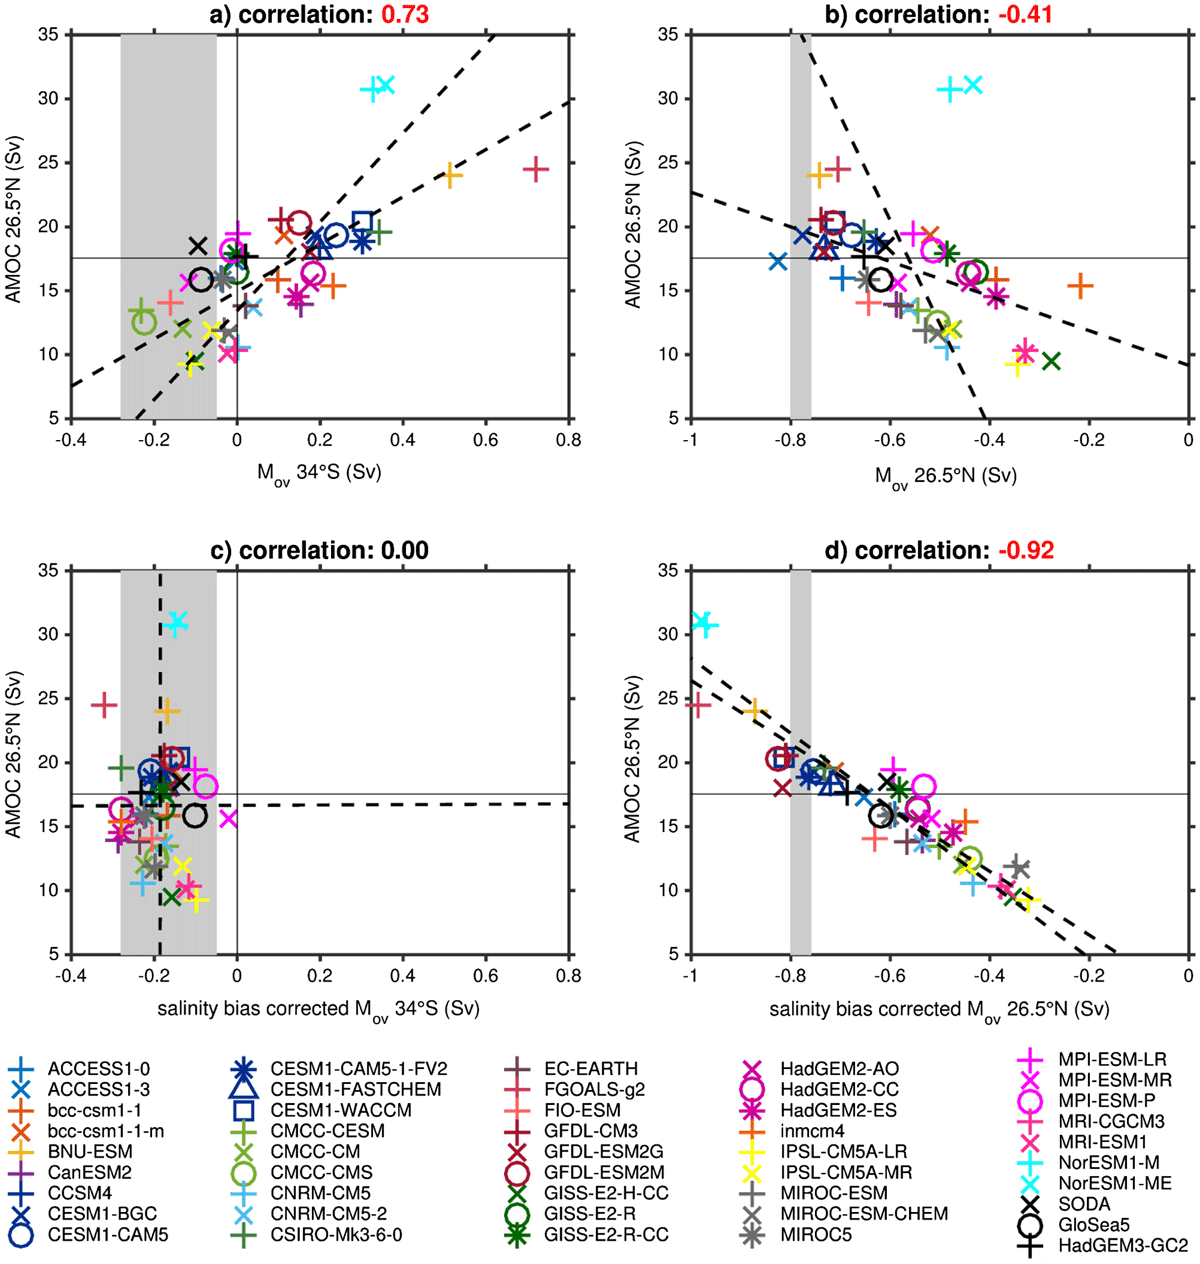
Figure 2.
Scatter plots of the strength of the AMOC at 26.5°N and a) at 34°S, b) at 26.5°N, c) salinity bias corrected at 34°S and d) salinity bias corrected at 26.5°N. For panels a) and c) shading indicates range of values of at 34°S as estimated by Garzoli et al. (2013) with the vertical black line indicating 0 Sv and in panels b) and d) shading indicates the range of values of at 26.5°N as estimated by McDonagh et al. (2015). In all the panels the horizontal black line indicates the estimated value of AMOC strength at 26.5°N by Smeed et al. (2014). In the title correlation values that are significant at the 99% level are indicated in red. The dashed lines on the figures show the lines of best fit using a least squares estimate, one line minimises the error in the vertical direction and the other in the horizontal direction. The lines of best fit are computed using the CMIP5 models only.
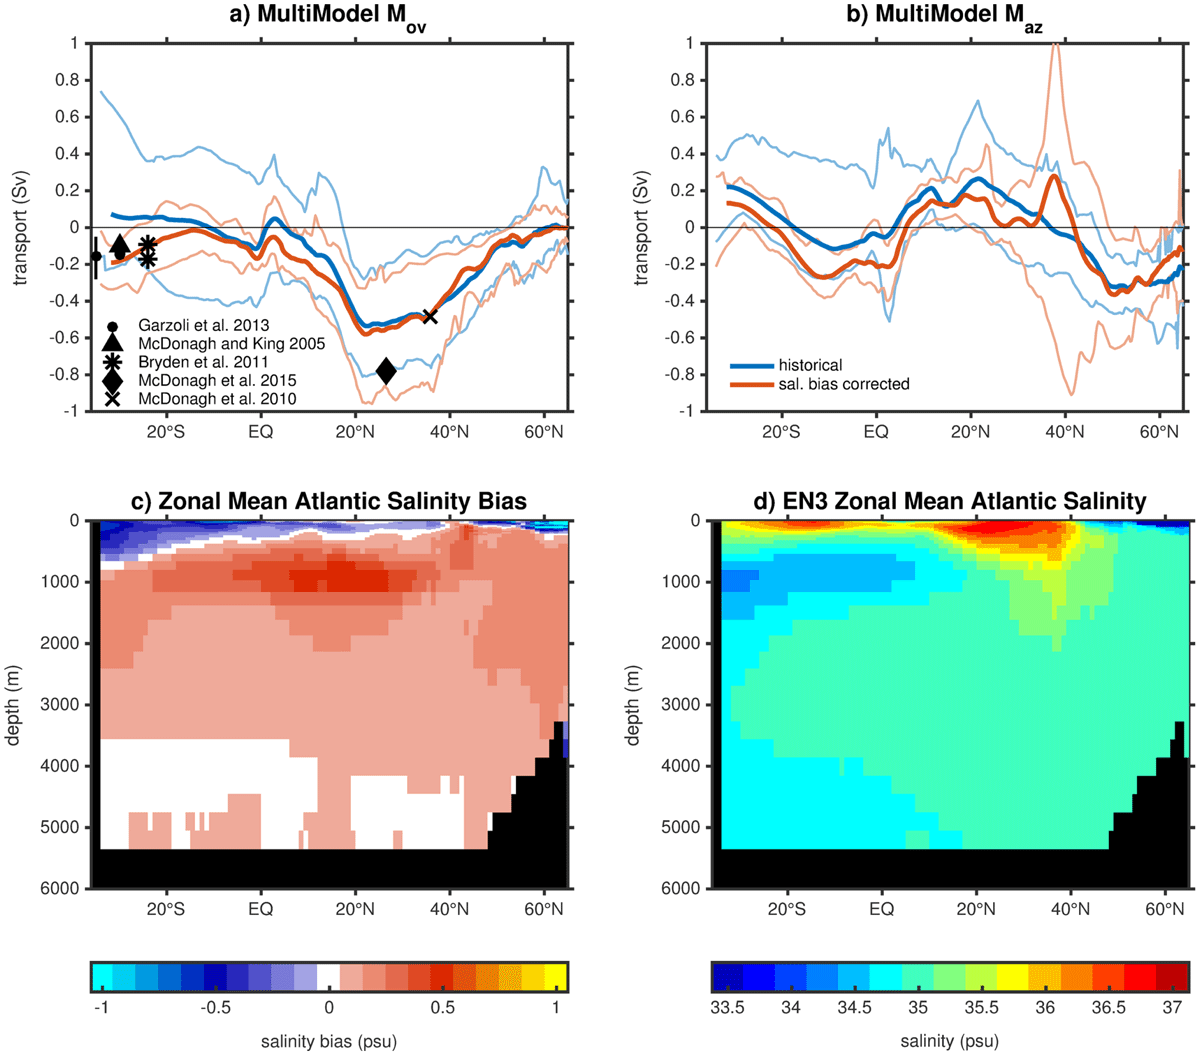
Figure 3.
Top panels show the mutli-model mean of (a) and (b) of the CMIP5 models with the thin lines indicating the range of the model values of both the historical mean (blue) and the salinity bias corrected mean (orange) with the range of the model values indicated by the thinner lighter lines of the same colour. Estimates of from observations (black): triangle based on McDonagh and King (2005); cross McDonagh et al. (2010); stars Bryden et al. (2011); circles Garzoli et al. (2013) with thevertical line representing the range in estimates; and diamond McDonagh et al. (2015). The bottom panels show (c) the multi-model mean salinity bias from the CMIP5 models for the zonal mean Atlantic salinity bias and (d) the zonal mean Atlantic salinity in the EN3 data.
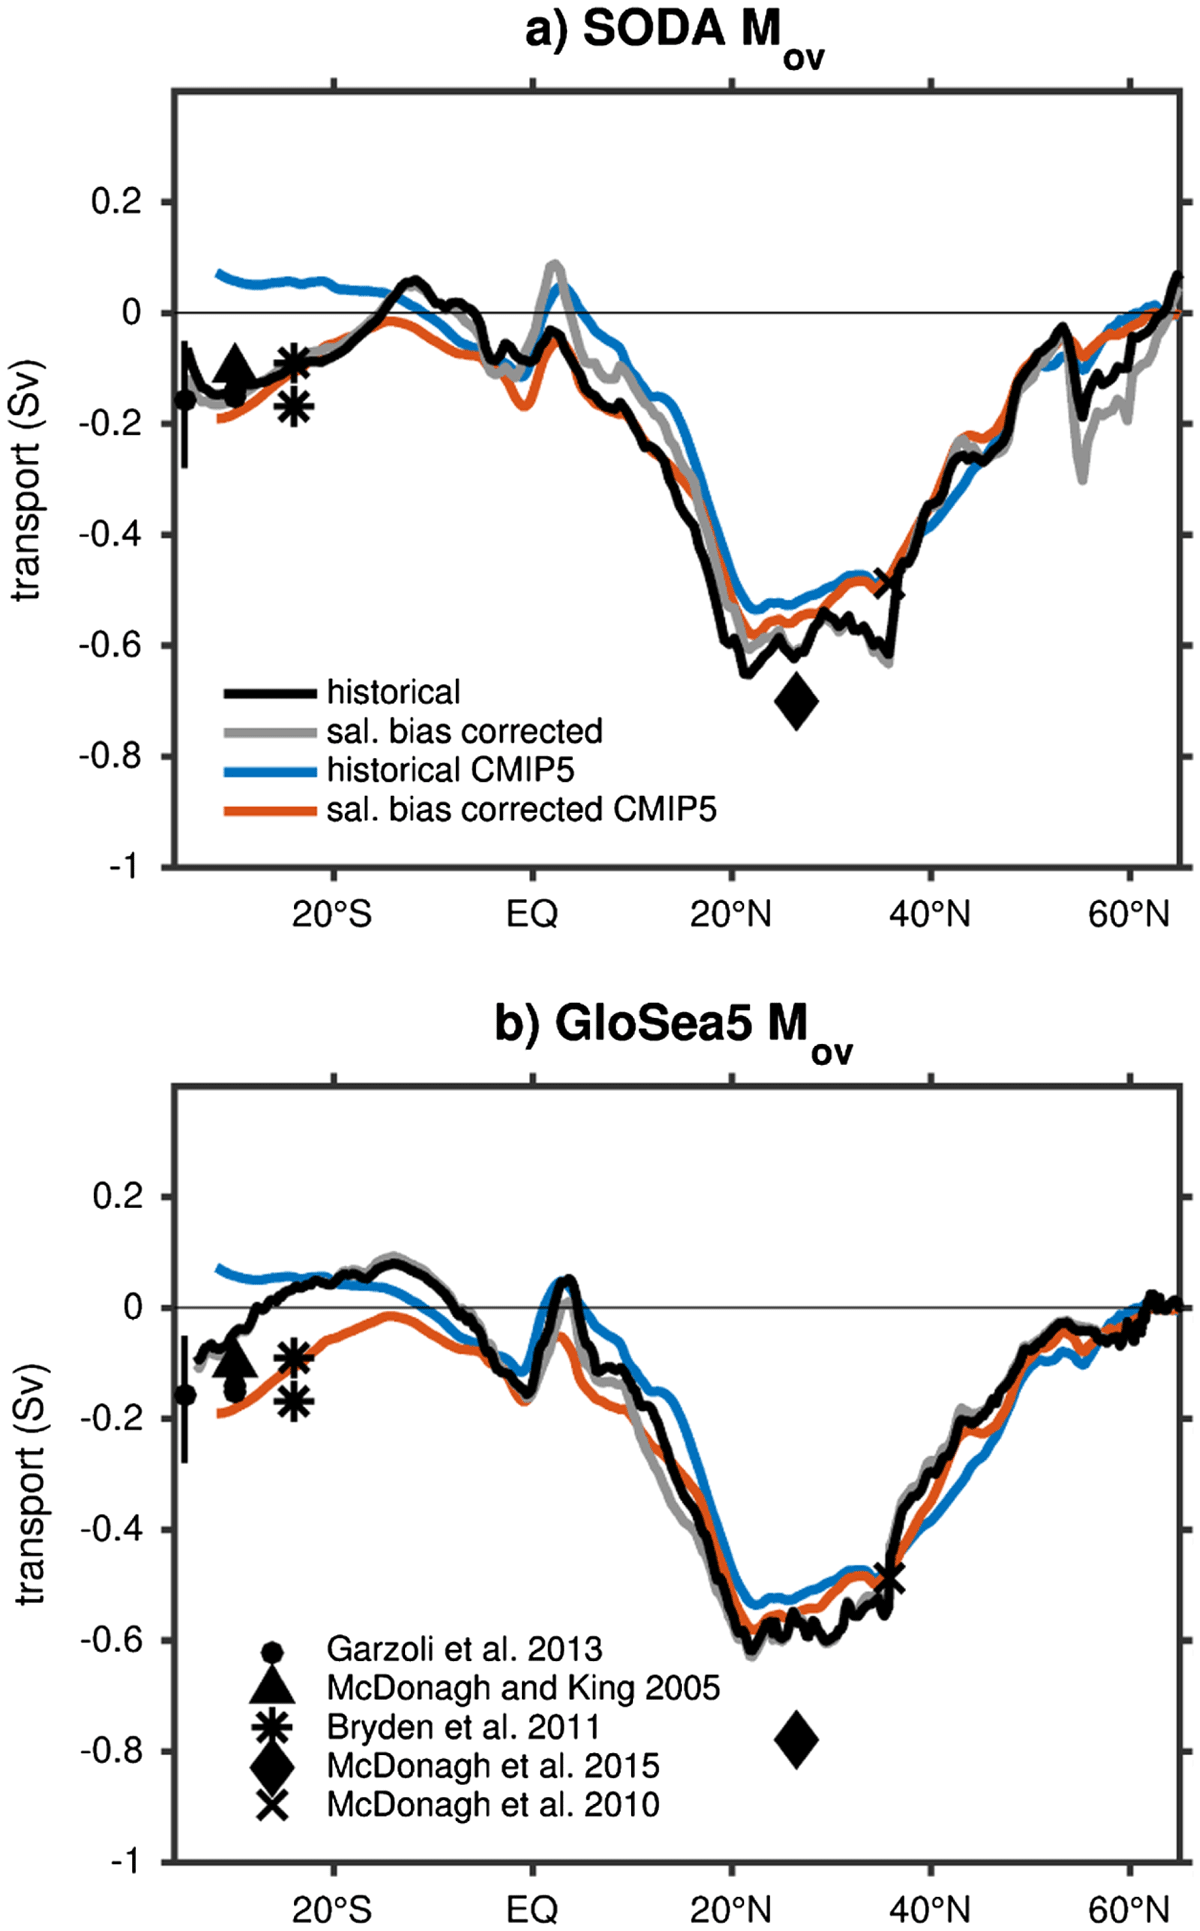
Figure 4.
The zonal values of for a) SODA and b) GloSea5 for the historical mean (black), salinity bias corrected (grey), CMIP5 multi-model mean (blue) and salinity bias corrected multi-model mean (orange). With black markers indicating the same observational estimates as used in Fig. 3.
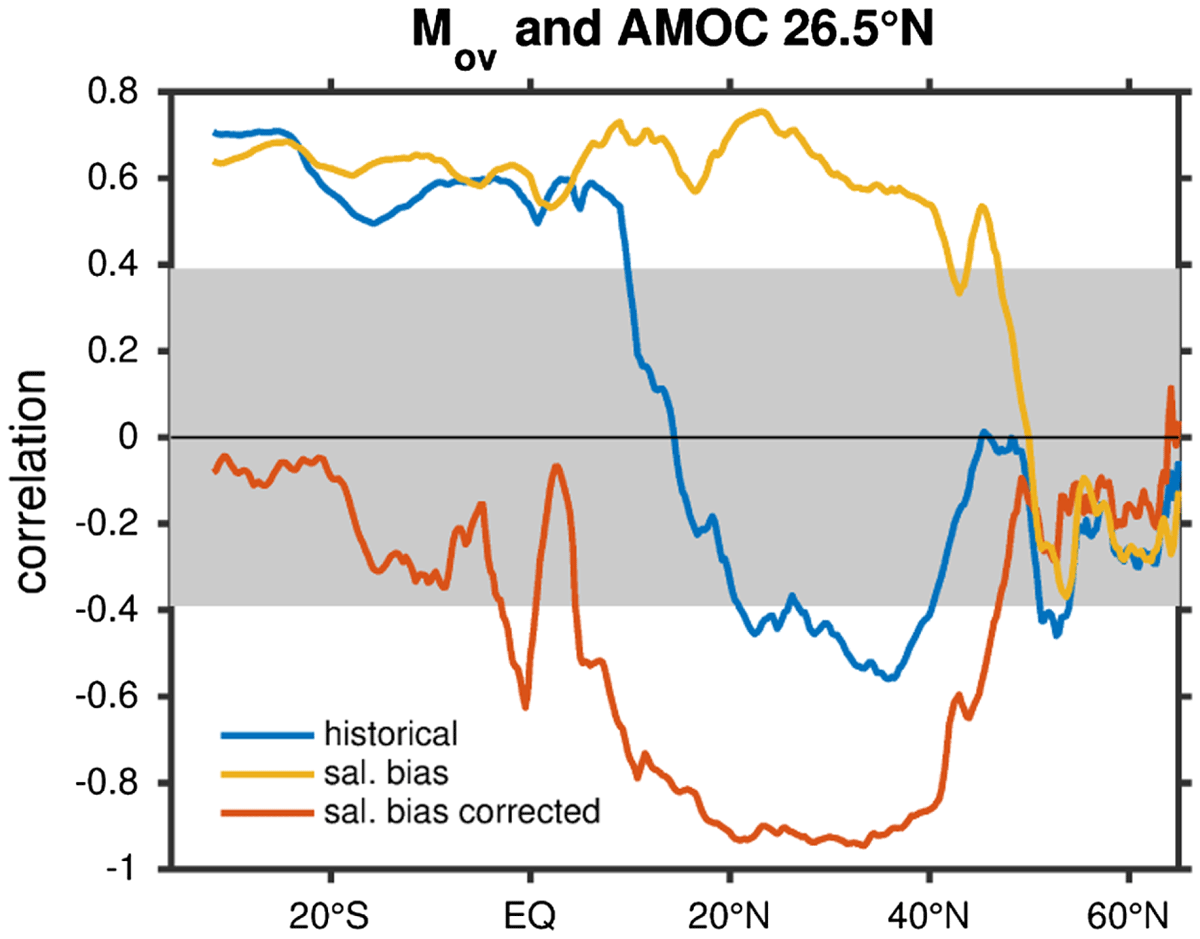
Figure 5.
Correlation of the strength of the AMOC at 26.5°N with (blue), the salinity bias corrected (orange) and the difference between the and salinity bias corrected (the correction applied to ) (yellow). Everything outside the shaded region is significant at the 99% level.
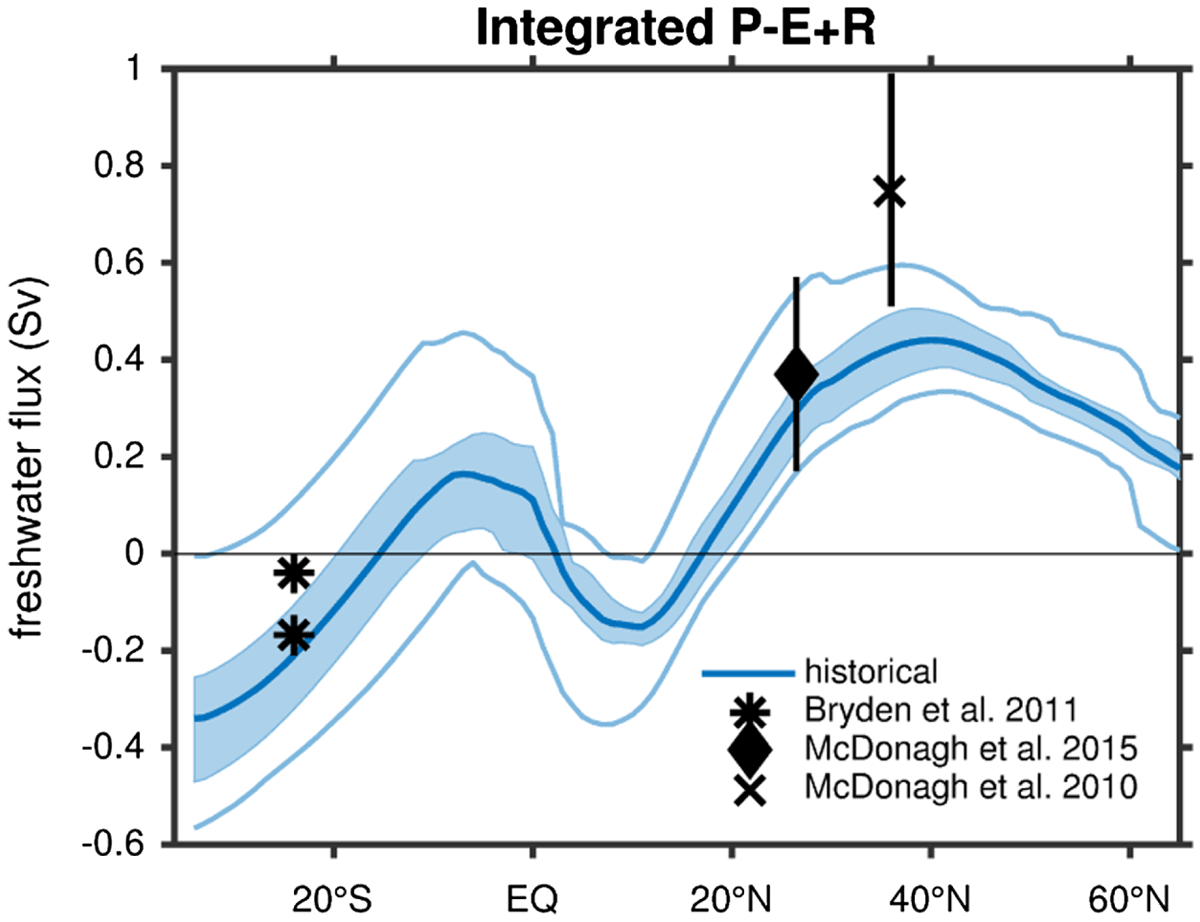
Figure 6.
Integrated upward surface freshwater fluxes starting from the Bering Strait to 34°S for the CMIP5 multi-model mean (blue line), the range of all the CMIP5 models (light blue line) and the range of the models falling in the middle half (light blue shading). Black markers indicate the observational estimates and black lines show the error bars on these estimates, where available. Only the CMIP5 models which have surface freshwater fluxes available were used in this computation (See Table 1).
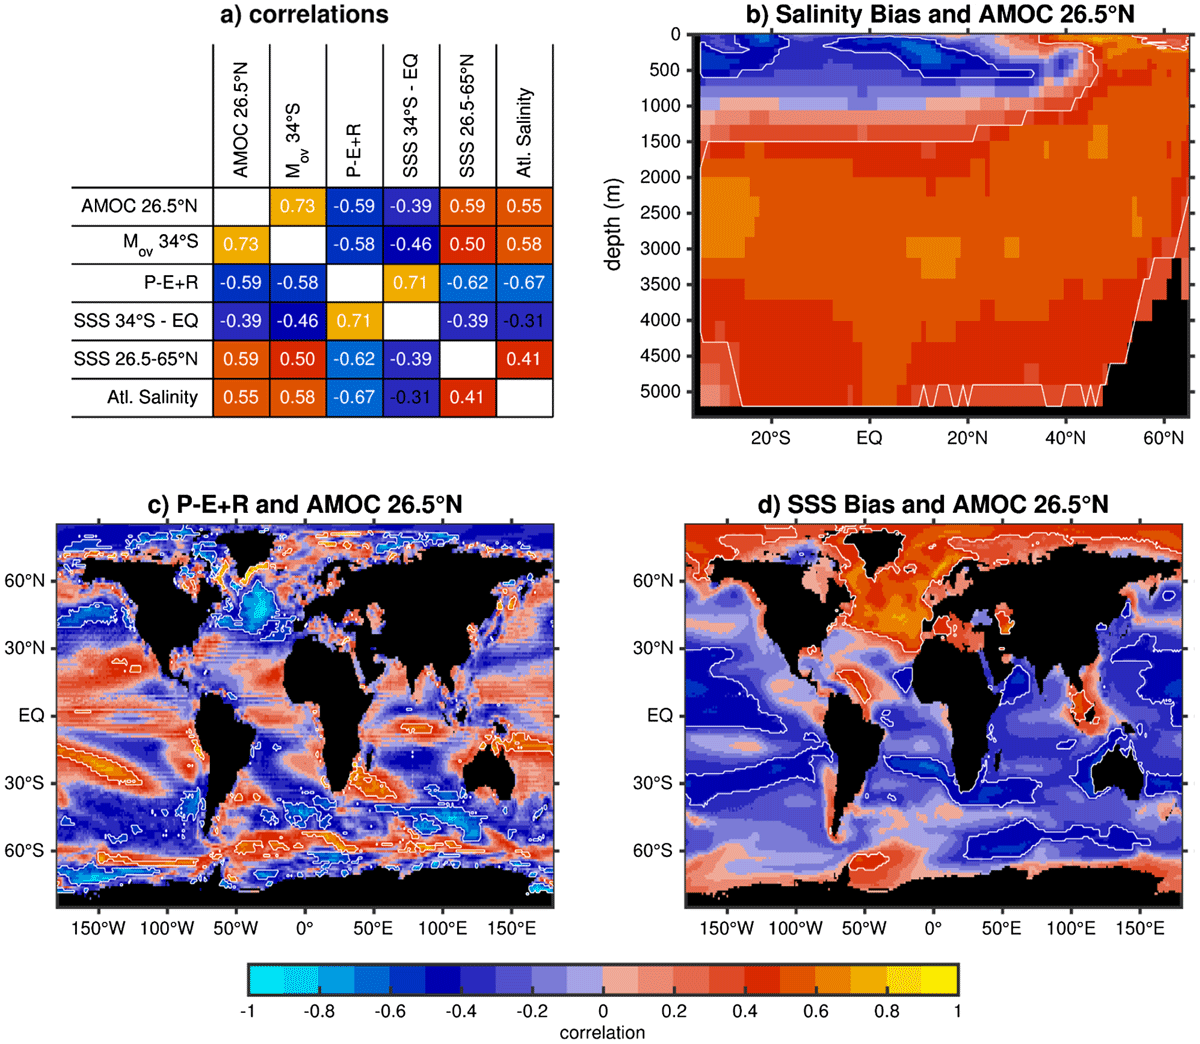
Figure 7.
(a) Correlations between AMOC at 26.5°N, at 34°S, integrated freshwater fluxes from Bering Strait to 34°S (), South Atlantic SSS bias (SSS 34°S-EQ), North Atlantic SSS bias (SSS 26.5-65°N) and salinity bias in the full depth Atlantic from 34°S-65°N (Atl. Salinity). (b–d) Spatial patterns of correlations between AMOC at 26.5°N and (b) Atlantic zonal mean salinity bias, (c) , and (d) SSS bias. Statistically significant correlations at the 99% level are circled in white (b,c,d) or written in white text (a). Only the CMIP5 models which have surface freshwater fluxes available were used to compute (See Table 1).
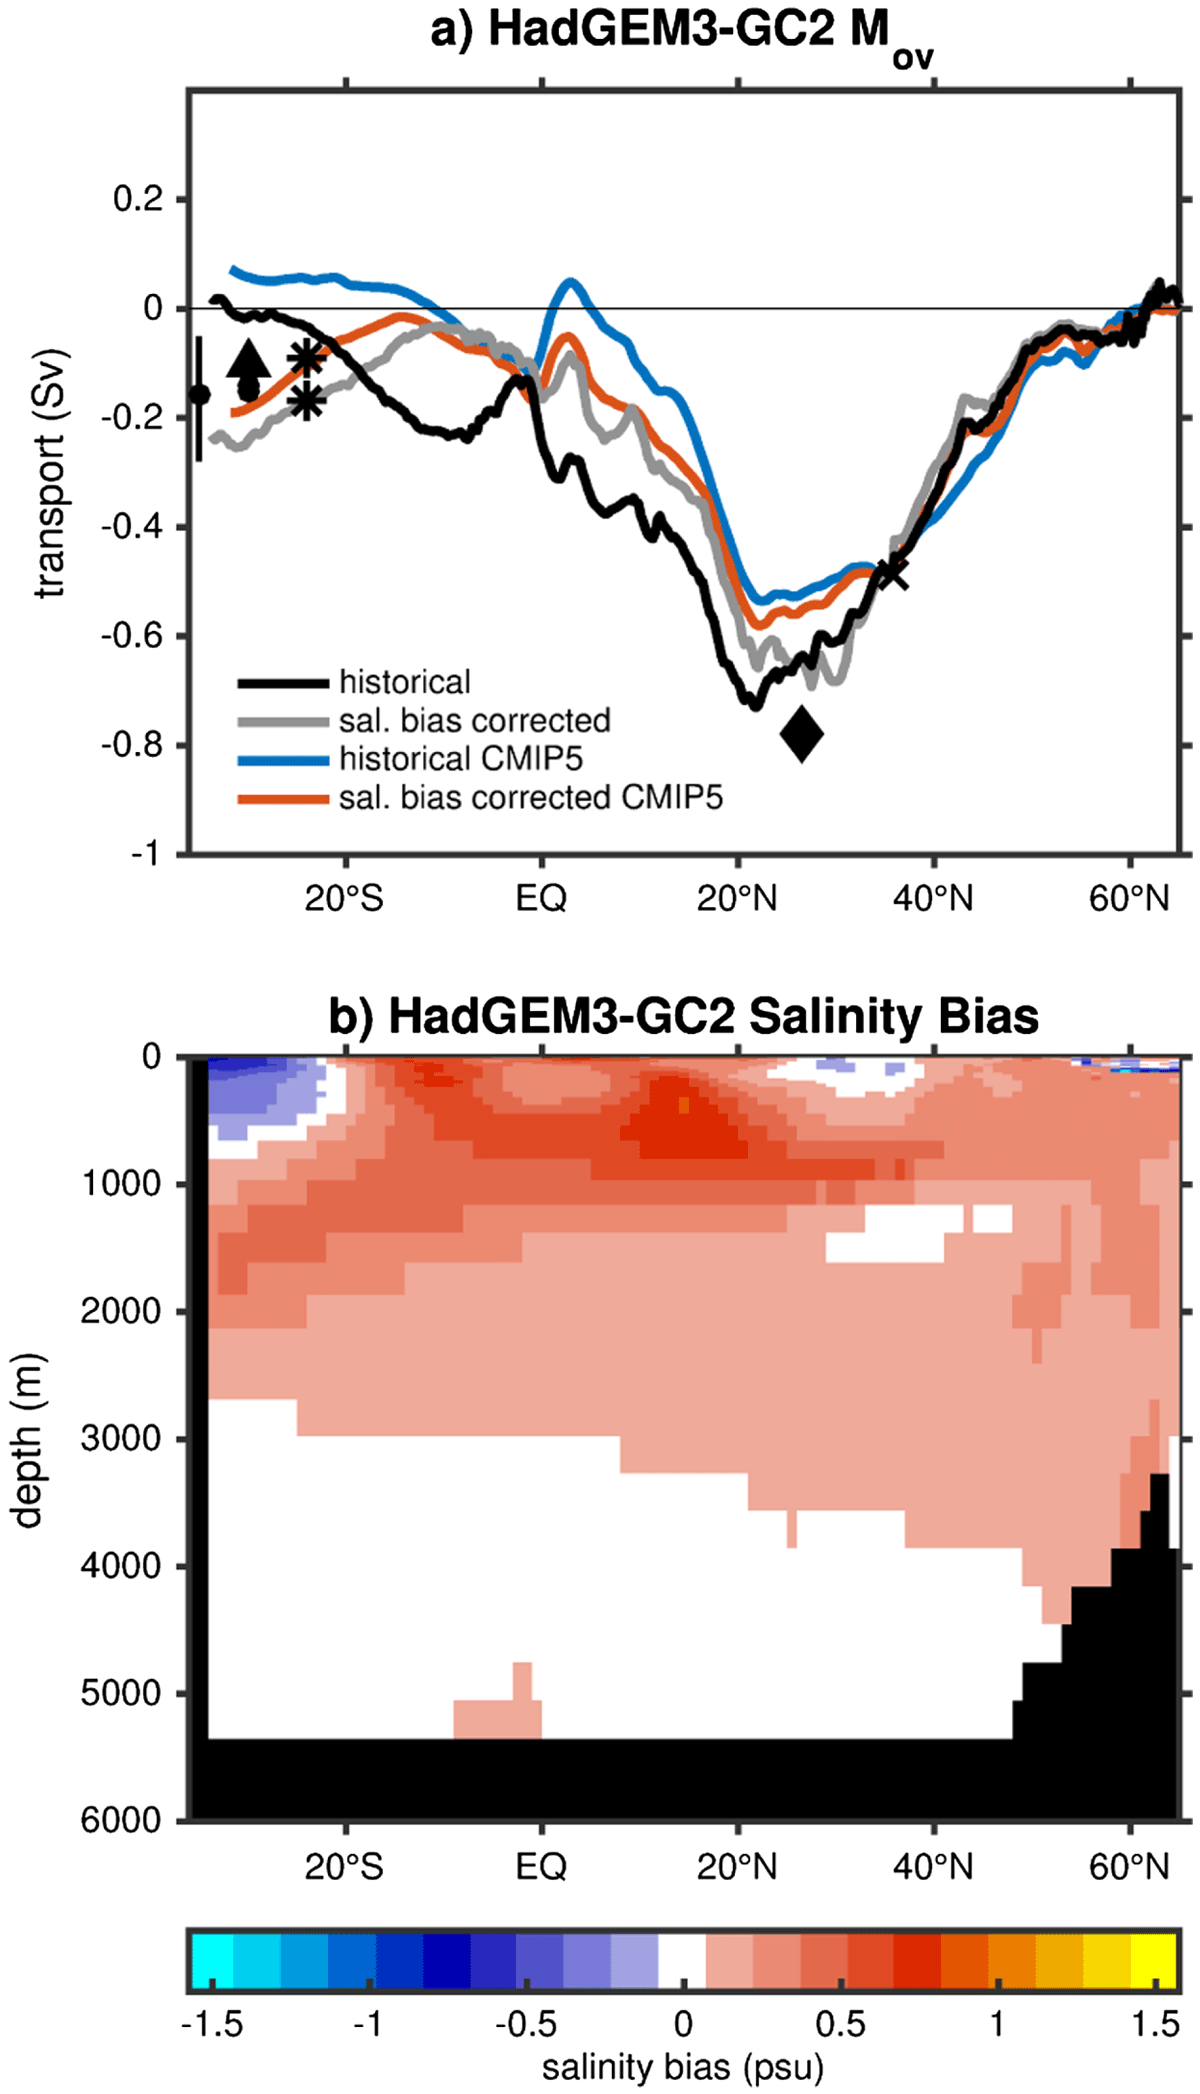
Figure 8.
(a) The zonal values of for HadGEM3-GC2 for the historical mean (black) and the salinity bias corrected values (grey), and for the CMIP5 multi-model mean (blue) and salinity bias corrected multi-model mean (orange). Black markers indicate the same observational estimates as used in Fig. 3c. The zonal mean Atlantic salinity bias in HadGEM3-GC2.
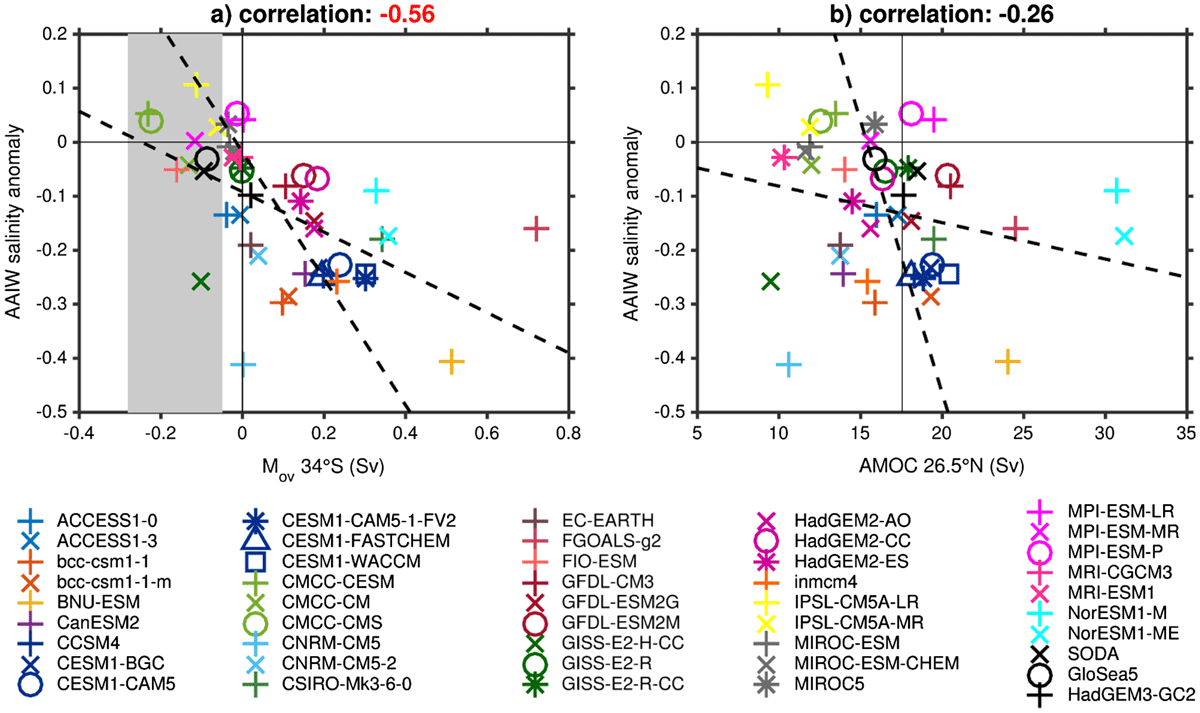
Figure 9.
Same as Fig. 9 but showing the mean salinity bias in the AAIW formation region (130°W-45°W, 60°S-50°S, upper 1000 m) and (a) at 34°S and (b) AMOC at 26.5°N.