
Table 1.
Mean Pearson correlation over all grid points between block memory and exponentially damped memory using different e-folding times for the SPI and only the e-folding time 6.6 months for PDSI.
Table 2.
Median, 90th and 95th percentiles of the distribution of maximum D-values of the Kolmogorov–Smirnov test for all locations and three block memories. The percentiles are presented for the SPI and the PDSI.
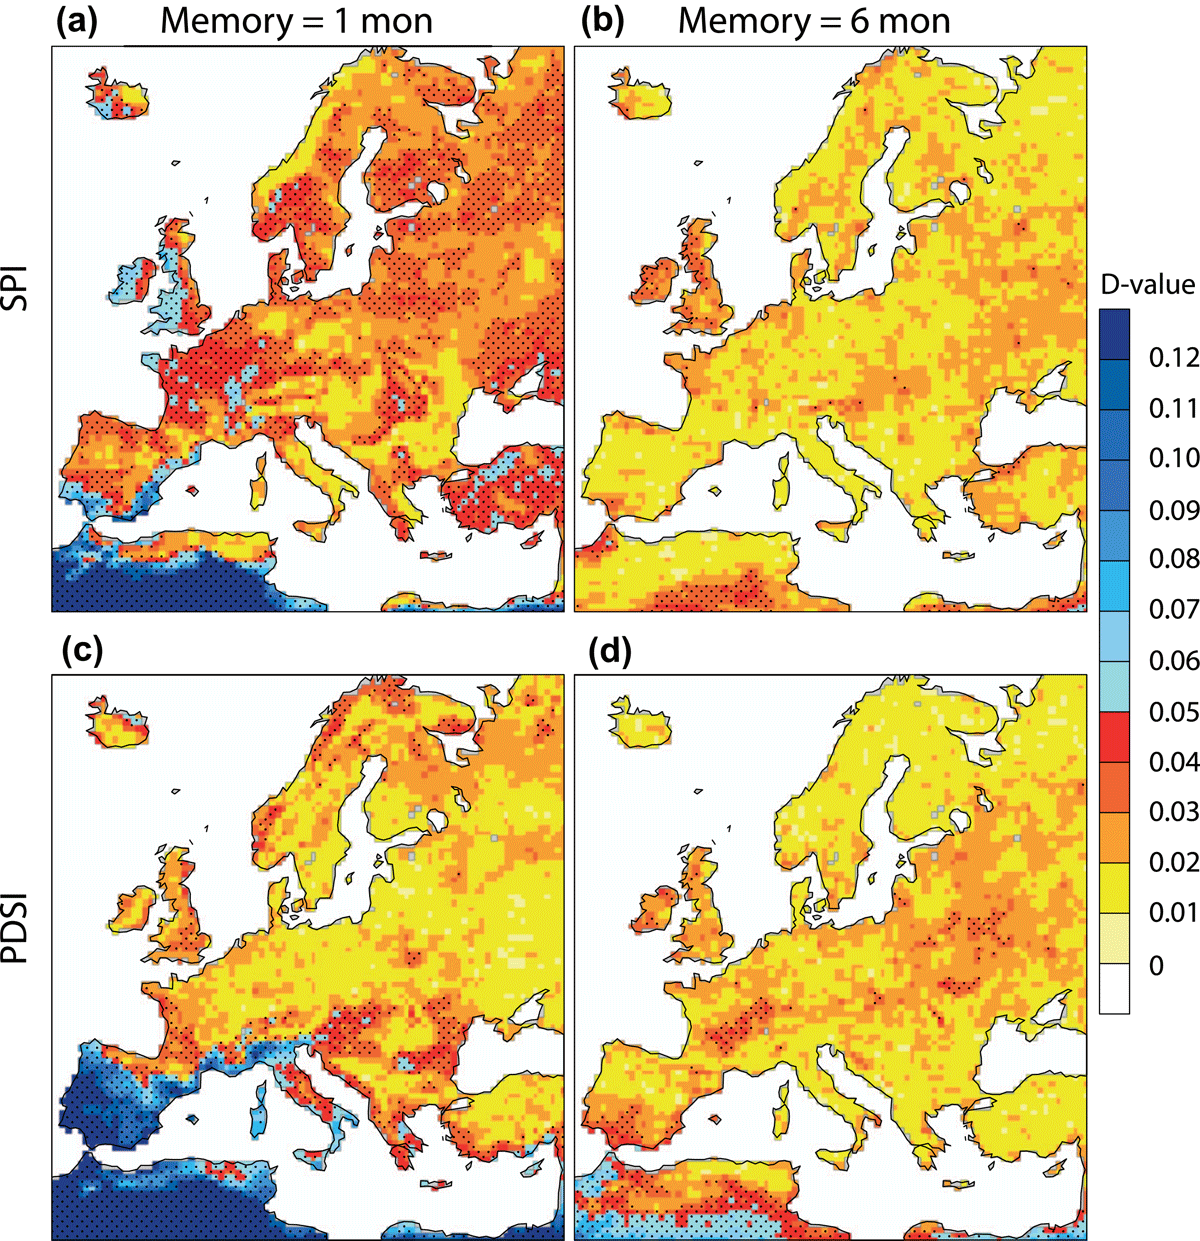
Figure 1.
Maximum distance between the empirical cumulative distribution of drought indices and the cumulative gamma distribution for January: (a), (b) SPI, (c), (d) PDSI. In panels (a), (c) a block memory of 1 month is used, in (b), (d) a block memory of 6 months. Stippling denotes the 5% significance level.
Table 3.
Error in percentile of the estimating 90th percentile of a drought index using the quantile mapping based on N values (time steps). Note that the error (95% confidence interval) is calculated based on, in which percentile a certain values falls.
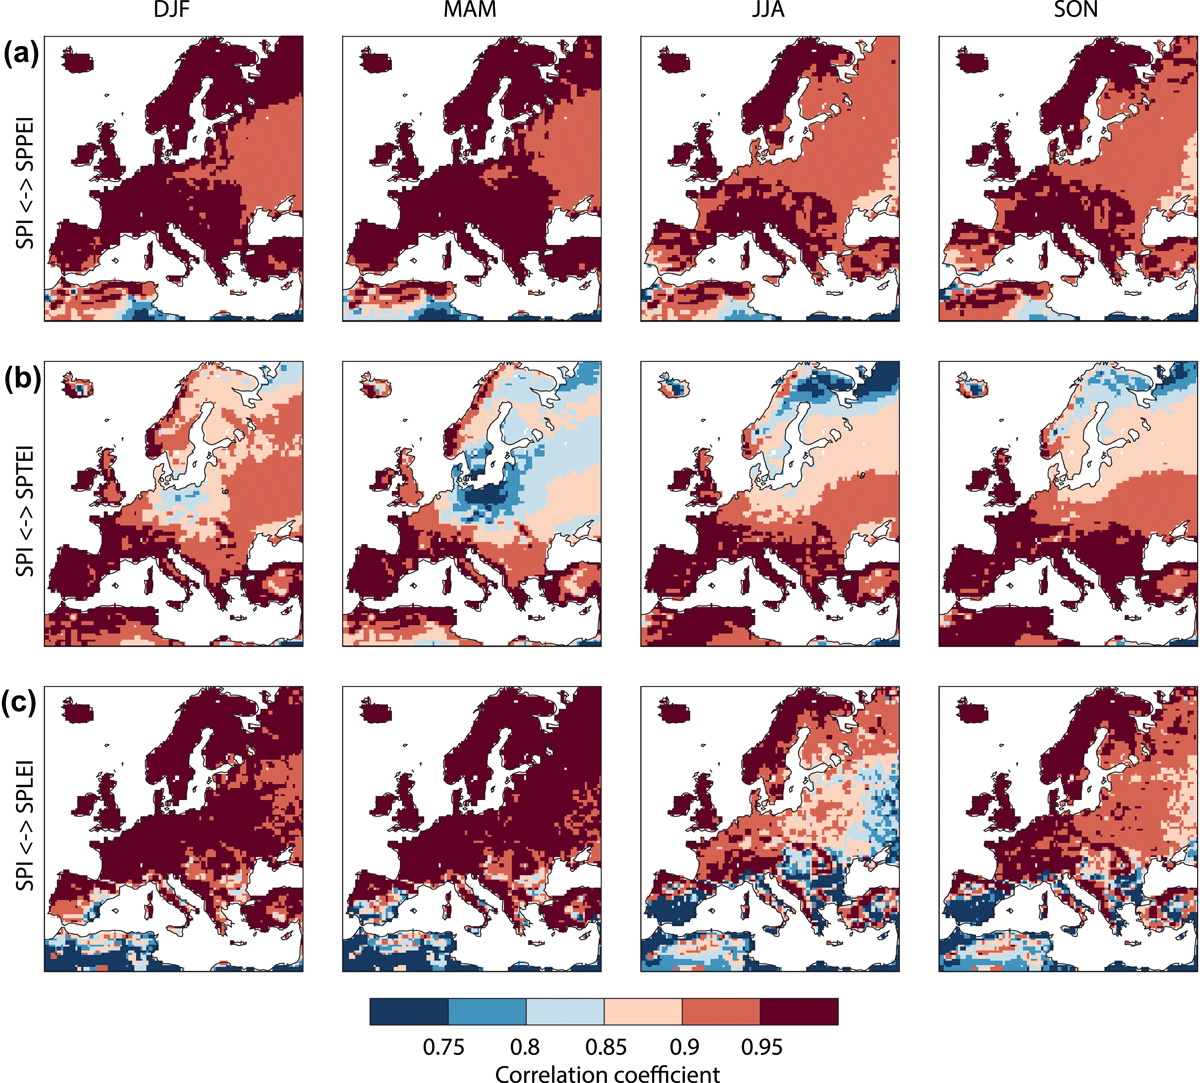
Figure 2.
Pearson correlation pattern between SPI and (a) the SPPEI, (b) the SPTEI and (c) the SPLEI for each season separately. Note that all correlations are significant at the 1% level.
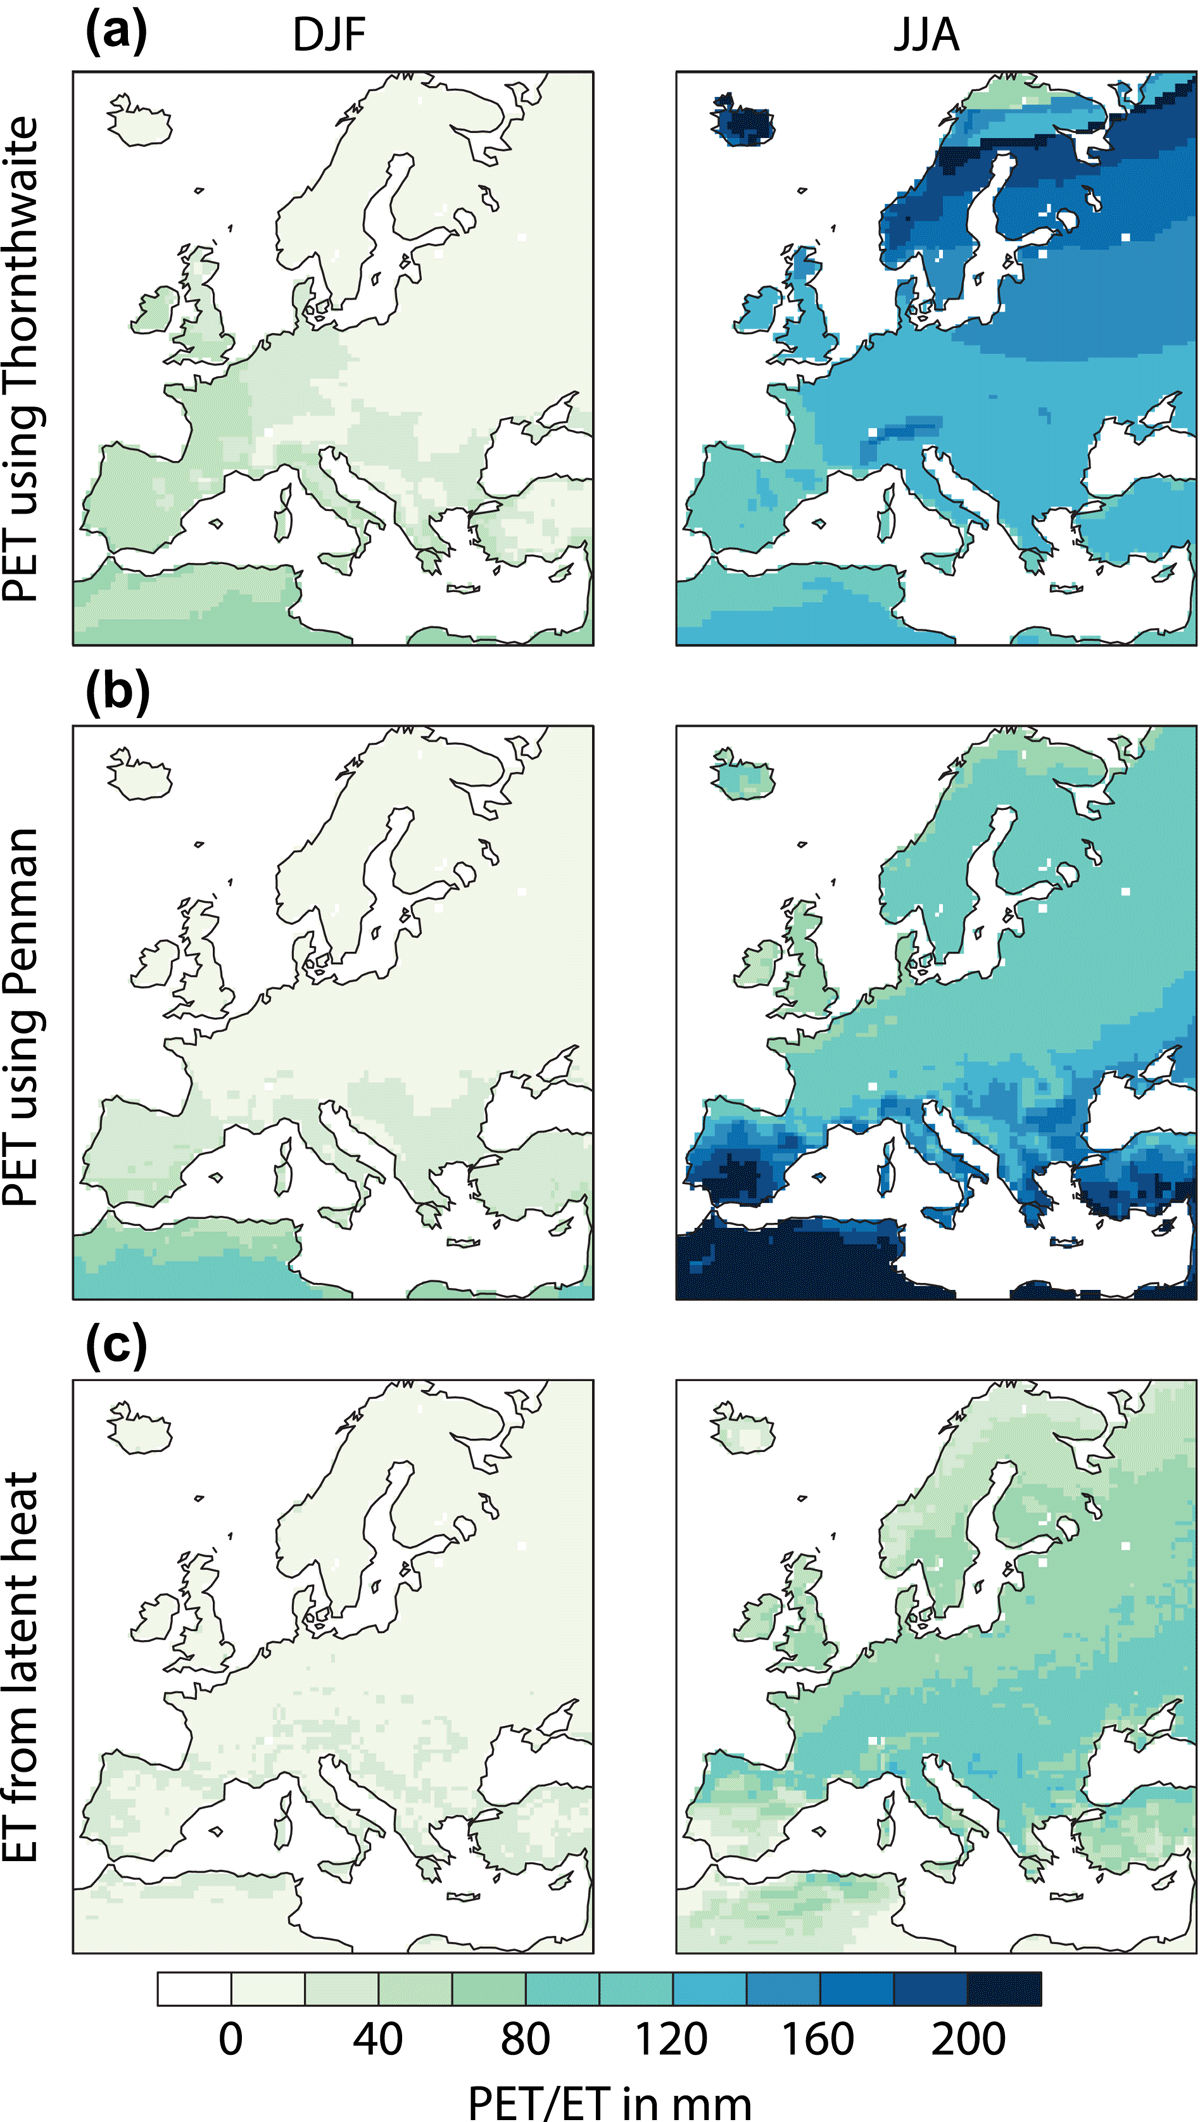
Figure 3.
Potential evapotranspiration for winter (DJF) and summer (JJA) using (a) the method of Thornthwaite, (b) the method of Penman and (c) the evapotranspiration for both seasons, which is approximated by the latent heat flux.
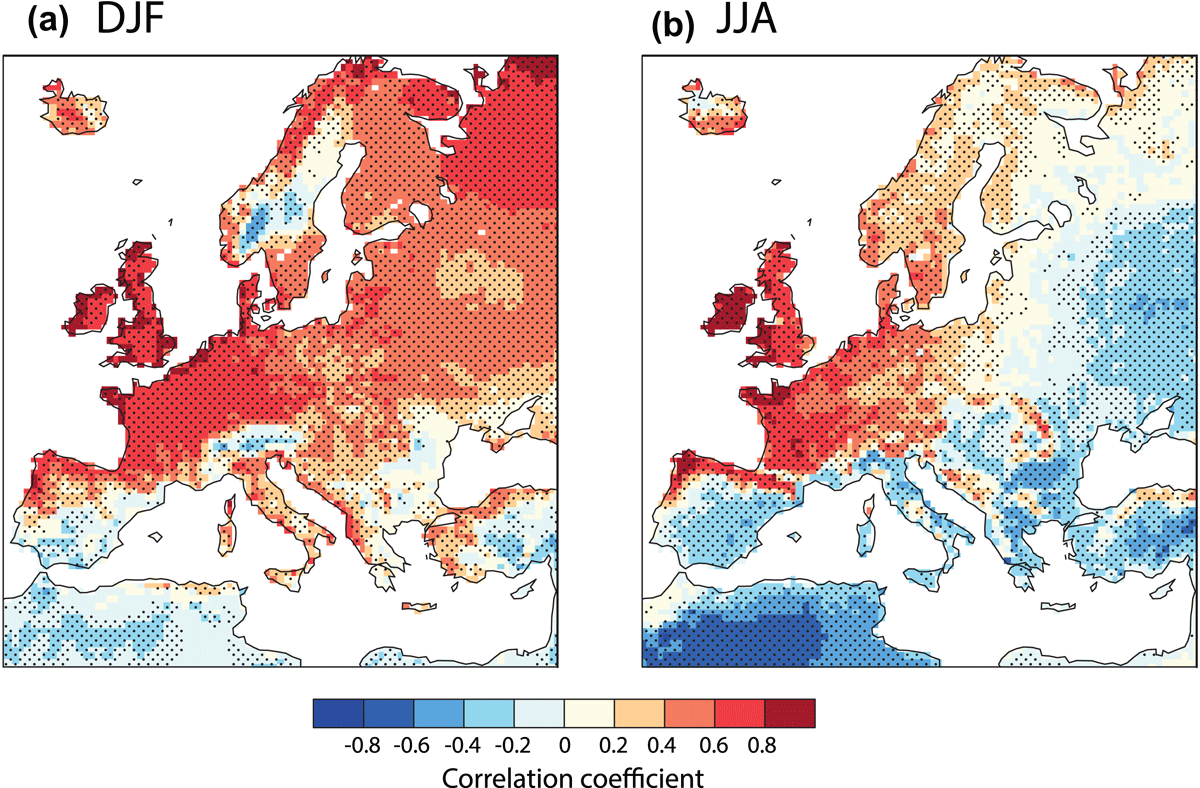
Figure 4.
Pearson correlation pattern between the potential evapotranspiration based on Penman and the evapotranspiration approximated by the latent heat flux: (a) DJF and (b) JJA. Note that the potential evapotranspiration based on Penman is renormalized (see details in the text). Stippling denotes the 1% significance level.
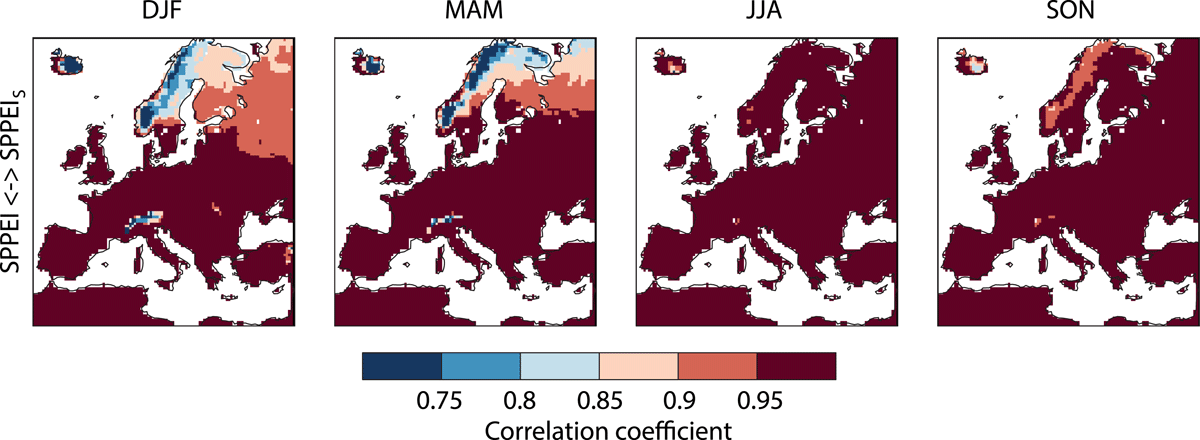
Figure 5.
Pearson correlation pattern between drought indices SPPEI and the SPPEIs, the latter includes snow effects. Note that all correlations are significant at the 1% level.
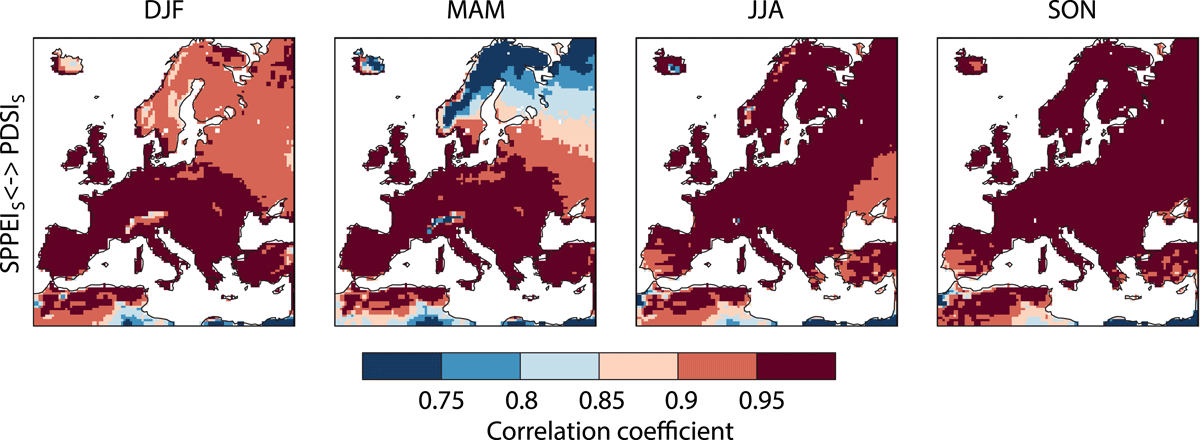
Figure 6.
As Fig. 5, but showing the correlation between SPPEIs including snow effects and an index which additionally includes Run-off in the water balance (PDSIs). Note that all correlations are significant at the 1% level.
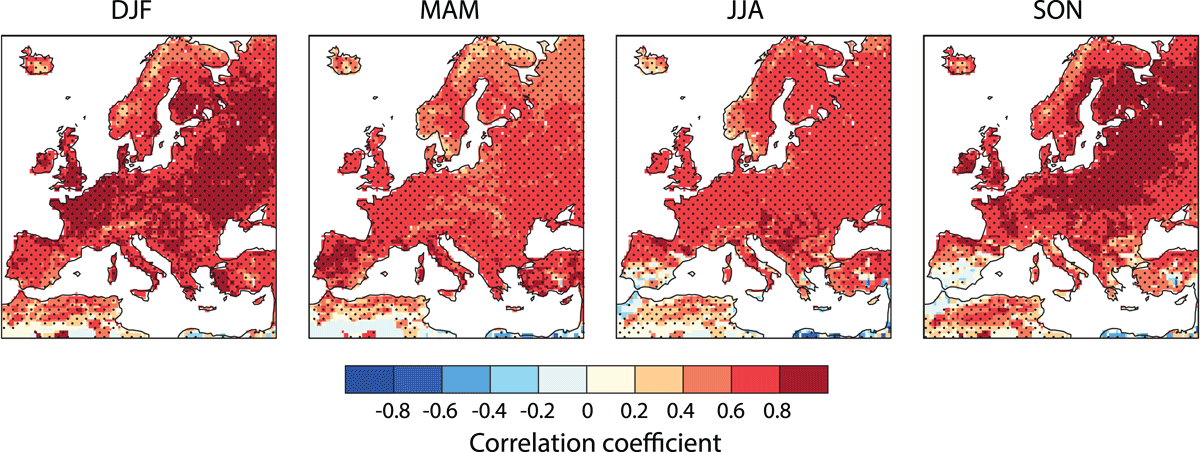
Figure 7.
Pearson correlation pattern between PDSIs and soil moisture. Note that the soil moisture is averaged over 3 months, which shows the highest correlation to PDSIs. Stippling denotes the 1% significance level.
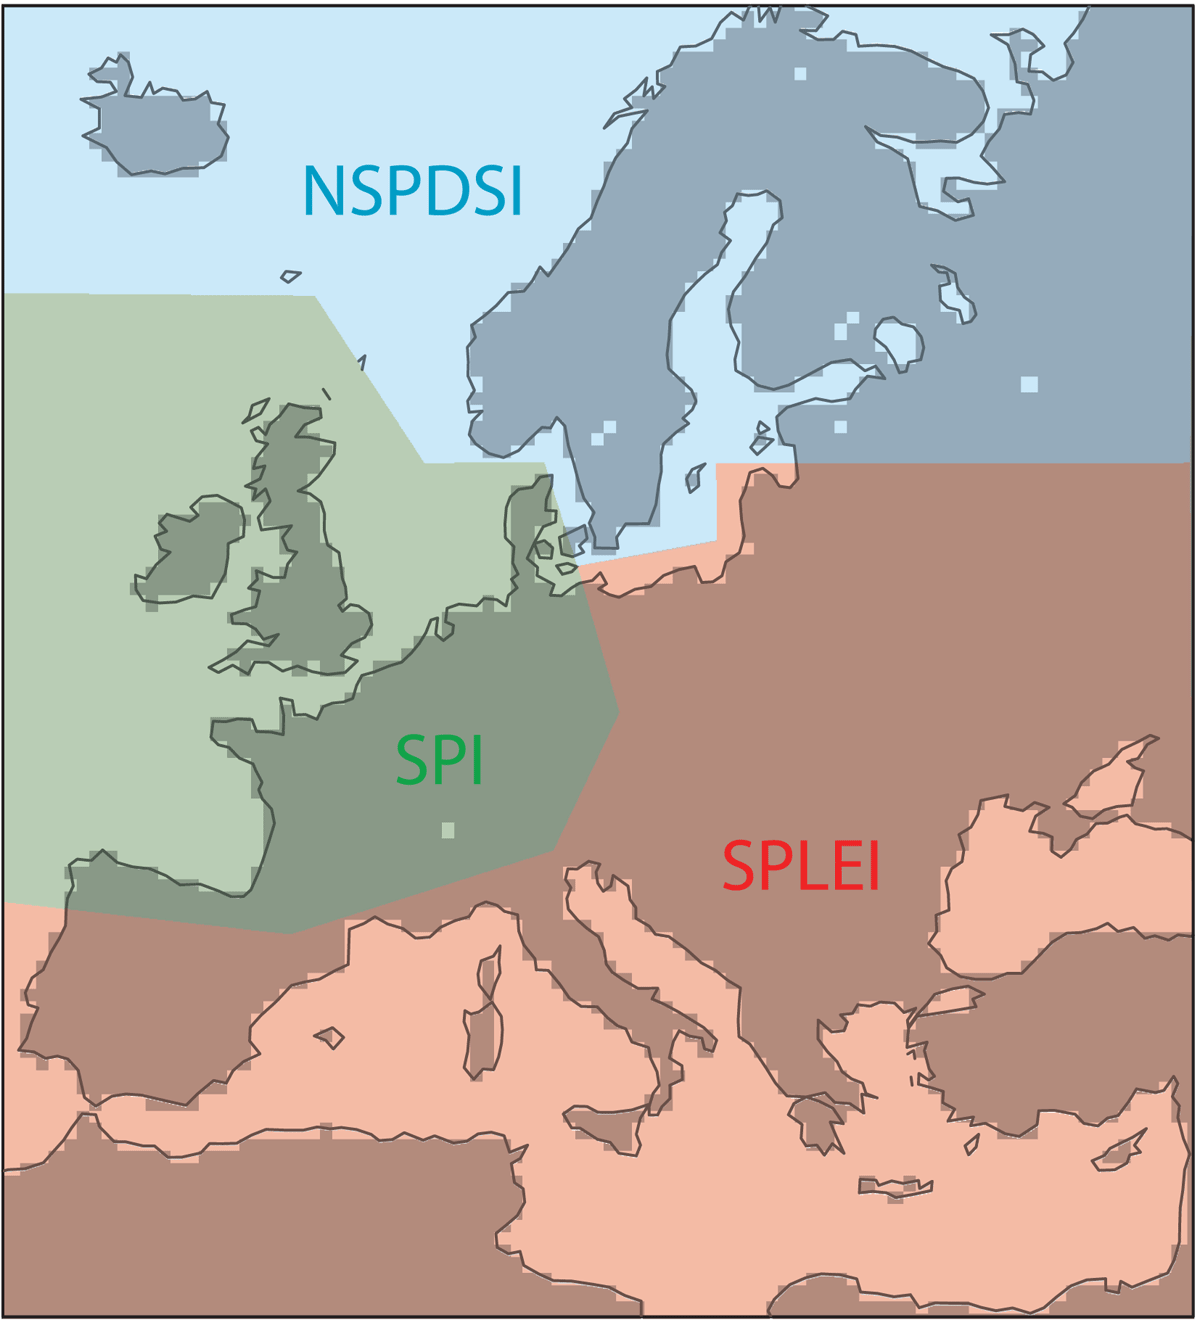
Figure 8.
Schematic overview of Europe illustrating which drought indices is appropriate, based on the correlation patterns of Figs. 2, 5, and 6.