Have a personal or library account? Click to login
What the collapse of the ensemble Kalman filter tells us about particle filters Cover

What the collapse of the ensemble Kalman filter tells us about particle filters

Open Access
|Jan 2017

Figures & Tables

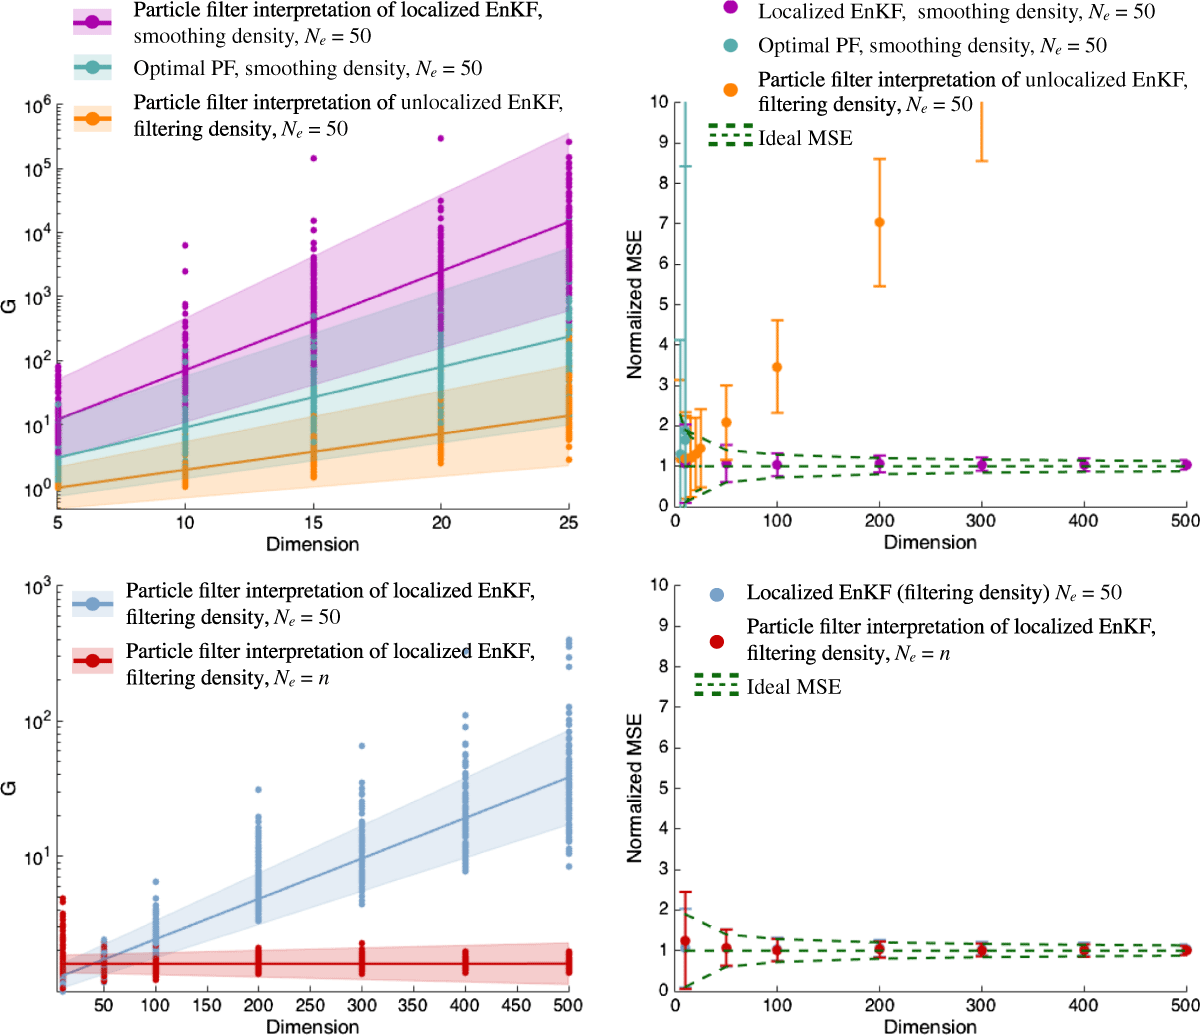
Figure 1.

Left: quality measure G as a function of the dimension for the various methods. Shown are the values of G for each experiment (dots) along with log-linear least-squares fits (straight lines) and one standard deviation confidence intervals (shaded regions). Right: normalized MSE as a function of the dimension for the various methods. Shown are the mean (dots) and confidence intervals (error bars) computed from 100 numerical experiments. Also shown (dashed lines) is the mean and two standard deviation confidence intervals of the ideal MSE (dashed green).

Language: English
Page range: 1283809 - 1283809
Submitted on: May 31, 2016
Accepted on: Dec 19, 2016
Published on: Jan 1, 2017
Published by: Stockholm University Press
In partnership with: Paradigm Publishing Services

© 2017 Matthias Morzfeld, Daniel Hodyss, Chris Snyder, published by Stockholm University Press
This work is licensed under the Creative Commons Attribution 4.0 License.