
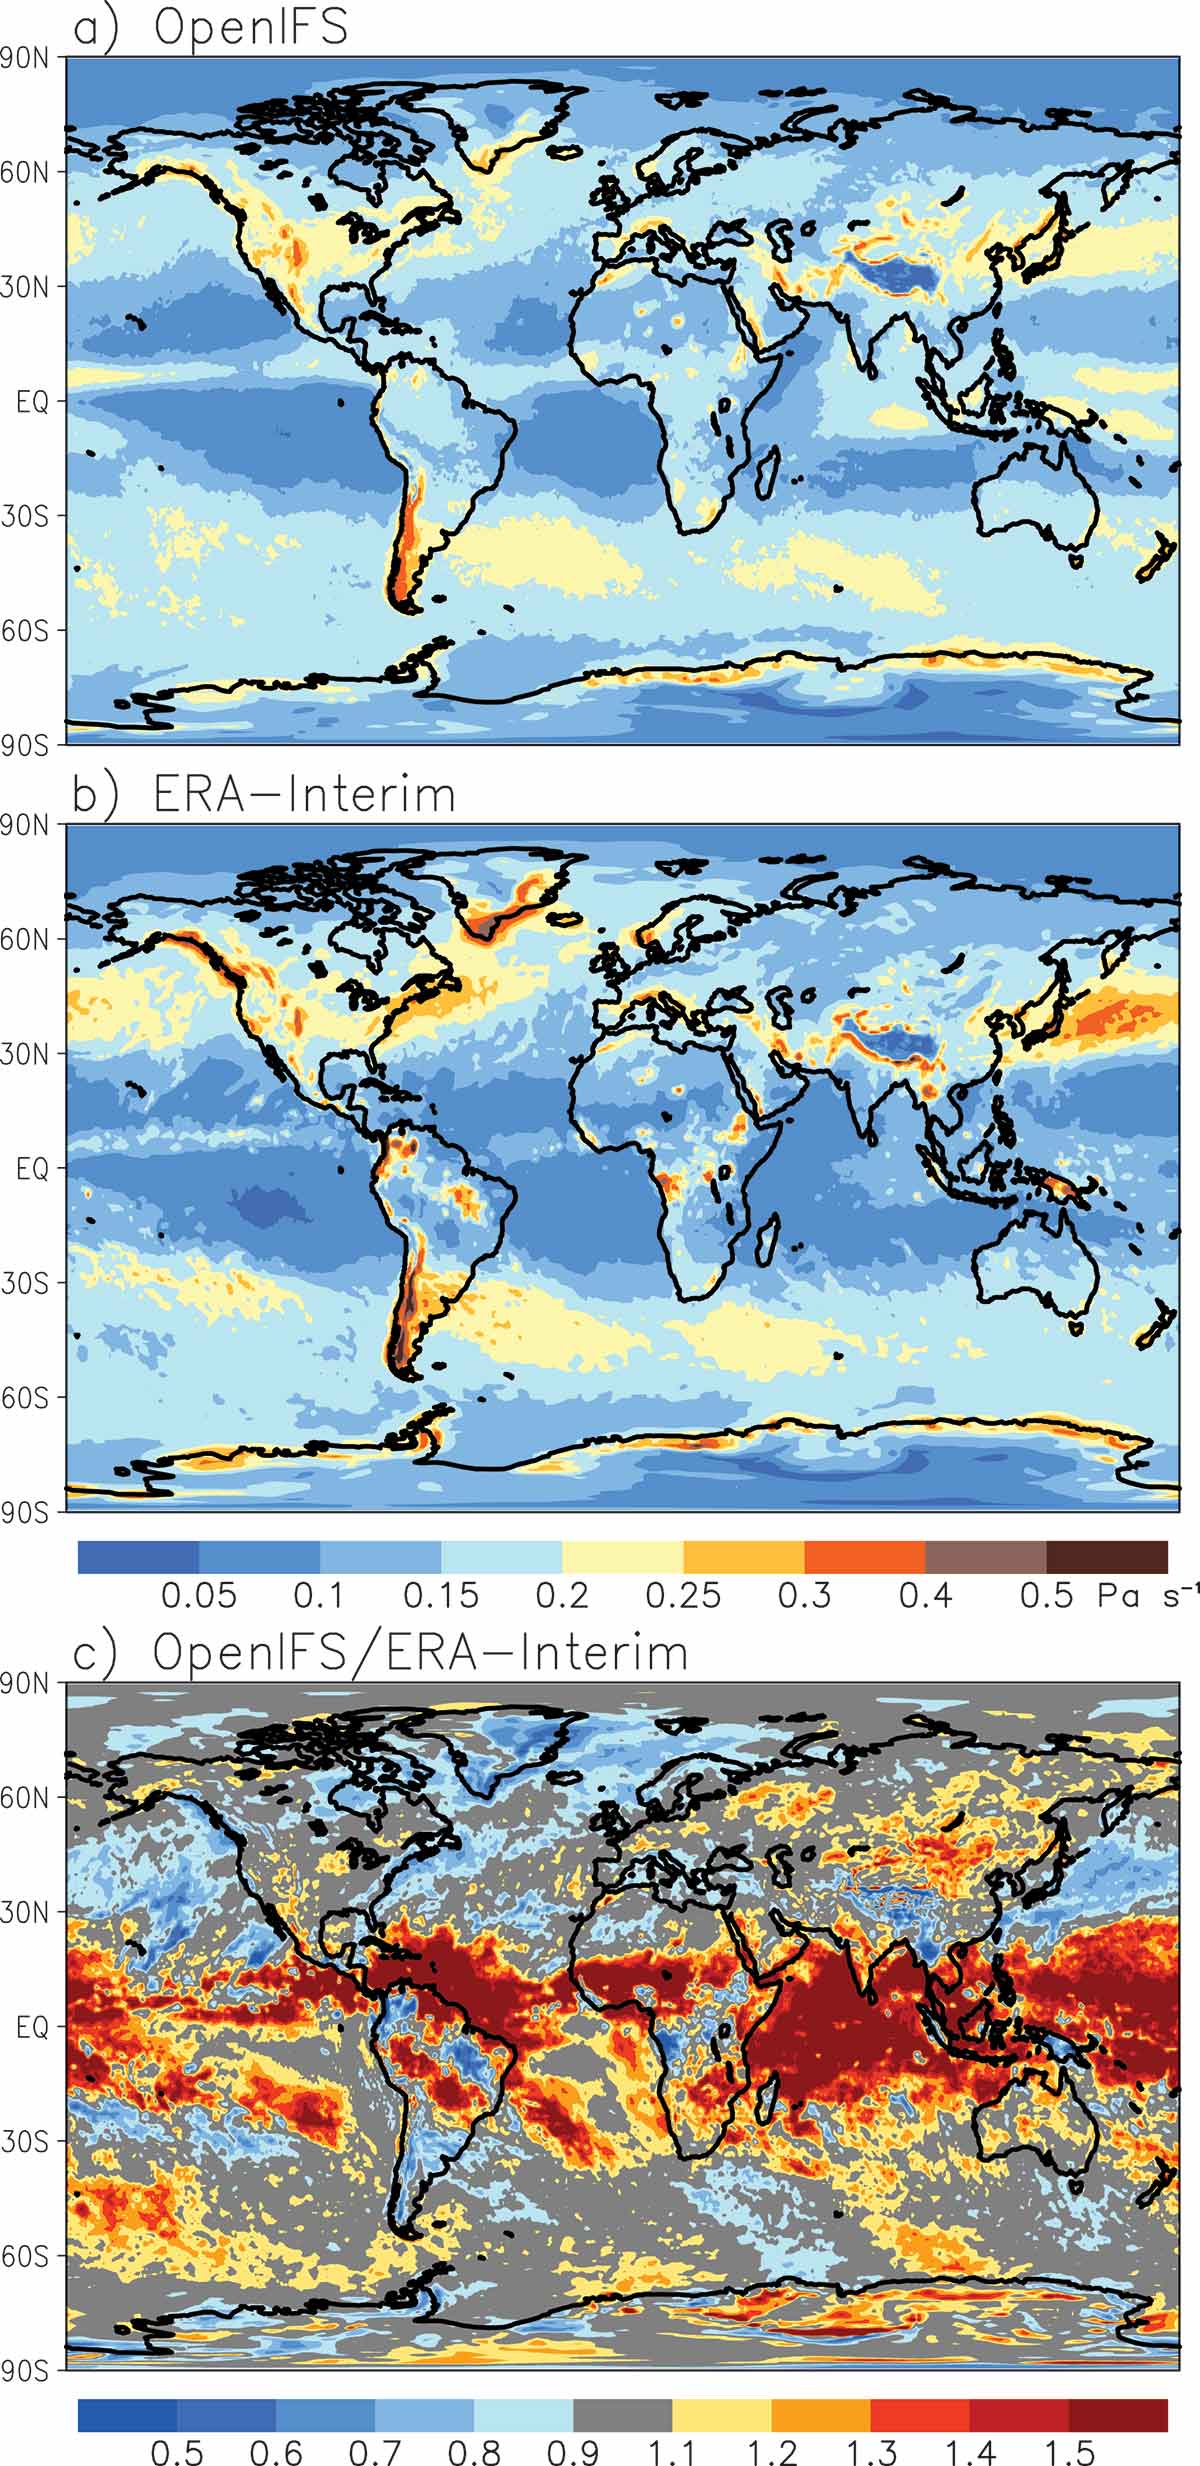
Fig. 1.
Root-mean-square (RMS) amplitude of (600 hPa) for the 12-month period from December 2004 to November 2005 for (a) the ERA-Interim reanalysis and (b) the OpenIFS simulation. (c) shows the ratio between OpenIFS and Era-Interim
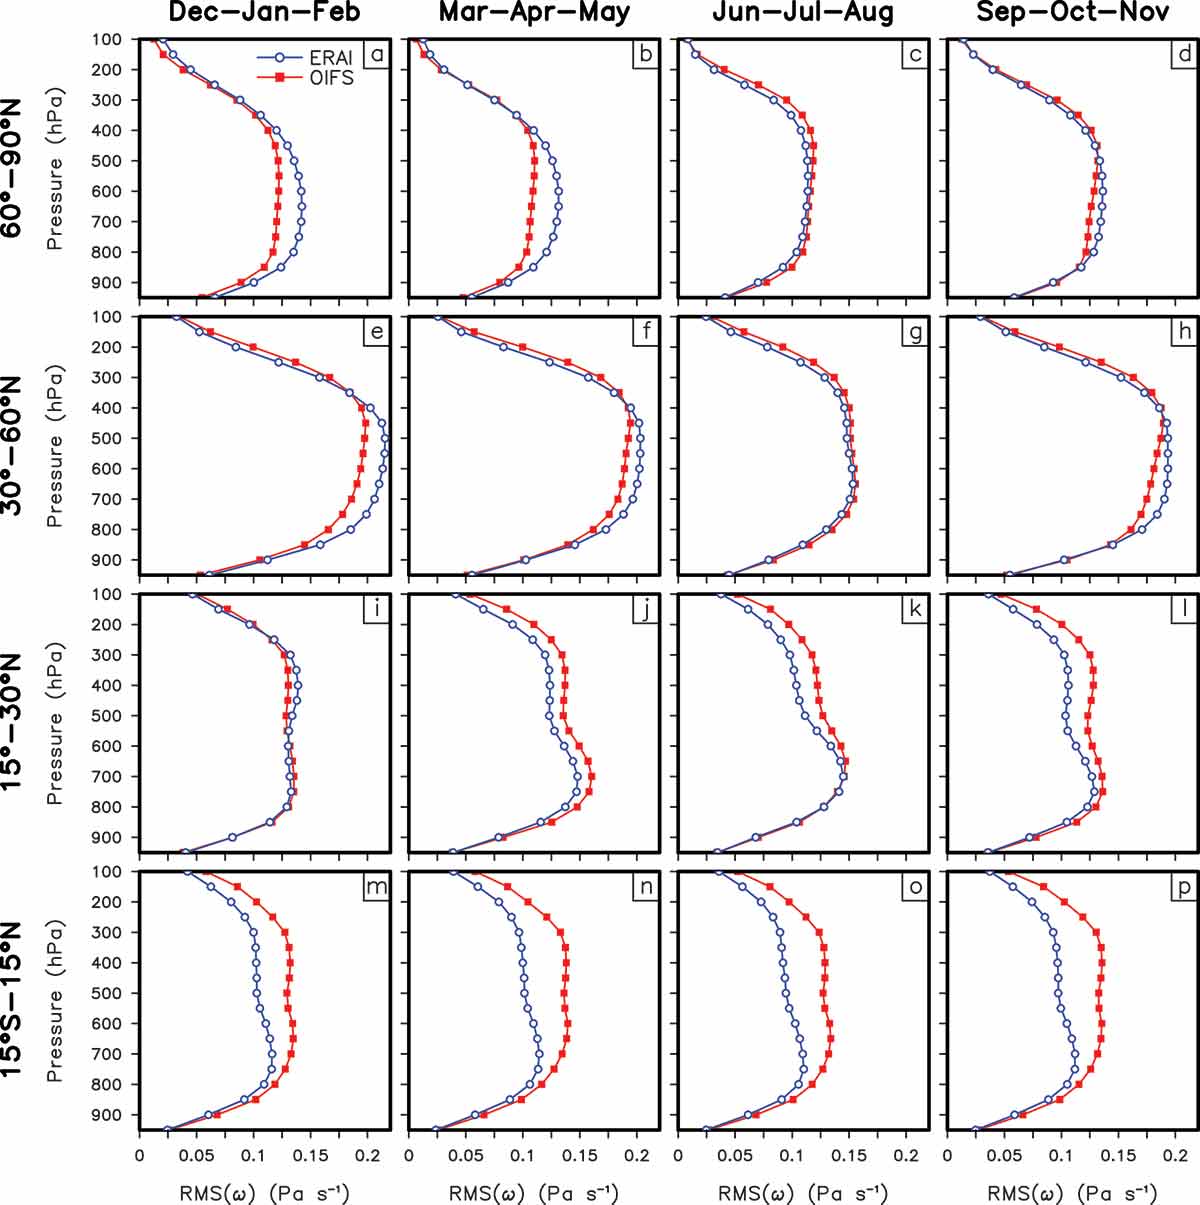
Fig. 2.
RMS amplitudes of for the four standard three-month seasons and four latitude belts for the ERA-Interim reanalysis (blue) and the OpenIFS simulation (red)
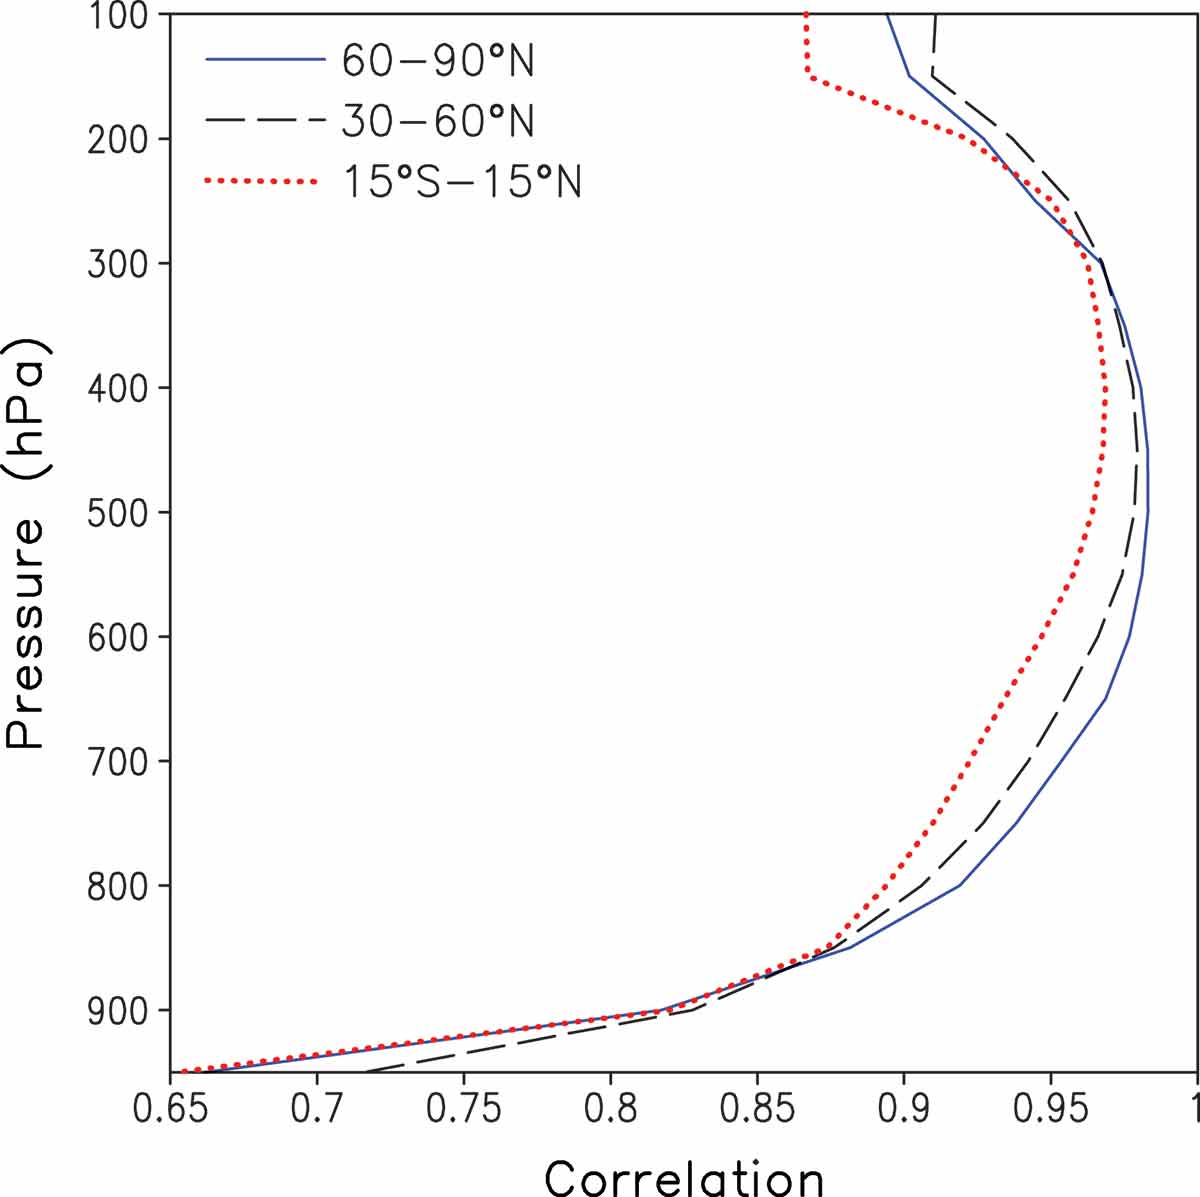
Fig. 3.
Average annual correlation between the generalized omega equation solution and values obtained directly from OpenIFS
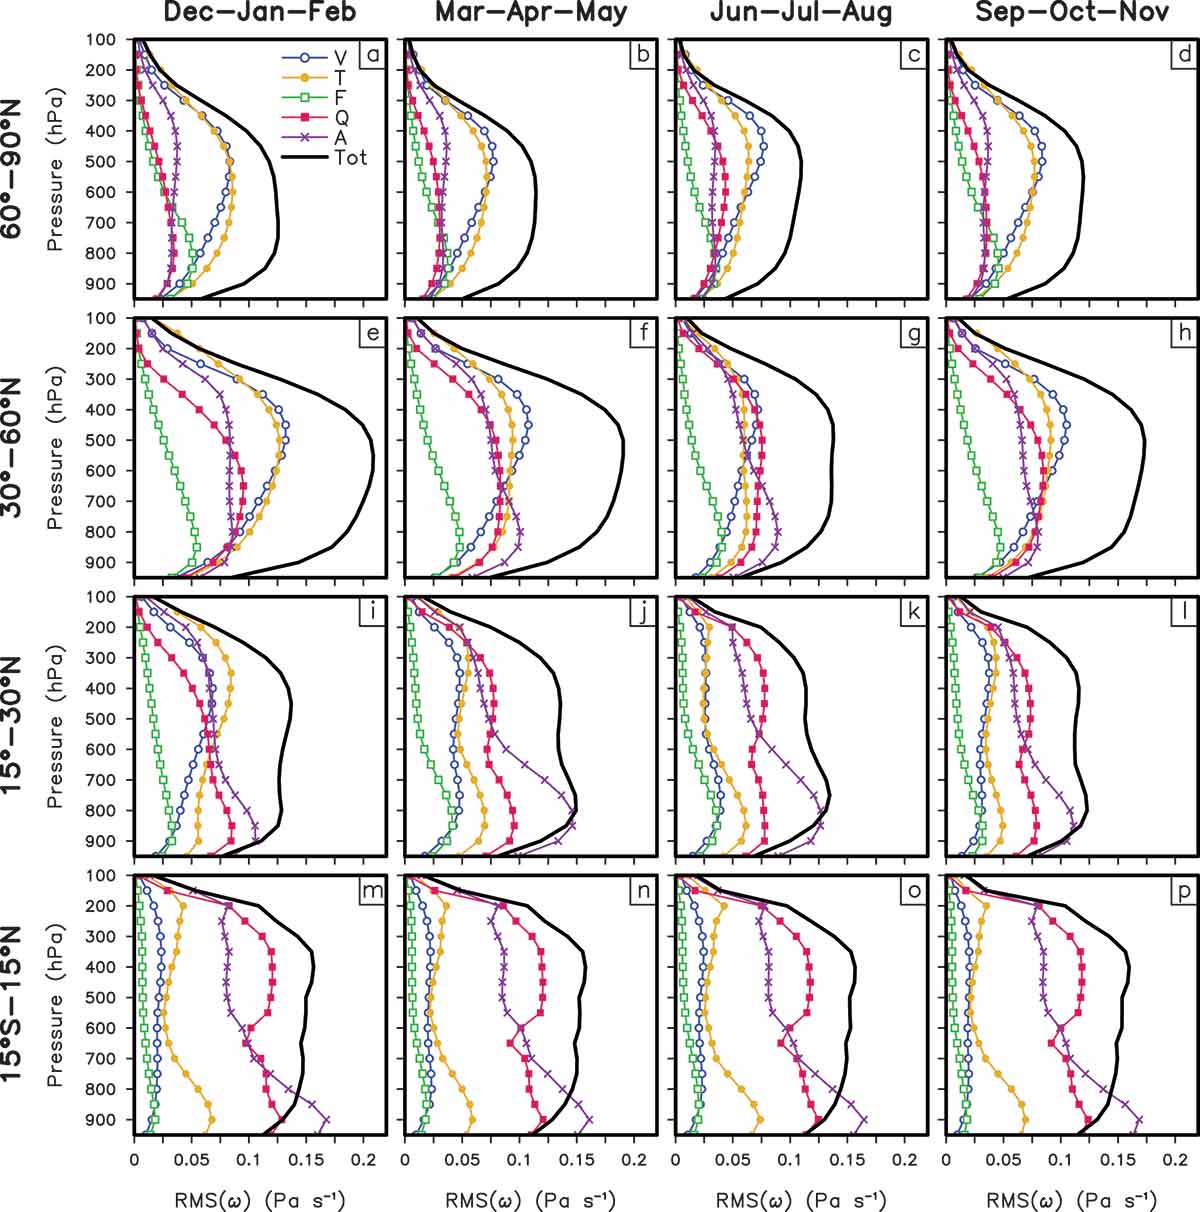
Fig. 4.
RMS amplitudes of (black) together with its five components for the four standard three-month seasons and four latitude belts. V corresponds to vorticity advection, T to thermal advection, F to friction, Q to diabatic heating, and A to the imbalance term.
Table 1.
Correlation between and for different latitude belts and seasons at the 600 hPa level
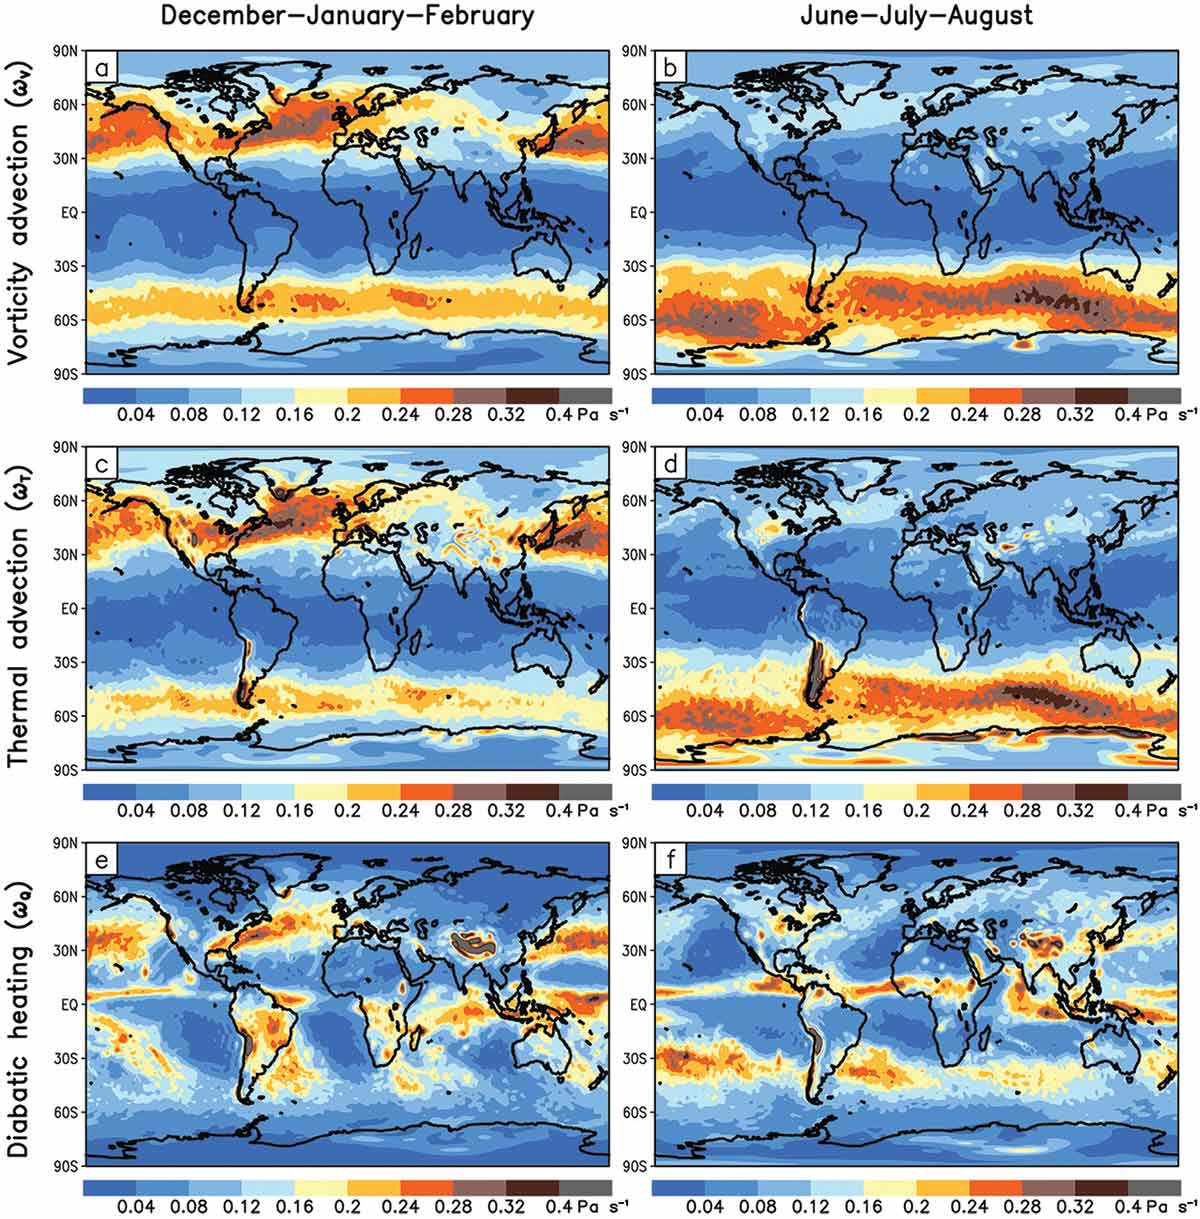
Fig. 5.
RMS amplitudes of , , and for DJF (a,c,e) and JJA (b,d,f) at 600 hPa
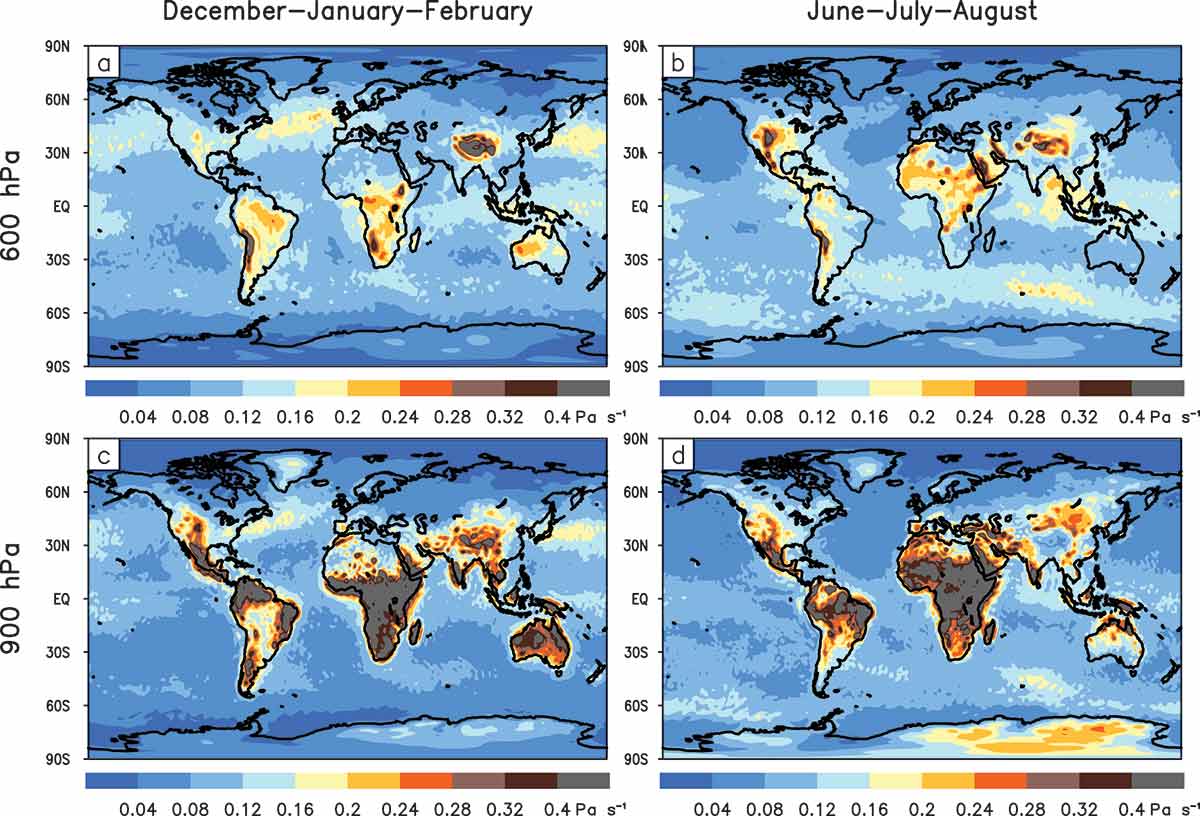
Fig. 6.
RMS amplitudes of for DJF (a,c) and JJA (b,d) at 600 and 900 hPa.
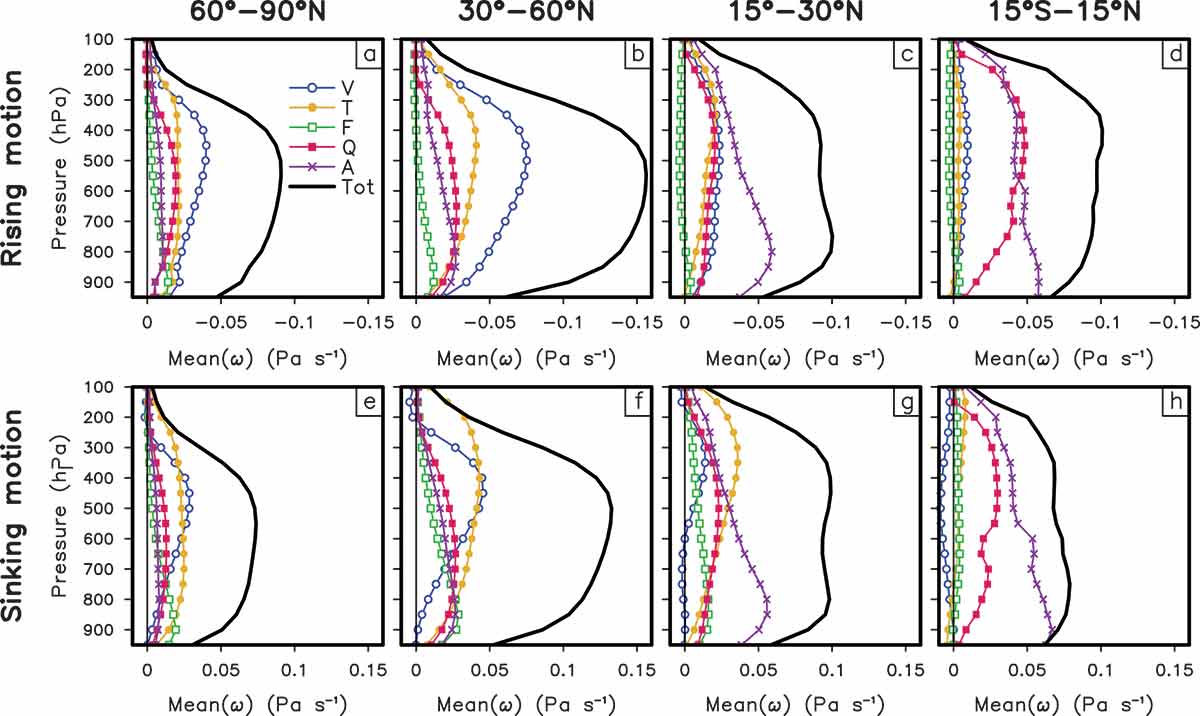
Fig. 7.
Mean values of and its five components when and where is negative (a-d) and when and where it is positive (e-h). For this figure, data for all 12 months is used. Due to the additivity of the mean values, the sum of the five components equals . Also note that the scale on the upper row is reversed.