
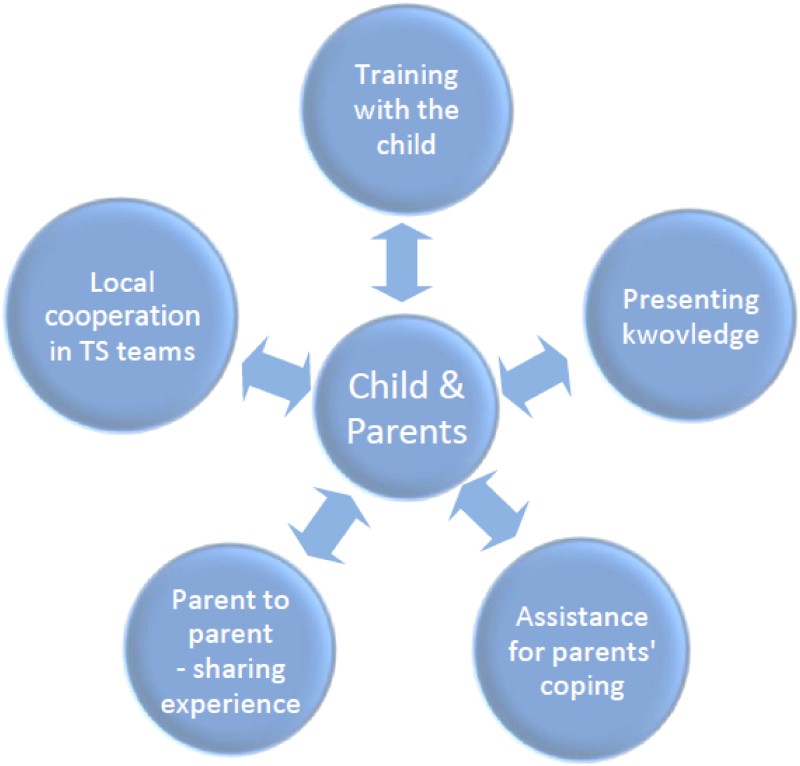
Figure 1.
The intervention modules in the PIH.
Table 1.
Clinical data for children and parents.
Notes: Data are given as numbers of parents and numbers of children.
Mean age child is given in months.
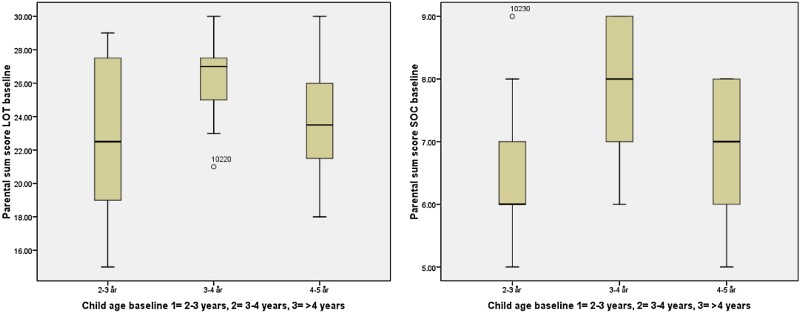
Figure 2.
Parental sum scores of LOT and SOC, respectively, at baseline divided in different age groups of children: 2–3 years, 3–4 years, and 4–5 years. LOT, Life Orientation Test (range 8–32); SOC, sense of coherence questionnaire (range 3–9).
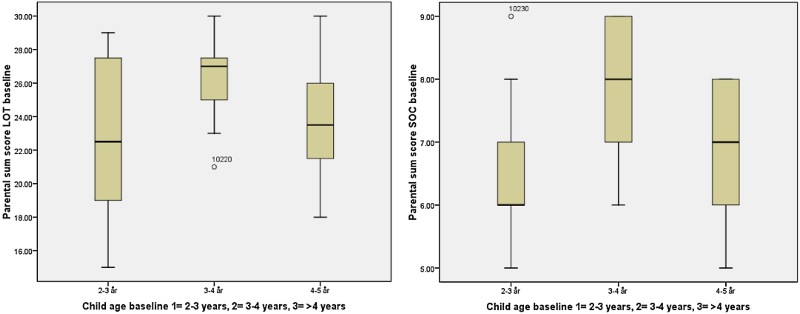
Figure 3.
Parental sum scores of LOT and SOC at baseline divided in groups with the PSI score above or below clinical stress level (85th percentile). LOT, Life Orientation Test (range 8–32); SOC, sense of coherence questionnaire (range 3–9); PSI, Parenting Stress Index.
Table 2.
Scores on optimism (LOT) and sense of coherence (SOC) at baseline and post-test.
Notes: Data are given as means with standard deviation, effect size, and mean change with standard deviation. Paired samples t-tests were applied to detect significant differences between baseline and post-test.
LOT, Life Orientation Test (range 8–32); SOC , sense of coherence questionnaire (range 3–9); LOT1/SOC11, baseline; LOT2/SOC2, post-test.
Table 3.
Minimal clinically important change in maternal and paternal scores on optimism (LOT) and sense of coherence (SOC) from baseline to post-test.
Note: Life Orientation Test baseline/post-test (LOT1/LOT2), and Sense of coherence questionnaire (SOC1/SOC2).
Table 4.
Correlations between optimism (LOT), sense of coherence (SOC), and stress (PSI) in mothers.
Note: Optimism (LOT), sense of coherence (SOC), and stress (PSI).
LOT1, SOC1, PSI1 measured at baseline and LOT2, SOC2, PSI2 measured at post-test.
*p < .01.
Table 5.
Correlations between optimism (LOT), sense of coherence (SOC), and stress (PSI) in fathers in the intervention group.
Notes: Optimism (LOT), sense of coherence (SOC), and stress (PSI).
LOT1, SOC1, PSI1 measured at baseline, LOT2, SOC2, PSI2 measured at post-test.
*p < .05.
**p < .01.