
Table 1.
Demographics of the participants (n = 33): gender and user experience.
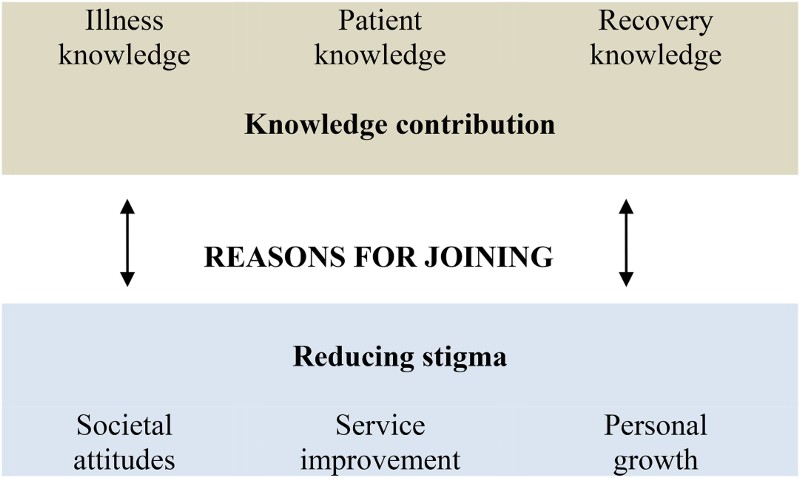
Figure 1.
Core categories and subcategories of reasons for joining.
© 2016 Ulla-Karin Schön, published by Stockholm University Press
This work is licensed under the Creative Commons Attribution 4.0 License.