
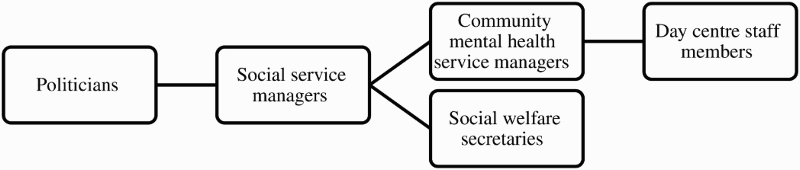
Figure 1.
Organizational chart of the respondents.
Table 1.
Example of stages of the analysis.
Table 2.
Policy intentions and empirical findings contrasted.
Enthusiasm about upcoming user freedom of choice (m, f)*
Assumed that users would stay with their local provider (m, f)
Too early to evaluate (m)
Restrictions of individual freedom of choice in the system (f)
Feared that restrictions were going to decrease users' ability to influence how much time to attend (f), when to attend (f), and which providers to choose from (m)
Limited change opportunities; few new providers (f)
Hoped for development through competition (m, f)
No expectations of new providers (m) or changes in content (m)
Few new providers (m, f)
Failure of profiling; duplication rather than specialization (m, f)
Hoped for higher quality at the same or lower price (m)
Expected no development of public-run activities (m)
No financial compensation for motivational work in the upcoming system (f)
Hard for non-public providers to survive financially (m)
Complementation, not competition (f)
Hoped for increased cooperation between public and non-profit organisations (m)
Worried about absence of money needed for the implementation process (m)
Measurements of resources, not users' needs, to design the system (f)
Cost effectiveness through time units (f)
Focus on economy, not content (f)
‘Balanced budget’ catch phrase (m)
Closure of meeting places (m)
Limited number of time units approved (f)
It is all about money (f)
Budgetary control was moved upwards (f)