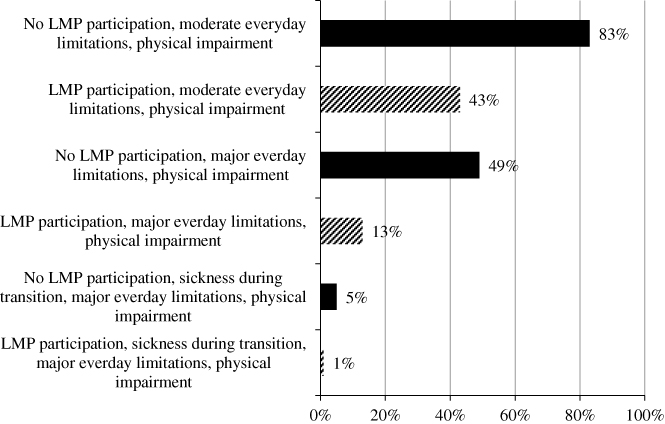
Table 1.
Percentage of young disabled adults who are in ordinary full-time or part-time employment according to background characteristics and transition support (n = 245).
Table 2.
Logistic regression: how ordinary employment of young disabled adults co-varies with background and transition support variables (n = 245).
[ii] Note: The regression model is checked for multicollinearity. The highest correlation in-between two independent variables is at Pearson’s R 0.311 (LMP participation/sickness during transition). This is considered a weak correlation, and therefore does not constitute a problem for the model. A Nagelkerke’s R2 of 0.613 indicates a moderately strong relationship in-between prediction and grouping, and the model has a good fit according to a Hosmer–Lemeshow test of 0.369.