Have a personal or library account? Click to login
On your own within a network? Vulnerable youths’ social networks in transition from school to adult life Cover

On your own within a network? Vulnerable youths’ social networks in transition from school to adult life

Open Access
|Nov 2015

Figures & Tables

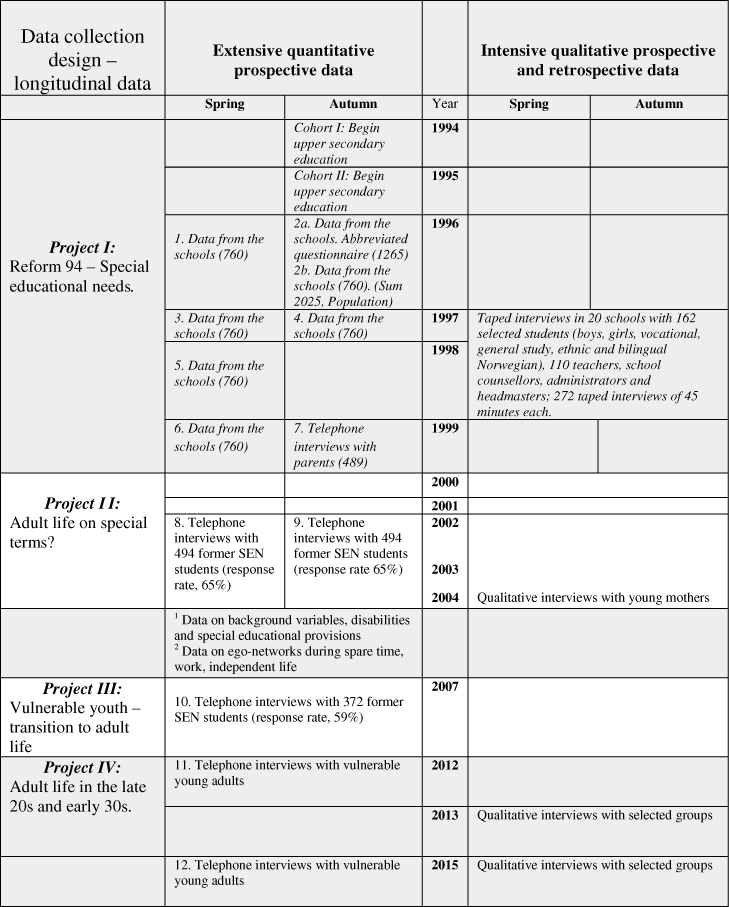
Figure 1.

Data collection design for the longitudinal study. The present study is based primarily on data from Project II, Project III and Project I.

Note: Project I, ‘Reform 94 – Special educational needs’, was funded by the Norwegian Ministry of Education and Science. Project II, ‘Adult life on special terms?’, was funded by the Welfare Program of the Norwegian Research Council. Project III, ‘Vulnerable youth – transition to adult life’, was funded by the Norwegian Research Council, Volda University College and Møre Research, Volda. Project IV, ‘Adult life in the late 20s and early 30s was funded by Volda University College. The present study is based primarily on data from Project II (from Kvalsund and Bele 2010a and b) and Project III but also on data from Project I. For Project IV, ‘Adult life in the 30s’, telephone interviews were conducted with the young adults in spring 2012. For further details on the data collection process from 1996 to 2007, see Young Adults Data Collection 2007 (Båtevik and Myklebust 2007), available at http://www.hivolda.no/neted/site/group1/notat16_07.pdf.
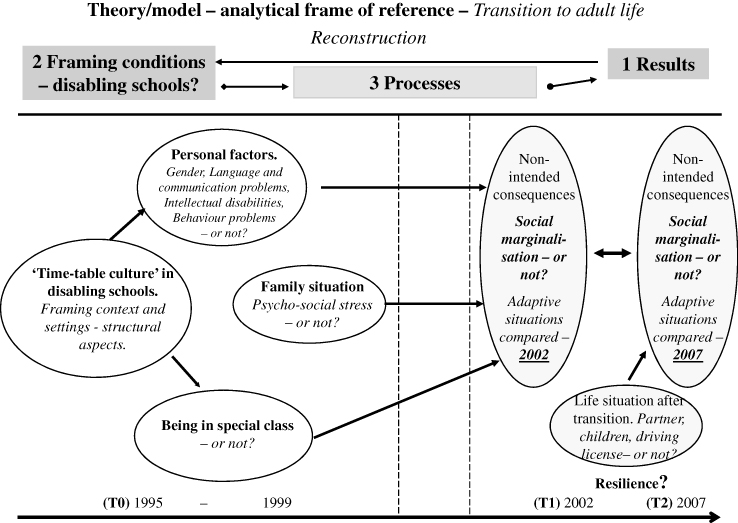
Figure 2.

Theory/model – analytical frame of reference – Transition to adult life. The interconnection among categories of independent variables (in three Norwegian longitudinal research projects): personal factors, family situation, special educational measures and changed life situation variables.

Table 1.

Comparing students identified as SEN students – 1996 population, 1996, 2002 and 2007 samples (expressed as a percentage).

VariablesPopulation 1996Sample 1996Sample 2002Sample 20071. Academic courses14121062. Vocational courses797678813. Unspecified courses71212134. In regular classes585152445. In special classes424948566. Female373939387. Male63616262N2025760494372
Table 2.

Overview of dichotomized dependent variables for 2002 (N=494) and 2007 (N=372).

20022007Dependent variablesValues%N%NBeing in a small network or not (Network sizea)0. Low4120012441. High59294883242. Network densityb0. Low452231. High552713. Network solely of young persons at the same age or not0. Not in network solely of young persons at the same age41201291061. In network solely of young persons at the same age5929371264

a See Kvalsund and Bele (2010b).

b This aspect was not explicitly analysed in the present article. However, we have studied network in small groups. As we include the total range of network density, from isolation to integration, we have also studied this network quality towards the isolating and bonding social adaptation (in Table 2).

Table 3.

Overview of the three categories of dichotomized independent variables in 2002 (N=494) and the four categories of dichotomized independent variables in 2007 (N=373).

20022007Independent variablesValues%N%NI. Personal factors: Disabilities according to expert evaluation at the beginning of upper secondary education1. Language and communication difficulties0. No language and communication difficulties78388933481. Language and communication difficulties221067242. Psycho-social difficulties0. No psychosocial difficulties69341943511. Psychosocial difficulties311536213. Intellectual disabilities0. No Intellectual disabilities86427853161. Intellectual disabilities146715563. Gender0. Male61304622321. Female3919038140II. Contextual factors: Family situation4. Psycho-social stress in the family at the start of upper secondary education0. No psychosocial stress in family81402963591. Psychosocial stress in family1992413III. Contextual factors: School situation5. Special class: Group of four at the start of upper secondary education.0. Not in group of four84417833101. Group of four16771762IV. Contextual factors: Changed life situation variables in early adult life6. Children/ Driver's license0. No children/driver's licence––11411. Have children/driver's license––89330
Table 4.

Being socially marginalized or integrated in a small strategically formed network or not in early adult life (age 24) and in adulthood (age 29), affected by independent variables related to the beginning of upper secondary school and by life situation variables in adulthood (in 2007). Logistic regression.a

2002 (T1)2007 (T2)Social marginalizationSocial marginalizationIn a small network or notIn a small network or notSign.Exp(B)Sign.Exp(B)Personal factors 1. Language and communication difficulties0.7651.1180.2810.566 2. Psycho-social difficulties0.5800.7870.5401.384 3. Intellectual disabilities0.0870.510Contextual factors I. Family situation Psycho-social stress in the family at the start of upper secondary education0.5871.3480.2350.483 II. School situation Special class: Group of four at the start of upper secondary education.0.0003.4250.6540.859 III. Having changed life situation (Children/Driver's license)0.0292.238

a The chance of being in a strategically formed network (<5 in 2007) or not in early adult life (2002, then <3, age 24, N=494) and in adulthood (2007, age 29, N=373). Logistic regression (p<.001, p<.05).

Table 5.

Being socially marginalized or integrated in a spontaneously formed network of persons of the same age or not in early adult life (age 24, T1) and in adulthood ( age 29, T2), affected by independent variables related to the beginning of upper secondary school and by life situation variables in adulthood (in 2007). Logistic regressiona.
2002 (T1)2007 (T2)Social marginalizationSocial marginalizationIn a spontaneously formed network or notIn a spontaneously formed network or notSign.Exp(B)Sign.Exp(B) Personal factors  1. Language and communication difficulties 0.2281.5520.9561.031 2. Psycho-social difficulties 0.008 2.842 0.7741.166 3.Intellectual disabilities3 0.003 2.330 0.7351.166 Contextual factors I. Family situation . Psycho-social stress in the family at the start of upper secondary education0.1222.3300.1310.390  II. School situation Special class I: Group of four at the start of upper secondary education.0.4281.1310.4581.202  III. Having changed life situation (Children/Driver's license)–– 0.002 3.047

a The chance of being in a spontaneously formed network or not in early adult life (2002, age 24, N=494) and in adulthood (2007, age 29, N=373). Logistic regression (p<.01).

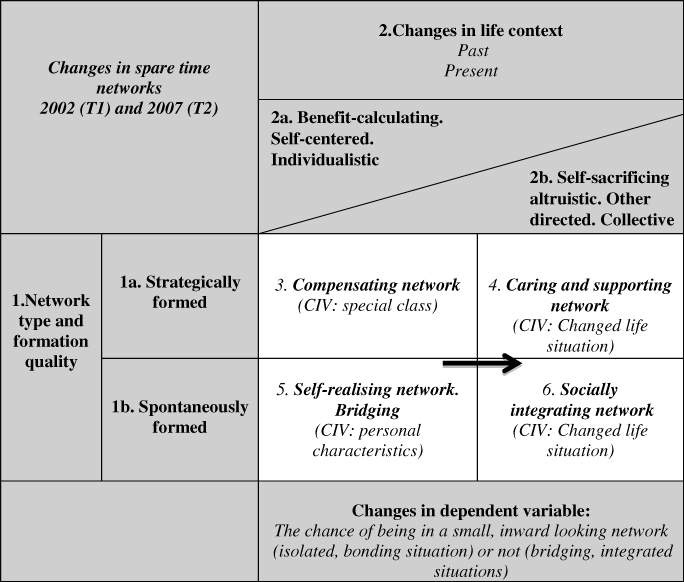
Figure 3.

The changes of spare time networks from early adult life (age 24, T1) to adulthood (age 29, T2). CIV: causing independent variable(s).

Language: English
Page range: 195 - 220
Submitted on: Dec 19, 2012
Accepted on: Sep 19, 2013
Published on: Nov 3, 2015
In partnership with: Paradigm Publishing Services

© 2015 Irene Velsvik Bele, Rune Kvalsund, published by Stockholm University Press
This work is licensed under the Creative Commons Attribution 4.0 License.