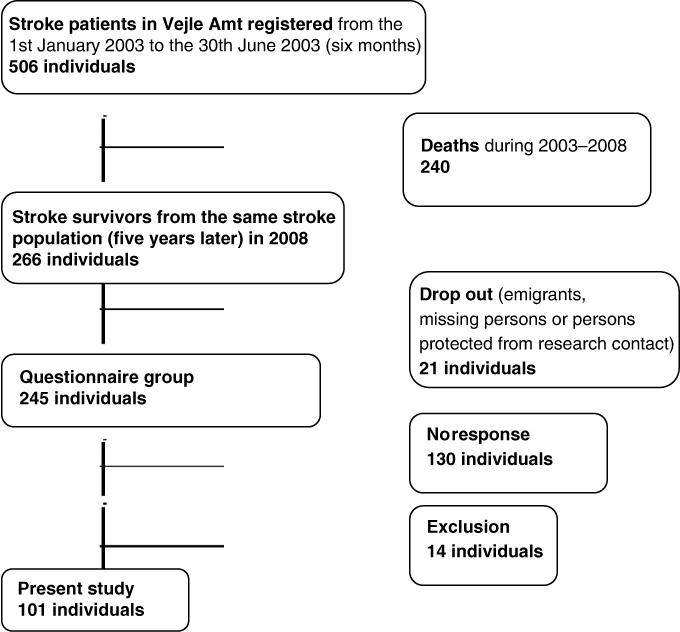
Figure 1.
A follow-up of 516 stroke patients, from which the population of the present study was drawn.
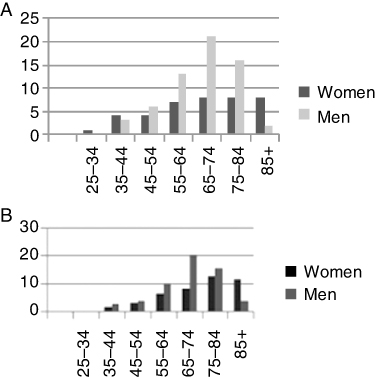
Figure 2.
(A). Age distribution of individual in the sample by gender (N=101). (B). Distribution of individuals in the stroke population, divided by age and sex in percents of numbers (N=266).
Table 1.
Domestic circumstances: personal and accommodation.
Table 2.
Various physical and psychological consequences of stroke the subjects had to face every day shown by frequency and category.
Table 3.
Self-assessed level of present functioning (Modified ranking score).
Table 4.
Self-reported employment and pension.
Table 5.
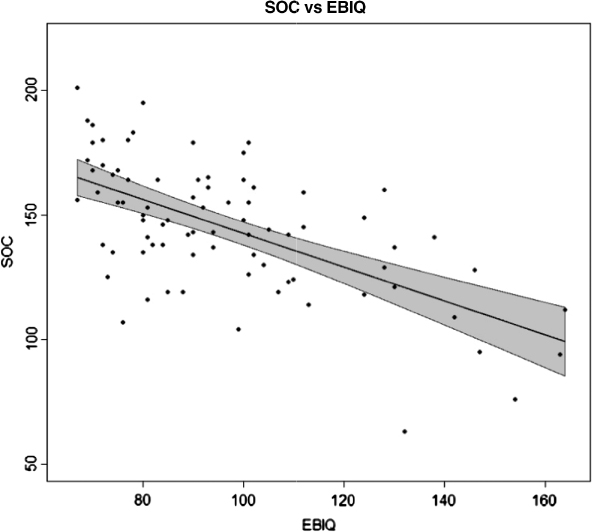
Parameter estimates for the regression of EBIQ upon SOC.