Have a personal or library account? Click to login
The transition to adulthood for vulnerable youth Cover

The transition to adulthood for vulnerable youth

Open Access
|Apr 2012

Figures & Tables

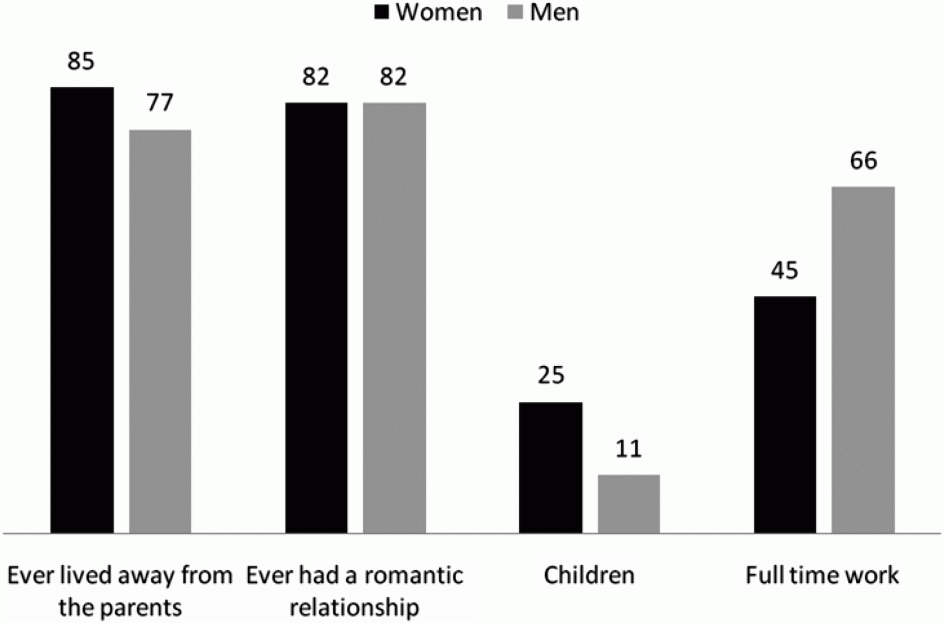
Figure 1. 

Percentage of youth achieving transition to adult life.

Note: In total, 190 women and 304 men were surveyed for the three first indicators. For the indicator ‘Full time work’ 163 women and 280 men were surveyed, because students in postsecondary education were excluded.
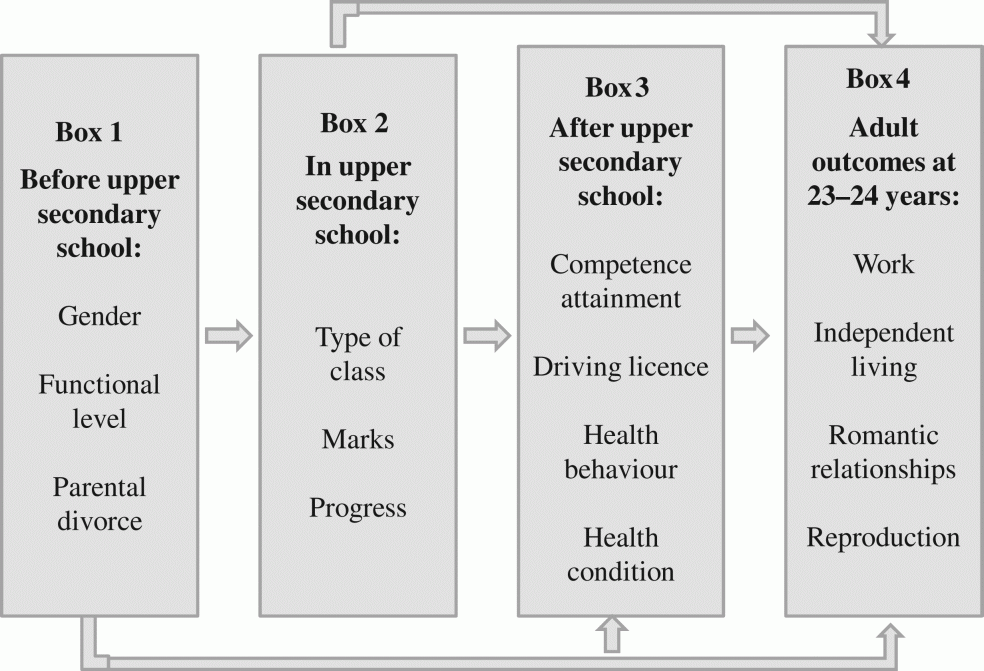
Figure 2. 

An analytical model of variables assumed to influence adult outcomes.

Table 1. How 11 independent variables influence adaptation to four domains of adult life at the age of 23–24 among 494 former students with special educational needs. Odds ratios.

Lived independently N = 494Had a romantic relationship N = 494Had children N = 494Achieved full time work N = 443 + Gender0. Women1. Men0.47**0.45**0.29**2.16***Functional level at age 170. Fourth quartile1. Third quartile1.001.473.35**1.072. Second quartile0.633.01**3.04**1.603. First quartile0.684.25**2.51*1.80Parental relationship0. Not divorced1. Divorced1.252.00*1.600.63*Type of class0. Special class1.Regular class1.050.760.791.27Degree of progress0. Not on schedule1. On schedule1.291.140.930.88Marks0. Below median level1. Above median level2.16**1.001.290.77Competence0. No formal qualifications1. Formal qualifications1.94*1.83*1.042.64***Driving licence0. No driving licence1. Driving licence0.50*2.26**2.42**1.27Smoking0. Do not smoke1. Smoke2.67***7.89***2.41**0.92Alcohol0. Do not drink1. Drink1.422.74***0.801.40Present health condition0. Health problems1. No health problems1.322.64***0.702.33***Note: +Students in postsecondary education are excluded from the analyses of full time work.*p< 0,05; **p< 0,01; ***p< 0,001. For each independent variable the value 0 is the reference category.

Table 2. How 10 independent variables influence adaptation to two domains of adult life at the age of 23–24 among former students with special educational needs. 190 women and 304 men. Odds ratios.

Had a romantic relationshipHad childrenWomen N = 190Men N= 304Women N= 190Men N=304Functional level at age 170. Fourth quartile1. Third quartile1.381.659.49***1.182. Second quartile2.583.55**7.06**1.303. First quartile12.17*3.43*9.11***0.65Parental relationship0. Not divorced1. Divorced3.191.683.08*0.92Type of class0. Special class1. Regular class0.630.910.710.94Degree of progress0. Not on schedule1. On schedule1,041.101.160.76Marks0. Below median level1. Above median level1.440.751.881.10Competence0. No formal qualifications1. Formal qualifications2.341.530.631.75Driving licence0. No driving licence1. Driving licence1.732.66**1.695.51*Smoking0. Do not smoke1. Smoke10.00***7.09***2.37*3.08**Alcohol0. Do not drink1. Drink2.92*2.27*0.471.73Present health condition0. Health problems1. No health problems2.062.6**0.910.50Note: *p< 0,05; **p< 0,01; ***p< 0,001. For each independent variable the value 0 is the reference category.
Language: English
Page range: 358 - 374
Submitted on: Mar 25, 2011
Accepted on: Jan 17, 2012
Published on: Apr 4, 2012
In partnership with: Paradigm Publishing Services

© 2012 Jon Olav Myklebust, published by Stockholm University Press
This work is licensed under the Creative Commons Attribution 4.0 License.