Have a personal or library account? Click to login
Factors affecting older adults' hearing-aid use Cover

Factors affecting older adults' hearing-aid use

Open Access
|Feb 2012

Figures & Tables

Table 1. The demographic characteristics and hearing levels of participants in the Lovisenberg hearing-loss study (n = 90).

Hearing-aid useFactor≤1 hour a day, n (%)>1 hour a day, n (%)pHearing loss ≤40 dB HL7 (35.0)13 (18.6)0.119 > 40 dB HL13 (65.0)57 (81.4)Gender Female11 (55.0)48 (68.6)0.260 Male9 (45.0)22 (31.4)Age <80 years5 (25.0)29 (41.4)0.181 ≥80 years15 (75.0)41 (58.6)Marital status* Married9 (50.0)28 (40.6)0.472 Single, widowed, divorced9 (50.0)41 (59.4)Note: *Three data points missing.

Table 2. Hearing-aid use (n = 88).

Level of useTotal, n (%)≤1 hour20 (22.2)1–2 hours9 (10.0)2–4 hours10 (11.1)4–6 hours8 (8.9)6–8 hours18 (20.0)>8 hours25 (27.8)

Table 3. The Varimax rotated factor loadings for the four-factor model of assessment of hearing loss and hearing aids
Factor 1Factor 2Factor 3Factor 4StatementAccepted needFollow-up supportSocial assessmentConscious-nessI need to use my hearing aid every day0.804I benefit from my hearing aid0.803My hearing aid is a part of me, i.e. I have accepted that I need it0.794My aim has been to use my hearing aid the whole day, even when I'm by myself0.783My hearing aid has made it easier for me to communicate with other people0.677I have adapted to my hearing loss emotionally0.575I got used to my hearing aid relatively quickly0.574I have shared my experiences about using a hearing aid with other people0.505I had enough time for education, training and questions at the auditory centre0.881It was easy to get in touch with the auditory centre when I needed help0.855I was followed up with regard to using and operating my hearing aid0.802My hearing aid has been relatively easy to operate0.756My expectations about getting a hearing aid have been fulfilled/met0.650It has not been socially embarrassing for me to use a hearing aid among other people0.704My impression is that hearing impaired of my age are satisfied with their hearing aids0.580Pressure from relatives is the main reason for providing hearing aids0.807I am well informed about the cause of my hearing loss0.648Cronbach's alpha0.8690.9000.5520.505Percentage of variance25.3124.159.429.29
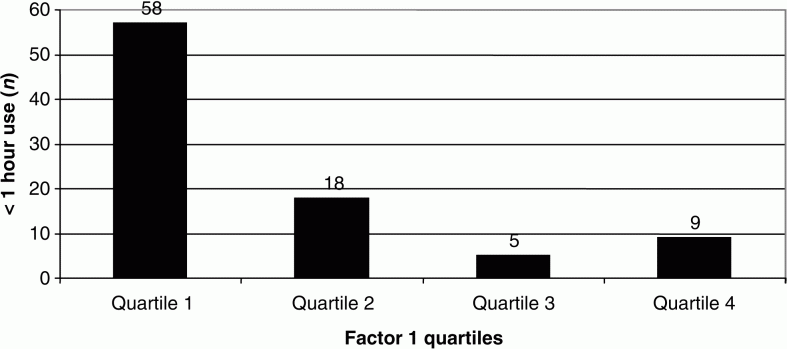
Figure 1. 

The hearing aid non-users according to ‘accepted need’.
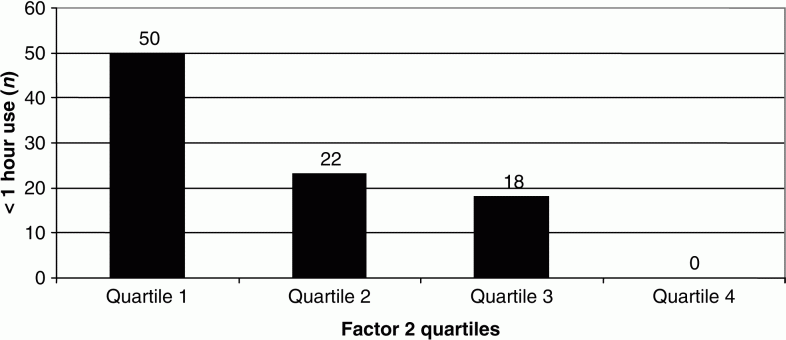
Figure 2. 

The hearing aid non-users according to ‘follow-up support’.

Table 4. The logistic regression analysis for the use of hearing aids according to ‘follow-up support’ and ‘accepted need’ (n = 88).*

Unadjusted resultsAdjusted resultsFactorOdds ratio95% confidence intervalpOdds ratio95% confidence intervalpFollow-up supportQuartile 2 vs. Quartile 13.40.912.50.0652.10.59.10.298Quartiles 3 and 4 vs. Quartile 113.73.257.7≤0.0016.81.432.40.016Accepted needQuartiles 2, 3 and 4 vs. Quartile 111.43.636.7≤0.0016.61.923.10.003*Two subjects had missing scores for the variables ‘follow-up support’ and ‘accepted need’.
Language: English
Page range: 300 - 312
Submitted on: Dec 6, 2010
Accepted on: Nov 3, 2011
Published on: Feb 4, 2012
In partnership with: Paradigm Publishing Services

© 2012 Jorunn Solheim, Kari J. Kværner, Leiv Sandvik, Eva-Signe Falkenberg, published by Stockholm University Press
This work is licensed under the Creative Commons Attribution 4.0 License.