
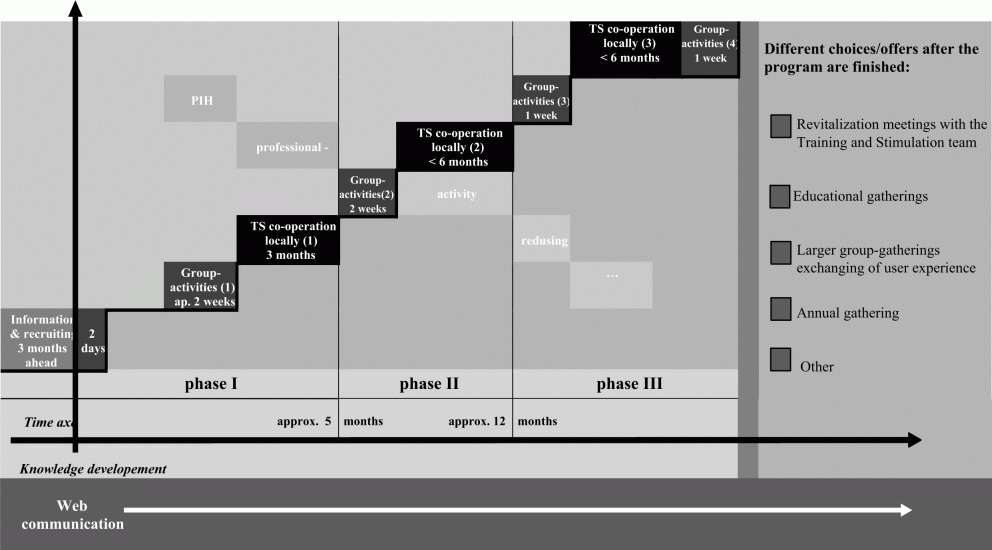
Figure 1.
An illustration of the Programme of Intensified Habilitation (PIH).
Table 1. Clinical data for all the children in PIH (n = 13), divided into groups (Group A, B and C) and for controls (n = 6).
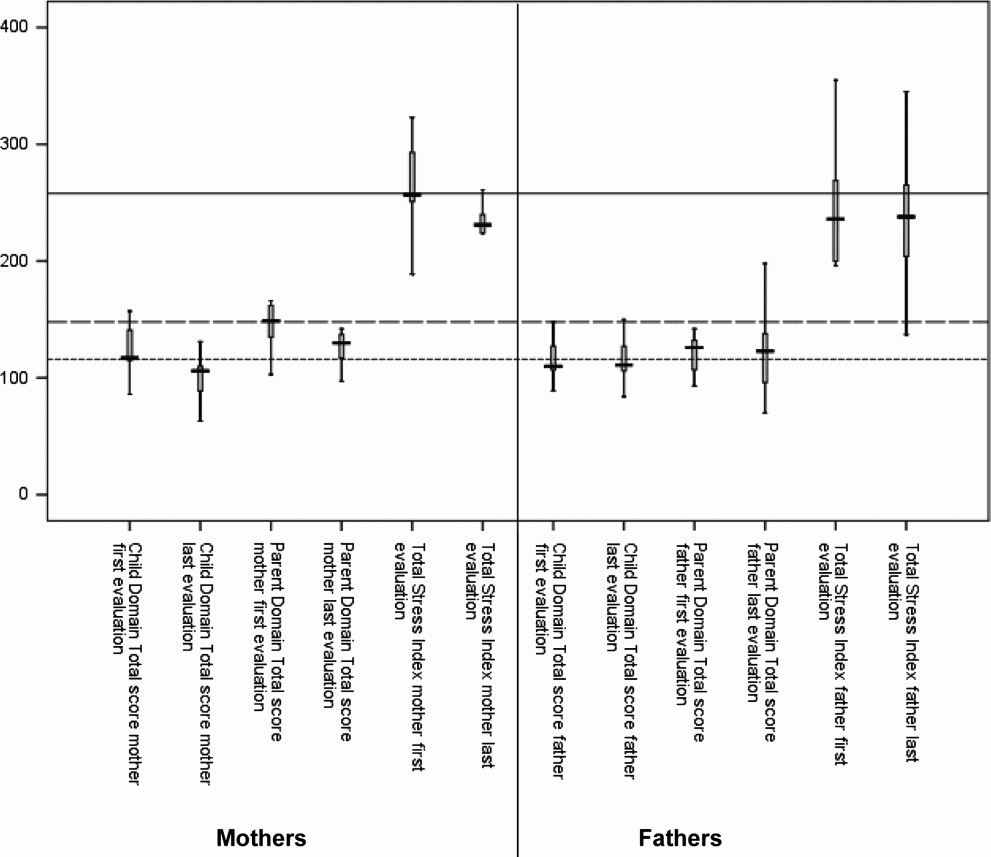
Figure 2.
Mother's and fathers's PSI scores before and after the programme period. Horizontal lines represent the clinical border level (t-scores) for Child Domain Total score (dotted line), Parental Domain Total score (broken line) and Total Stress Index (solid line).
Table 2. PSI – Subtest scores – Mean values (SD) of pre-test and post-test scores for mothers participating in the PIH (n = 9).
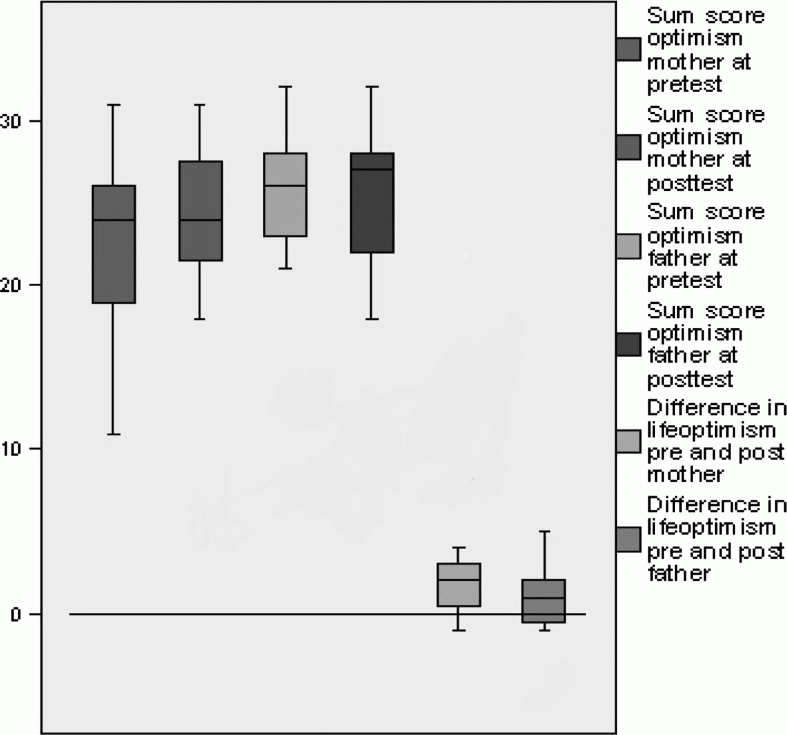
Figure 3.
Life orientation test (LOT) scores at pre-test and post-test in mothers and fathers in the PIH programme. For mothers there is a significant increase in score (Wilcoxon's signed ranks test p<.05).