Have a personal or library account? Click to login
Can special education make a difference? Exploring the differences of special educational systems between Finland and Norway in relation to the PISA results Cover

Can special education make a difference? Exploring the differences of special educational systems between Finland and Norway in relation to the PISA results

Open Access
|Dec 2011

Figures & Tables

Table 1.  Differences between Finland and Norway in PISA 2006.
FinlandNorwaySubjectScoreSdRating*ScoreSdRating*Science5638614879633Reading54781248410525Mathematics5488124909229Note: *57 countries.Source: Kjærnsli et al. 2007.
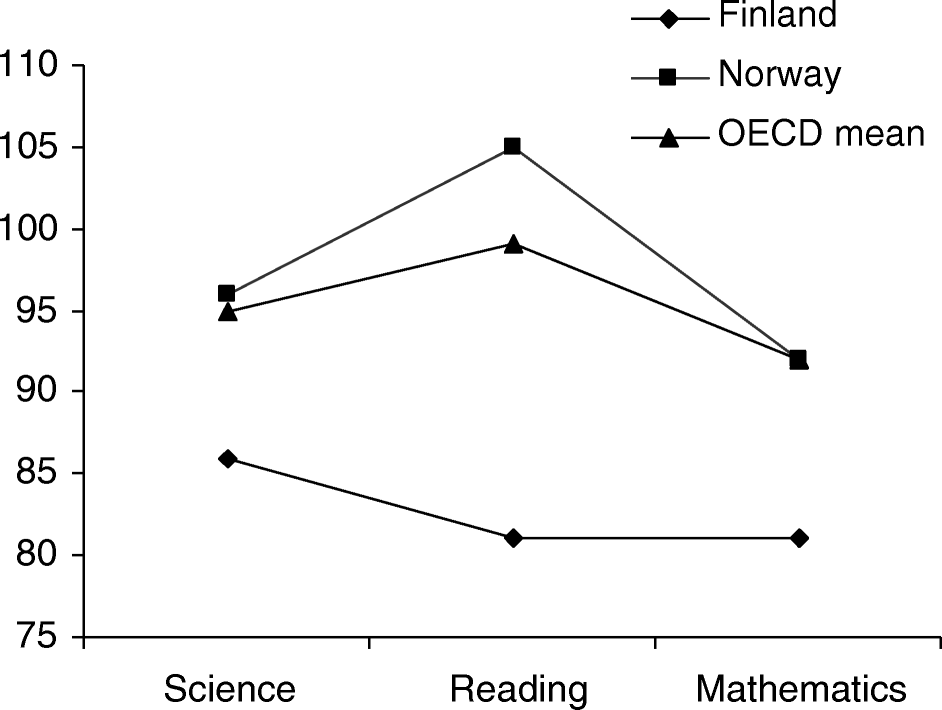
Figure 1. 

Standard deviation of PISA 2006 results between Finland and Norway in relation to OECD-mean.

Source: Kjærnsli et al. 2007.

Table 2.  Comparison of reading skills from PISA on the number of students on the levels below 1, 1 and 5.

FinlandNorway2003200620032006Below level 12%1%6%8%Level 15%4%11%14%Level 518%17%11%8%Source: Kjærnsli et al. 2007; Kivirauma and Ruoho 2007 (with kind permission from Springer Science + Business Media: International Review of Education, Excellence through special education? Lessons from the Finnish School Reform, 53, 2007, 287, J. Kivirauma and K. Ruoho, Table 1).

Table 3.  Distribution of students in special education during 2007–8.
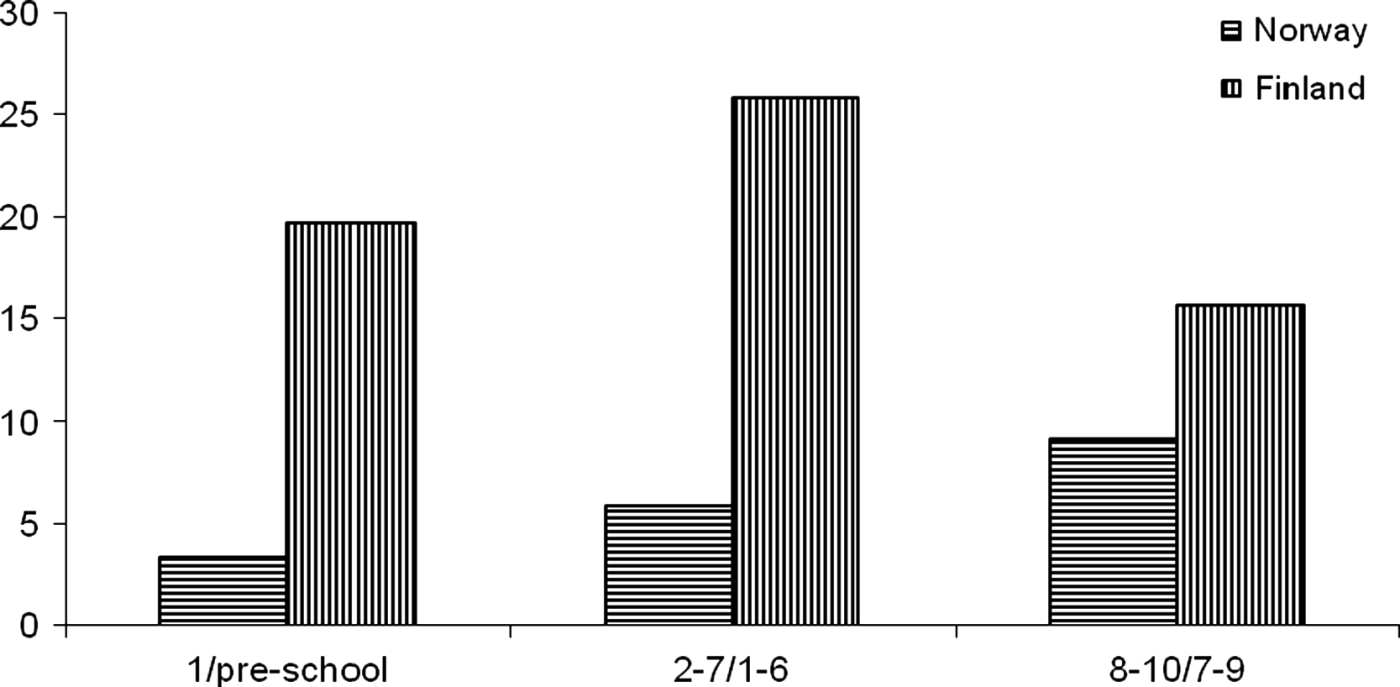
Amount of school-aged studentsFinlandNorwayIn full-time special education8.0%1.5%In part-time special education22.0%6.0%Source: Statistics Finland 2008; GSI Norway 2008.
Figure 2. 

Number of students (%) in part-time special education.
Source: Statistics Finland 2008; GSI Norway 2008.

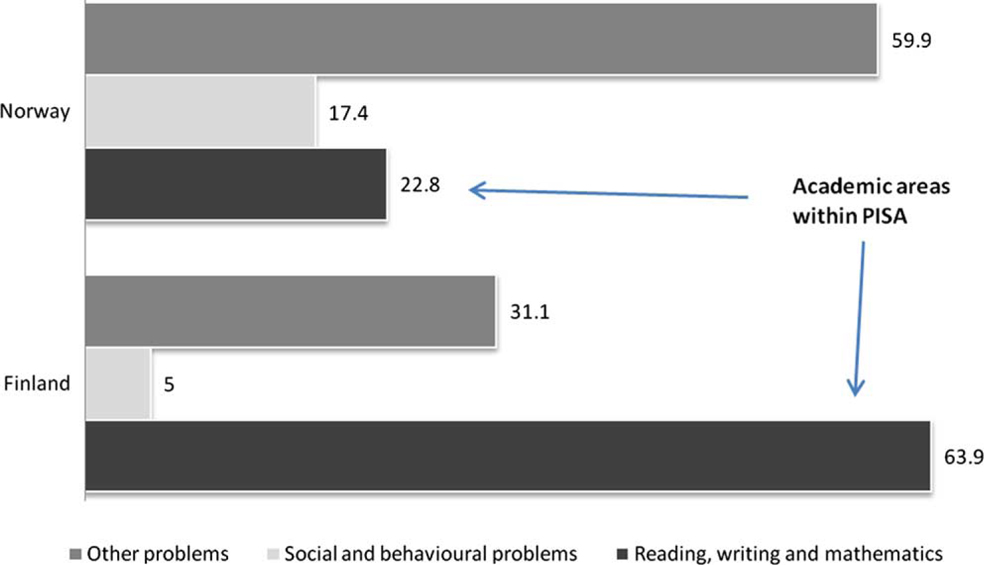
Figure 3. 

Focus on areas within part time special education in Finland and Norway.

Note: Data on the distribution of special education according to problems is however not accessible at a national level in Norway. The data used in Figure 3 is therefore gathered form a survey investigation performed by Nordahl and Sunnevåg (2007) containing 2038 students defined as having learning problems. According to these researchers the data presented represents a normal picture of the situation for special education in Norway.

Source: Statistics Finland 2008; Nordahl and Sunnevåg 2007.

Language: English
Page range: 271 - 281
Submitted on: Dec 19, 2009
Accepted on: May 30, 2010
Published on: Dec 4, 2011
In partnership with: Paradigm Publishing Services

© 2011 Rune Sarromaa Hausstätter, Marjatta Takala, published by Stockholm University Press
This work is licensed under the Creative Commons Attribution 4.0 License.