Have a personal or library account? Click to login
Occupations and means of living in adults with cerebral palsy or meningomyelocele during two decades in Sweden Cover

Occupations and means of living in adults with cerebral palsy or meningomyelocele during two decades in Sweden

Open Access
|Oct 2011

Figures & Tables

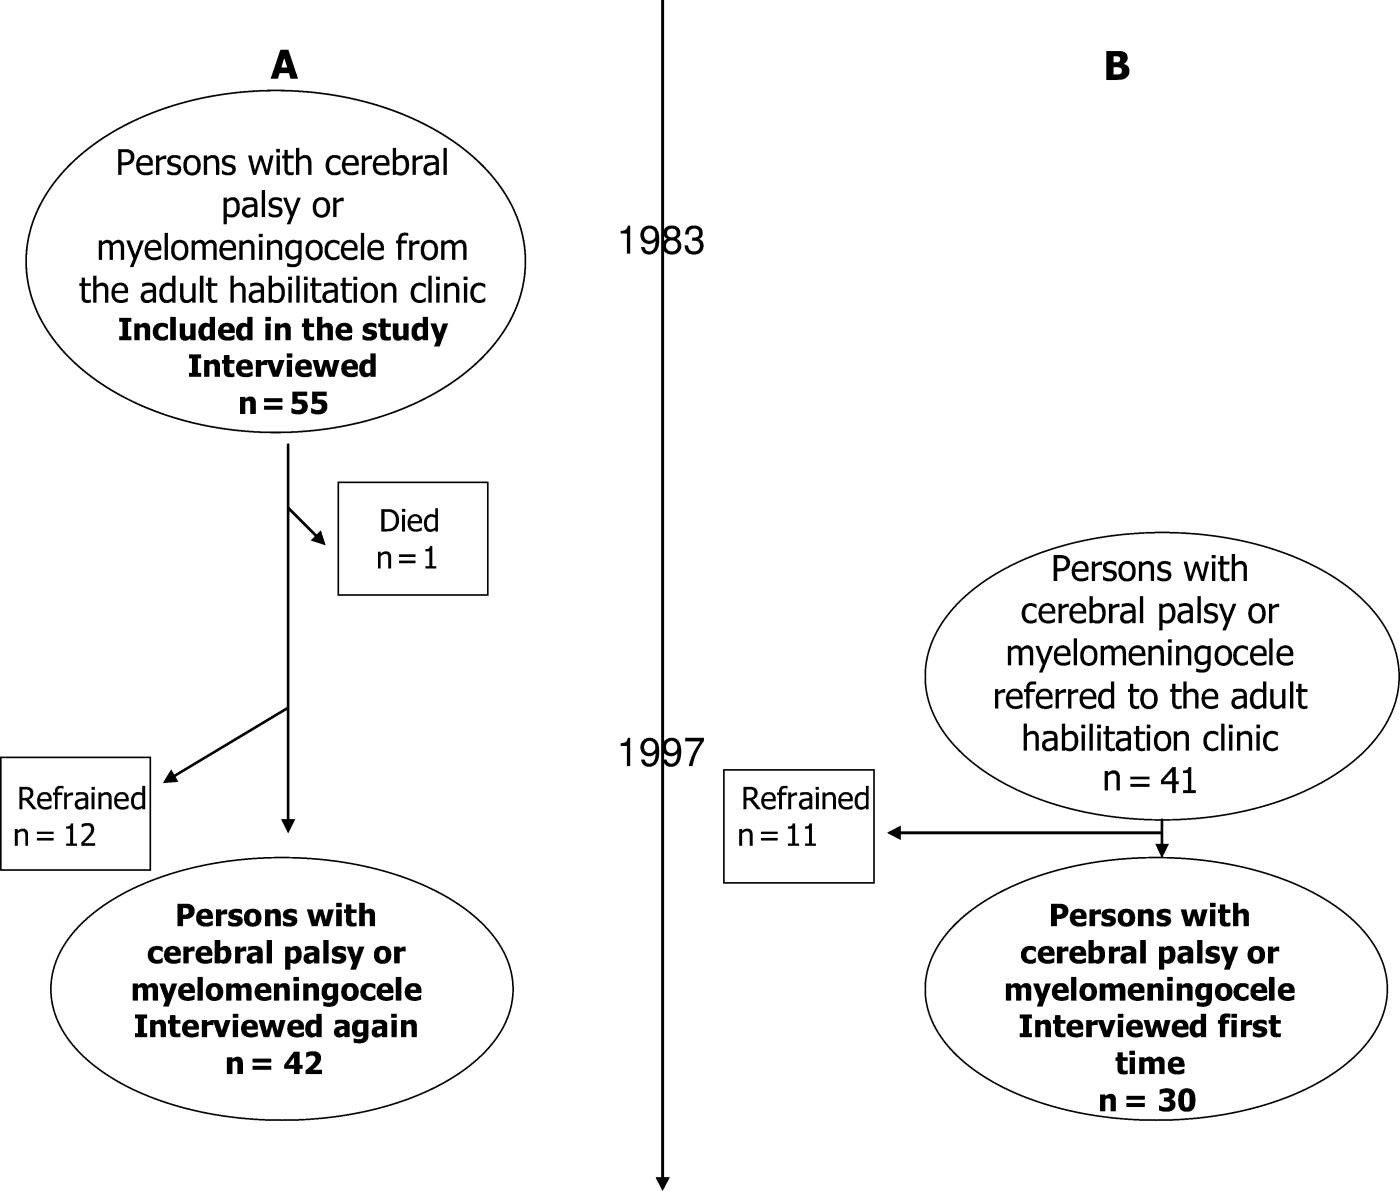
Figure 1. Data collections.

Table 1. Socio-economic status and number of people working or studying in Group A (1983 and 1997) and in Group B (1997) (CP+MMC).

Group AGroup B198319971997Socio-economic groupn%n%n%Employers0013Higher grade officials4725517Lower grade officials15271740413Workers16291229620Students101825517Not working or studying1018921930Total551004210030100Note: A (1983), A (1997) and B (1997) respectively, according to working or studying and not working or studying: A (1983) vs A(1997) not significant, A (1983) vs B (1997) not significant, A (1997) vs B (1997) not significant.

Table 2. Wage subsidies in Group A 1983 and 1997 and Group B 1997 (CP+MMC).

Group AGroup B198319971997Categoryn%n%n%Work with subsidies: 100%61161441350–75%61141062025%12250Work with no wage subsidies22401945620Not working203611261447Total551004210030100

Table 3. Experiences in Group A regarding employment in 1983 (CP+MMC) among subjects working.

1983Categoryn%Content2674Partly content823Not content13Note: 20 subjects in Group A did not work in 1983.

Table 4. Experiences about work in the Group A and Group B in 1997 (CP+MMC).

Group AGroup BCategoryn%n%Work tasks:Content22711594Partly content00Not content92916Work environment:Content20651063Partly content016Not content1135531Social support:Content28901594Partly content016Not content3100Note: 31 subjects of 42 worked in 1997 (Group A) and 16 subjects of 30 (Group B) worked in 1997.

Table 5. Levels of disability pension and other contributions from the state or community in Group A, 1983 and 1997, Group B in 1997 (CP+MMC).

198319971997Group AGroup AGroup BCategoryn%n%n%Sick-leave 100%2400Sick-leave 25–50%03713Disability pension 100%47819620Disability pension 25–75%132416381137Study contribution 50–100%7130517Unemployment benefit 50–100%24013Social service 50–100%12027Missing35120No contribution23421433413Total:551004210030100Note: A (1983), A (1997) and B (1997) respectively, according to contribution from state or community and no contribution from state or community: A (1983) vs A(1997) not significant, A (1983) vs B (1997) p<0.01 A (1997) vs B (1997) p<0.05. According to disability pension and no disability pension A (1983) vs A (1997) p<0.01, A (1983) vs B (1997) p<0.05 and A (1997) vs B (1997) not significant.
Language: English
Page range: 21 - 35
Submitted on: Jun 13, 2008
Accepted on: Feb 14, 2010
Published on: Oct 1, 2011
In partnership with: Paradigm Publishing Services

© 2011 Marie Törnbom, Jörgen Lundälv, Ann Jesperson, Katharina Stibrant Sunnerhagen, Gunnar Grimby, published by Stockholm University Press
This work is licensed under the Creative Commons Attribution 4.0 License.