
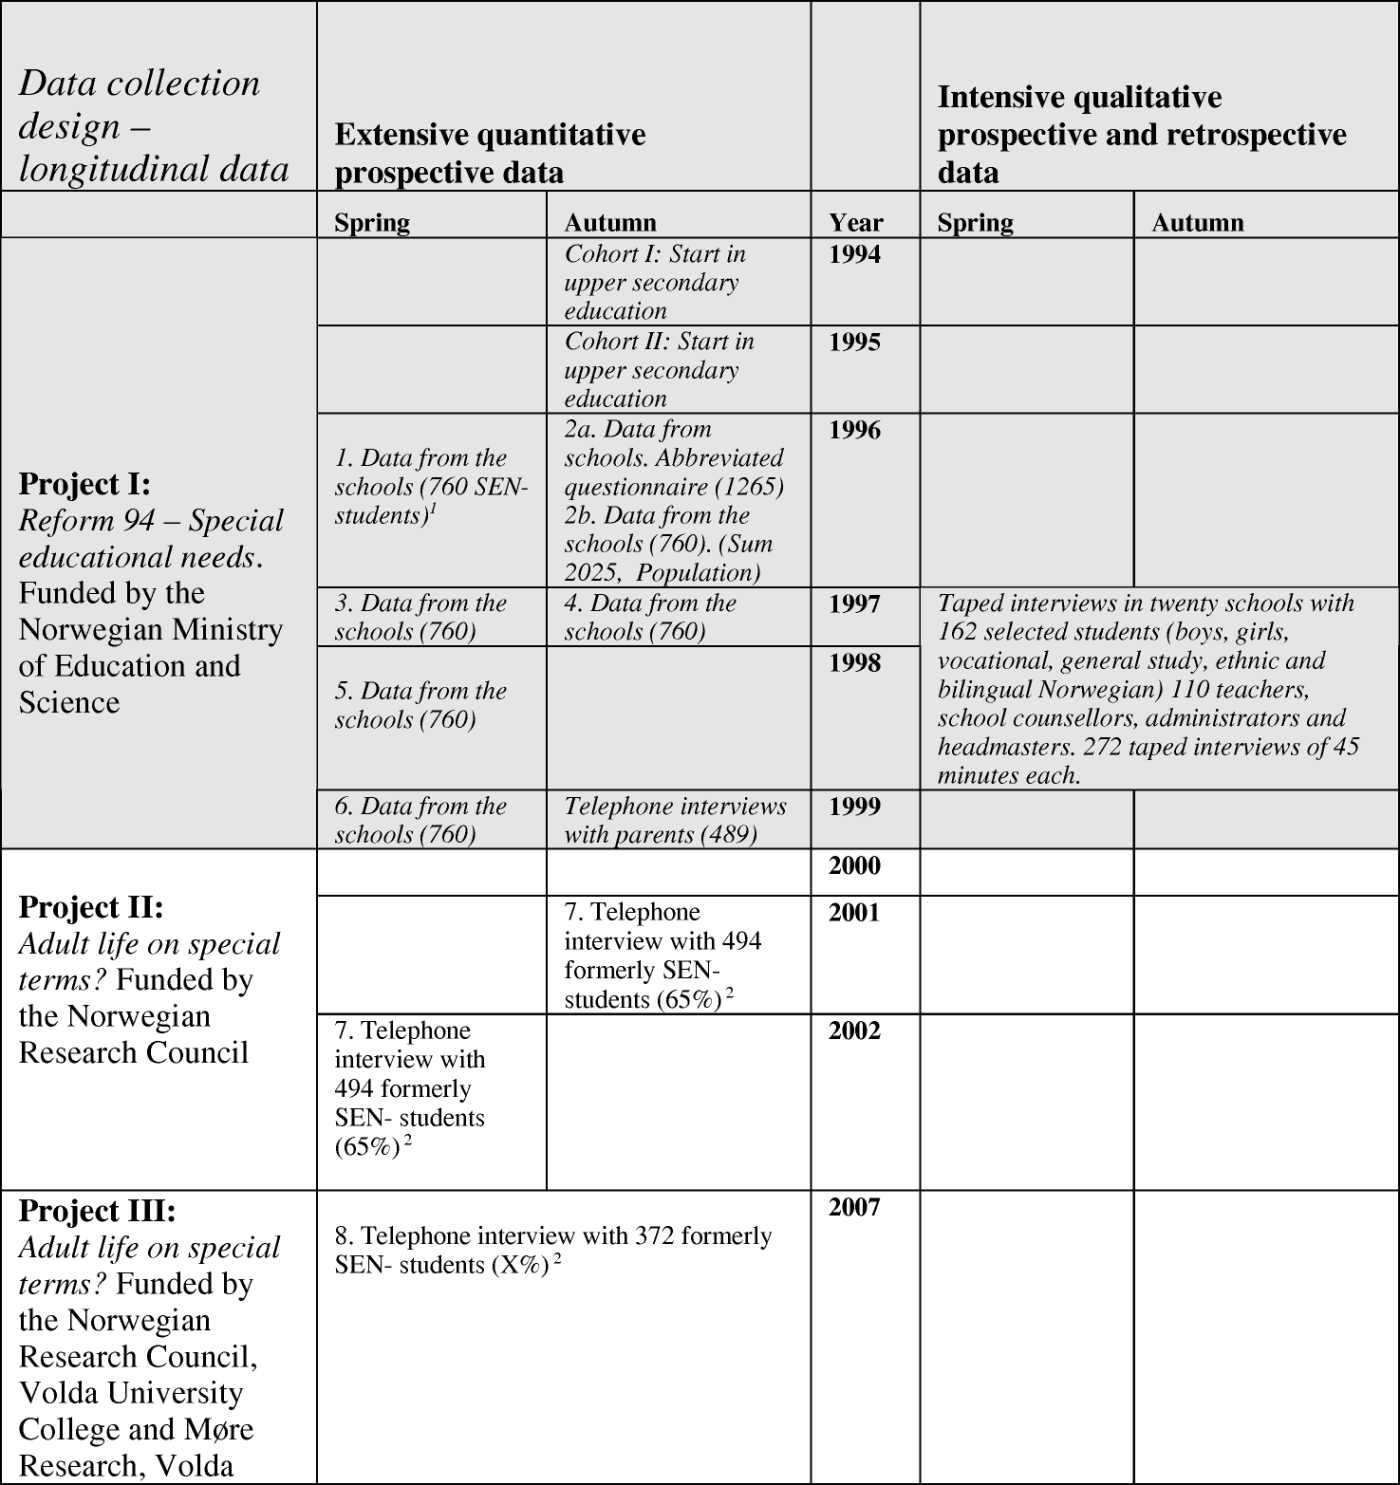
Figure 1.
Data collection design for the two research projects.
Notes: The present study is based on data from Project I and II. 1 Data on background variables, disabilities and special educational provision; 2 Data on ego-networks during spare time, work, independent life.
Table 1. Comparing students identified as having special educational need: 1996 population, 1996 and 2002 samples (expressed as a percentage).
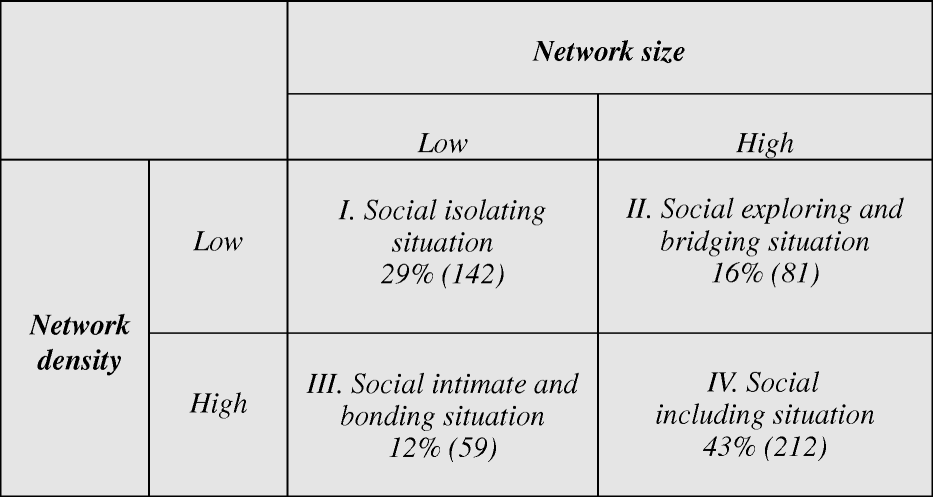
Figure 2.
Typology of adaptive situations and network qualities.
Note: Distribution during spare time at the beginning of adult life by network size and network density. Formerly students identified as ‘having special educational needs’ in upper secondary school (expressed as a percentage). (N = 494).
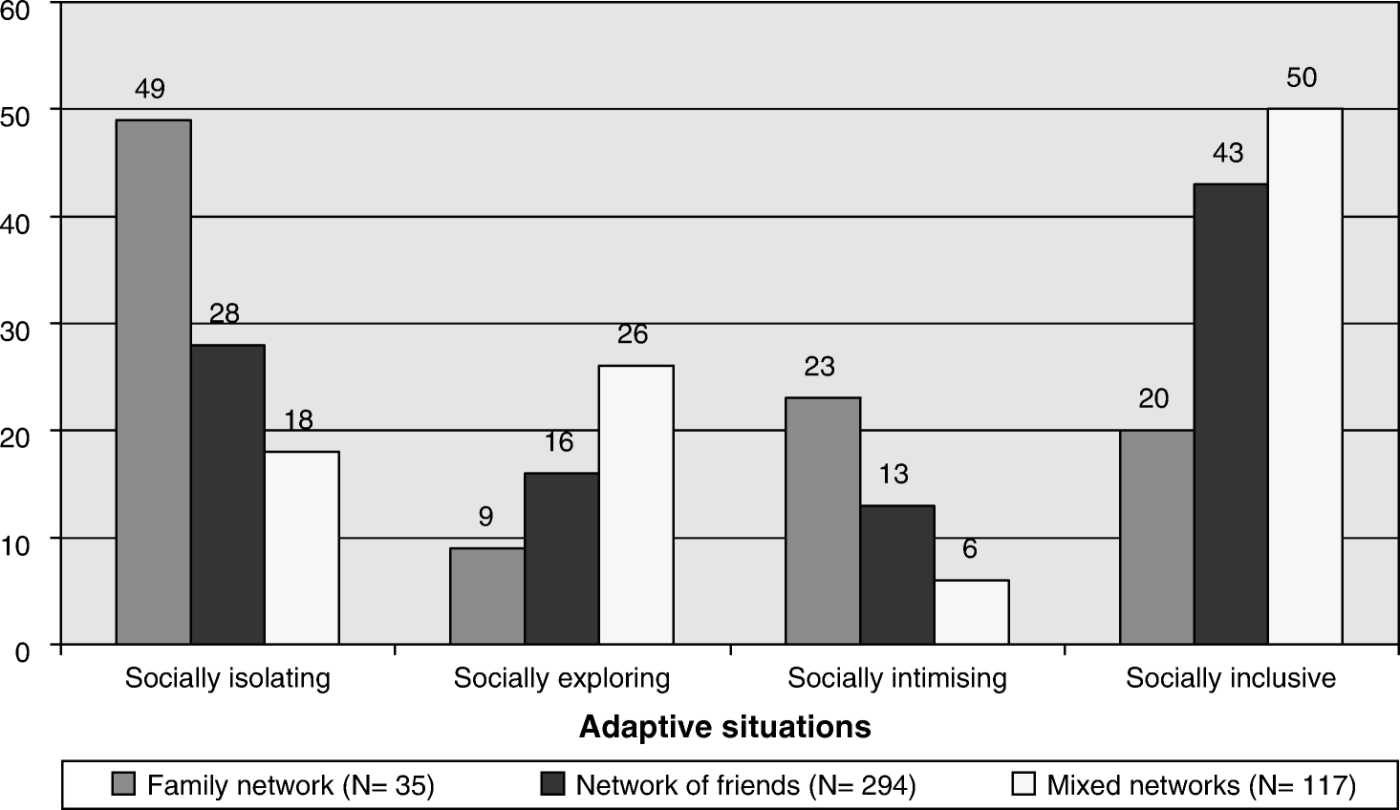
Figure 3.
Adaptive situation by network type at the beginning of adult life.
Note: Students formerly identified as ‘having special educational needs’ in upper secondary school (expressed as a percentage).