
Life area: WorkParticipationNo activity or activity without rehabilitation plan (‘drop-in’)Less participationPlanned rehabilitation activityInternship/subsidized employmentRegular employmentMore participationLife area: LivingParticipationNo residence or in treatment institution or group homeLess participationOwn apartment with intensive supportOwn apartment with limited supportIndependent living, alone or with othersMore participation
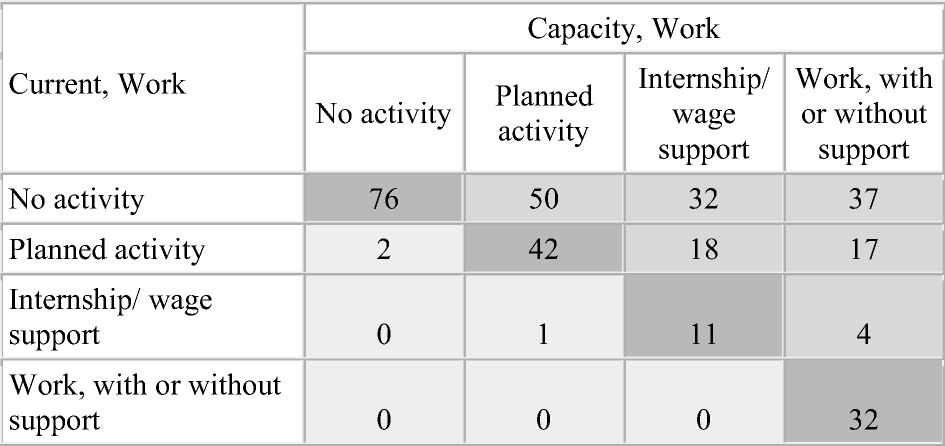
Figure 1.
Participation in work life, current and capacity.
Note: We notice for instance that 50 persons had ‘No activity’ as the current work life situation but were assessed to have capacity for the category ‘Planned activity’.
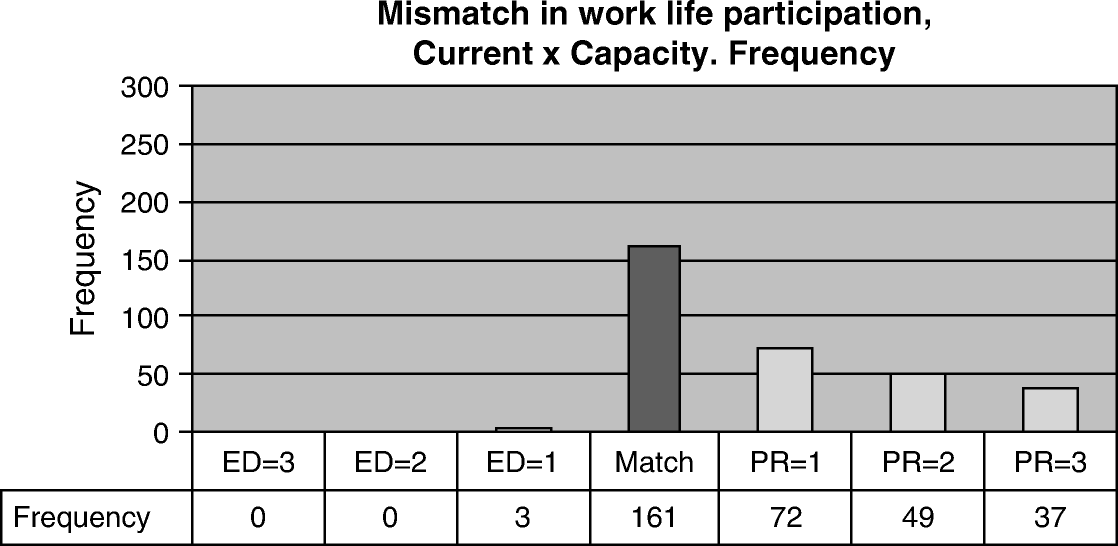
Figure 2.
Participation in work life: ED and PR mismatch.
Note: We see, that 49 of the clients had a two step mismatch of the participation restriction type.

Figure 3.
Participation in work life; ED, PR and total mismatch.
Note: PR-mismatch had a large value on the mean for number of steps of mismatch, 1.8 steps per client among those sharing this mismatch.
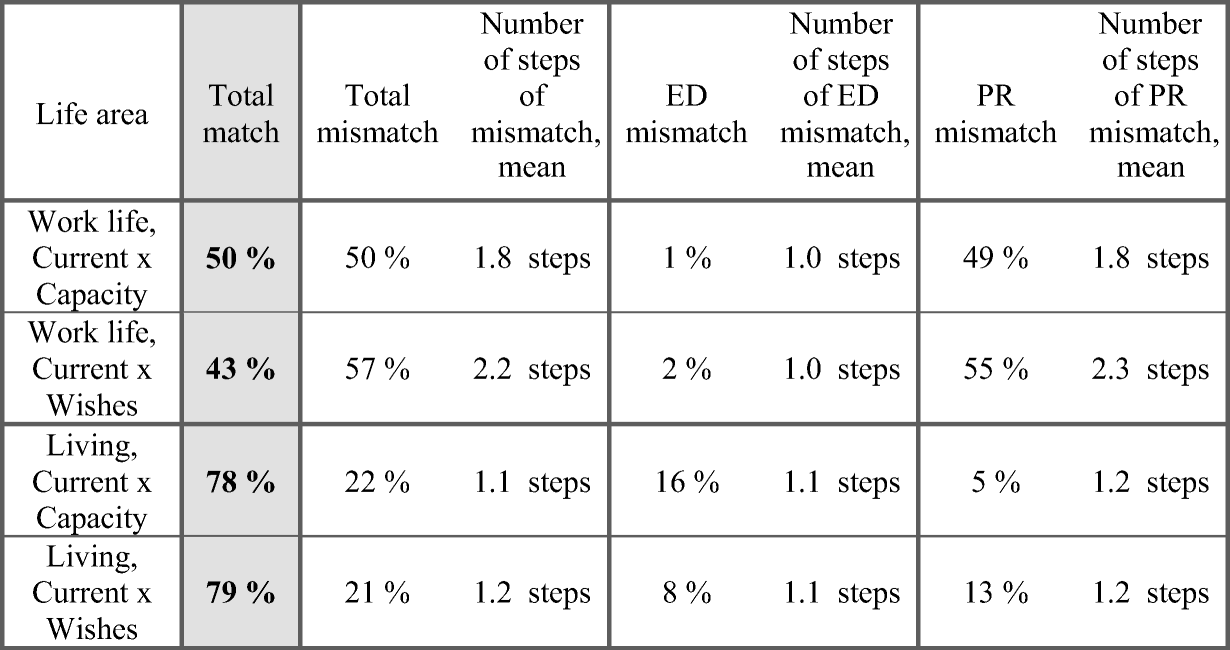
Figure 4.
Comprehensive result table for more than one life area.
Note: We may notice that the highest rate for match was 79% and was attained in life area living, between current state and wishes.