Fig. 1
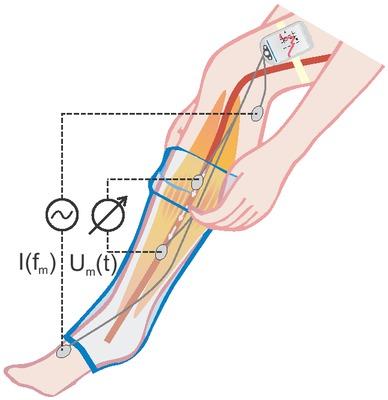
Fig. 2
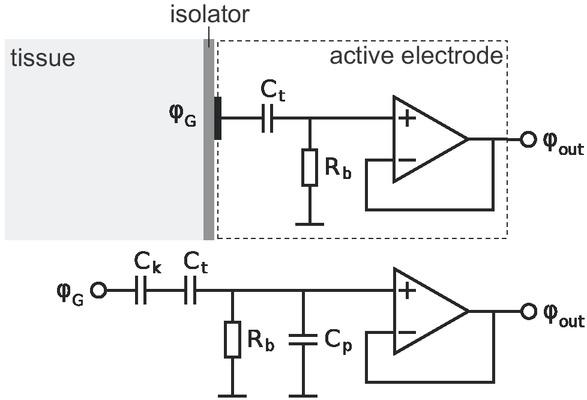
Fig. 3
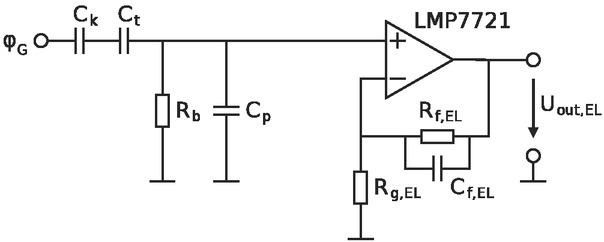
Fig. 4
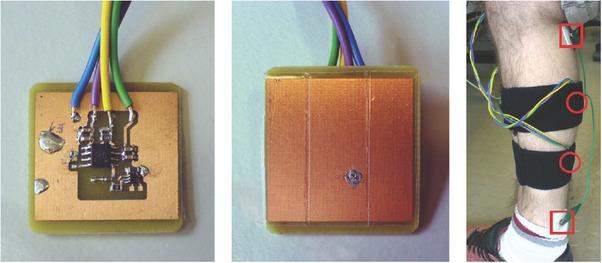
Fig. 5

Fig. 6
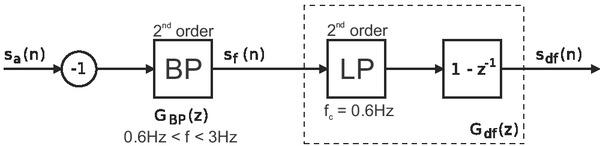
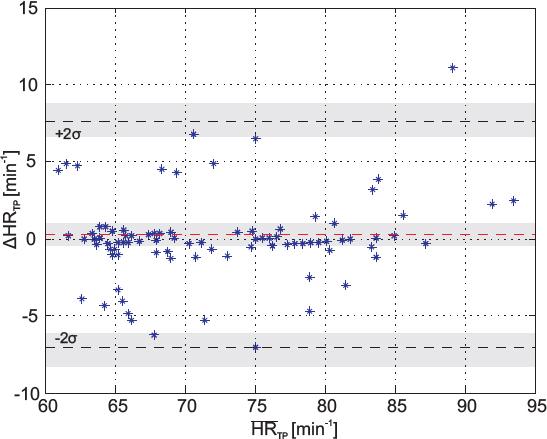
Fig. 7

Fig. 10
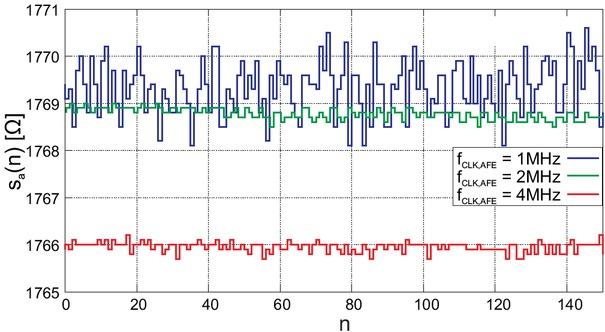
Fig. 9
Measurement period and number of detected pulse waves for the bent and stretched leg_
| period | NPPG | NIPG | NTP | NFN | NFP | |
|---|---|---|---|---|---|---|
| bent leg | 128 s | 150 | 97 | 97 | 53 | 0 |
| stretched leg | 100 s | 116 | 81 | 81 | 35 | 0 |

| period | NPPG | NIPG | NTP | NFN | NFP | |
|---|---|---|---|---|---|---|
| bent leg | 128 s | 150 | 97 | 97 | 53 | 0 |
| stretched leg | 100 s | 116 | 81 | 81 | 35 | 0 |
© 2015 Sören Weyer, Hannes Weber, Christian Kleeberg, Steffen Leonhardt, Tobias Wartzek, published by University of Oslo
This work is licensed under the Creative Commons Attribution-NonCommercial-NoDerivatives 3.0 License.