
Fig. 1
Fig.2
Fig. 3
Fig. 4
Fig. 5
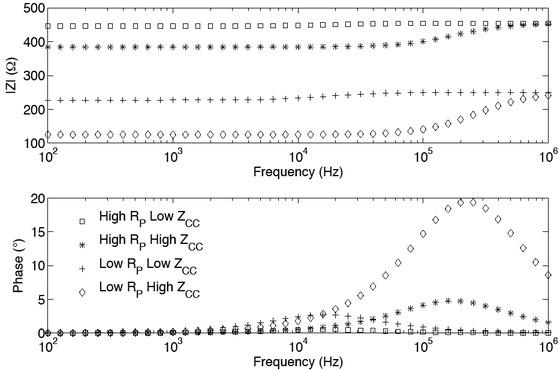
Fig. 6
Fig. 7

Fig. 8

Fig. 9
Fig. 10
The transfer resistance as calculated using the sensitivity, RSEN; numerical implementation of the measuring procedure, RFEM; through fitting the acquired data to the EEC model, RS_ The final row shows the pseudo geometric factor calculated for each approach through linear regression_
| Conductivity (S/m) | RSEN (Ω) | RFEM (Ω) | RS (Ω) |
|---|---|---|---|
| 0.1305 | 101.90 | 122.80 | 119.72 |
| 0.4617 | 28.80 | 34.70 | 36.10 |
| 1.1910 | 11.17 | 13.45 | 14.51 |
| Geometric factor | 13.3m-1 | 16.0m-1 | 15.7m-1 |
The variability of the impedance magnitude is calculated with the range expressed as a percentage of the mean_ The mean error of the magnitude is with respect to the true sample impedance_
| Case | Variability (%) | Mean Error (%) |
|---|---|---|
| High ZCC High RP | 17.00 | 20.35 |
| High ZCC Low RP | 80.53 | 71.14 |
| Low ZCC High RP | 1.80 | 9.98 |
| Low ZCC Low RP | 9.57 | 52.53 |