
Figure 1
Figure 2
![Model cross section of skin with a wound (W) as used in our computational scheme. The relevant length-scales and dielectric permittivities are given in Table 1 for the wound (W), stratum corneum (SC), living epidermis (E), dermis (D), and hypodermis (H). The depth (z) and radius (r) of the wound is set to 2 mm in order to comply with the wound size in the measurements we compare with [14]. The model is rotationally symmetric around the vertical r=0 axis. The actual calculations extend further to the right than shown in the figure (r=50 mm) to assure convergence.](https://sciendo-parsed.s3.eu-central-1.amazonaws.com/64721e25215d2f6c89dbc8e8/j_jeb.130_fig_002.jpg?X-Amz-Algorithm=AWS4-HMAC-SHA256&X-Amz-Content-Sha256=UNSIGNED-PAYLOAD&X-Amz-Credential=AKIA6AP2G7AKOUXAVR44%2F20251207%2Feu-central-1%2Fs3%2Faws4_request&X-Amz-Date=20251207T094515Z&X-Amz-Expires=3600&X-Amz-Signature=a7e9368cc265ac88a2b190eb4c2daaa3baefd796893c9556c4a4ea25e65a1bcc&X-Amz-SignedHeaders=host&x-amz-checksum-mode=ENABLED&x-id=GetObject)
Figure 3
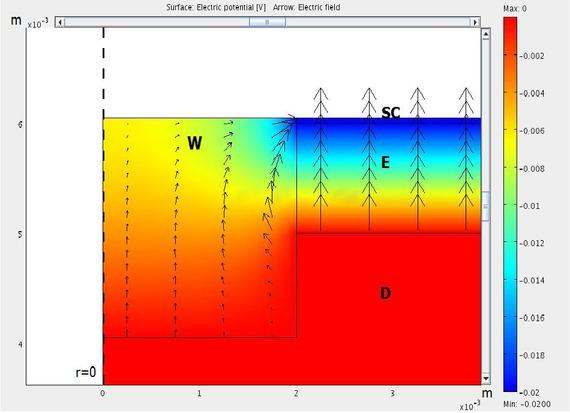
Figure 4
![Experimental surface potential scanning across a human wound [14]. 0.0 mm corresponds to the middle part of the wound, where the potential has its minimum value. The curve that has a maximum at 0.0 mm (red) is the topographical profile of the wound (swelling makes it peak at wound center). The curve that has a minimum at 0.0 mm (blue) represents the measured potential. Probe size is 0.5 mm.](https://sciendo-parsed.s3.eu-central-1.amazonaws.com/64721e25215d2f6c89dbc8e8/j_jeb.130_fig_004.jpg?X-Amz-Algorithm=AWS4-HMAC-SHA256&X-Amz-Content-Sha256=UNSIGNED-PAYLOAD&X-Amz-Credential=AKIA6AP2G7AKOUXAVR44%2F20251207%2Feu-central-1%2Fs3%2Faws4_request&X-Amz-Date=20251207T094515Z&X-Amz-Expires=3600&X-Amz-Signature=42df8f025523ba78255d8a4db05416fb60f28ea2c5c8135cd5bc35a4e19f653a&X-Amz-SignedHeaders=host&x-amz-checksum-mode=ENABLED&x-id=GetObject)
Figure 5
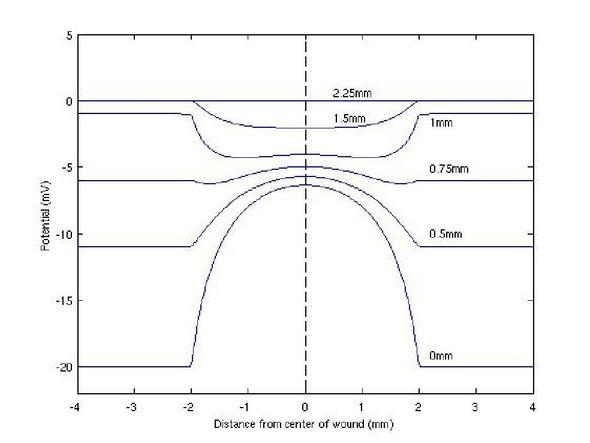
Figure 6
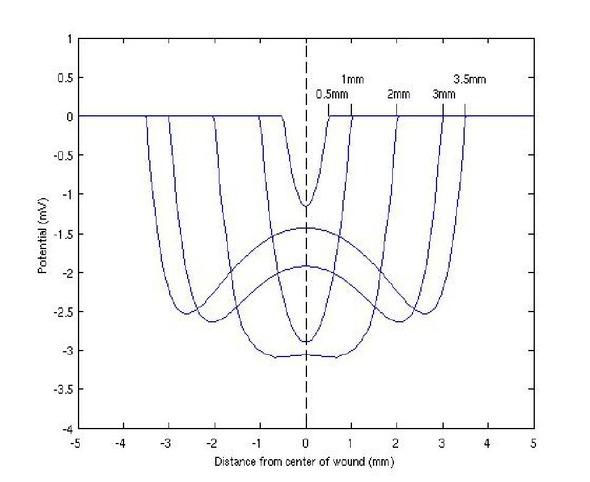
![Experimental potential variation in a wide wound [14]. (radius much greater than depth). The over-all potential shape resembles that of a narrow wound (Figure 4). However it has in addition a local maximum in the middle of the wound.](https://sciendo-parsed.s3.eu-central-1.amazonaws.com/64721e25215d2f6c89dbc8e8/j_jeb.130_fig_006.jpg?X-Amz-Algorithm=AWS4-HMAC-SHA256&X-Amz-Content-Sha256=UNSIGNED-PAYLOAD&X-Amz-Credential=AKIA6AP2G7AKOUXAVR44%2F20251207%2Feu-central-1%2Fs3%2Faws4_request&X-Amz-Date=20251207T094515Z&X-Amz-Expires=3600&X-Amz-Signature=da168cbbe94d195ea37cf85bc130fe043e59f836075cc2706dbd4b151a4fc2f9&X-Amz-SignedHeaders=host&x-amz-checksum-mode=ENABLED&x-id=GetObject)
Figure 7
Summary of modeling parameters used in the different areas_ εr is the static relative dielectric permittivity for wet tissue_
| Area | Block | Thickness (mm) [1] | εr |
|---|---|---|---|
| Wound | W | 2.0 | 80 [31] |
| Stratum Corneum | SC | 0.05 | 104 [32, 33] |
| Epidermis | E | 1.0 | 106 [32] |
| Dermis | D | 2.0 | 108 [30] |
| Hypodermis | H | 3.0 | 107 [30] |