
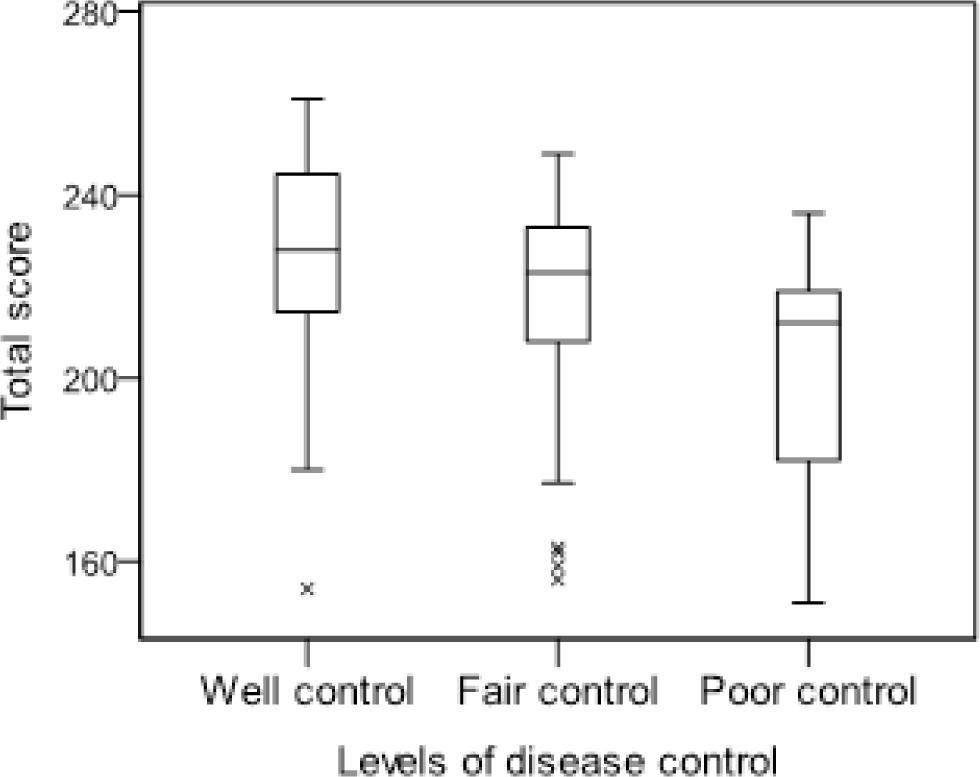
Figure 1
Characteristics of participants
| Characteristics | Step2 (n = 500) | Step3 (n = 200) | |
|---|---|---|---|
| Age (range 32–90 and 32–89) (years) | 66.1 ± 10.8 | 67.2 ± 11.0 | |
| Duration of type 2 diabetes (years) | 15.1 ± 8.4 | 15.8 ± 7.9 | |
| Sex (F/M) (%) | 66.8/33.2 | 68.0/32.0 | |
| Marital Status (%) | |||
| Single | 12.6 | 13.5 | |
| Married | 66.8 | 70.0 | |
| Widowed | 20.6 | 16.5 | |
| Education level (%) | |||
| Primary school or lower | 41.2 | 46.0 | |
| Secondary school | 21.6 | 23.0 | |
| University or higher | 37.2 | 31.0 | |
| Occupation (%) | |||
| Housework / not working | 48.0 | 59.5 | |
| Currently employed by government or private sector | 12.2 | 11.5 | |
| Privately owned business | 10.4 | 10.0 | |
| Retirement | 23.2 | 19.0 | |
| Other | 6.2 | – | |
| Therapy (%) | |||
| Diet control only | 2.2 | – | |
| Oral medicines only | 62.6 | 57.0 | |
| Insulin only | 2.4 | 1.0 | |
| Insulin + oral medicines | 32.8 | 42.0 | |
| Type of health insurance coverage (%) | |||
| Universal coverage scheme or Social security scheme | 10.4 | 10.0 | |
| Civil servant medical benefit scheme | 62.4 | 59.0 | |
| Out-of-pocket expense | 27.2 | 31.0 | |
| Living status (%) | |||
| Living with family | 87.4 | 86.5 | |
| Living with relative(s) | 7.6 | 7.5 | |
| Living alone | 5.0 | 6.0 | |
| Related complications (%) | |||
| Not have complications/comorbidity | 4.6 | 2.0 | |
| Have complications/comorbidity | 95.4 | 98.0 | |
| Mean HbAlc (%) | 7.4 ± 1.4 | 7.7 ± 1.7 | |
| Mean fasting plasma glucose (FPG) (mg/dl) | 140.0 ± 51.1 | 146.4 ± 59.7 | |
Goodness-of-fit summary for each dimension and the overall measurement models (n = 500)
| Measurement model | Index | Reliability coefficient | |||||
|---|---|---|---|---|---|---|---|
| χ2 | χ2/df | P | GFI | AGFI | RMSEA | Cronbach’s α | |
| PF model | 2.34 | 0.78 | 0.50 | 0.998 | 0.991 | 0.000 | 0.82 |
| Sym model | 14.68 | 1.47 | 0.14 | 0.992 | 0.977 | 0.031 | 0.90 |
| Psycho model | 1.70 | 0.56 | 0.64 | 0.999 | 0.993 | 0.000 | 0.72 |
| SM model | 42.07 | 1.27 | 0.13 | 0.986 | 0.967 | 0.023 | 0.85 |
| Soc model | 0.72 | 0.36 | 0.70 | 0.999 | 0.996 | 0.000 | 0.76 |
| GlobH model | 0.01 | 0.01 | 0.95 | 1.000 | 1.000 | 0.000 | 0.90 |
| Satis model | 0.72 | 0.24 | 0.87 | 0.999 | 0.997 | 0.000 | 0.84 |
| PRO-DM-Thai model | 5.23 | 0.87 | 0.51 | 0.997 | 0.986 | 0.000 | 0.91 |
Summary of statistical testing of PRO-DM-Thai to discriminate patients with difference levels of disease control assessed by physicians
| Technique | Spearman’s rank correlation (r) | Post hoc test and P of one-way ANOVA | Discriminant analysis Classified | Ranking | |||
|---|---|---|---|---|---|---|---|
| W > F | F > P | W > P | P | ||||
| Overall | 0.27 P < 0.001 | ✓ P < 0.05 | ✓ P < 0.05 | ✓ P < 0.05 | 0.001 P < 0.05 | Yes | +++ |
| Dimensions Physical Function | 0.03 | – | – | – | 0.913 | No | 0 |
| Symptoms | 0.29 P < 0.001 | ✓ P < 0.05 | – | P < 0.05 | <0.001 P < 0.001 | Yes | ++ |
| Psychological Well-being | 0.11 | – | – | – | 0.222 | No | 0 |
| Self-care management | 0.25 P < 0.001 | ✓ P < 0.05 | ✓ P < 0.05 | ✓ P < 0.05 | 0.002 P < 0.05 | Yes | ++ |
| Social well-being | 0.03 | – | – | – | 0.383 | No | 0 |
| Global judgments of health | 0.29 P < 0.001 | ✓ P < 0.05 | – | ✓ P < 0.05 | <0.001 P < 0.001 | Yes | +++ |
| Satisfaction with care and flexibility of treatment | 0.31 P < 0.001 | ✓ P < 0.05 | ✓ P < 0.05 | ✓ P < 0.05 | <0.001 P < 0.001 | Yes | +++ |
Summary of content development of PRO-DM-Thai
| Dimensions | Description | Questions items (abbreviations) | Item derivation | |||
|---|---|---|---|---|---|---|
| I-CVI | Reviews | Pt | Exp | |||
| Physical | Relating to physical ability | PF1 Self doing activities | 1.00 | ✓ [7, 10, | ✓ | ✓ |
| Function | and measuring physical | PF2 Self doing activities of daily living | 1.00 | 21-23, | ||
| (PF) | functioning e.g., mobility, | PF3 Self doing housework | 0.83 | 28, 33-38] | ||
| dexterity, range of | PF4 Self walking more than 500 meter | 0.83 | ||||
| movement, physical activity, | PF5 Self use of public transport | 1.00 | ||||
| activities of daily living | ||||||
| Symptoms | Relating to diabetes- | Syml Hypoglycemic symptoms | 1.00 | ✓ [7, 10, | ✓ | ✓ |
| (Sym) | specific symptoms and | Sym2 Hyperglycemic symptoms | 1.00 | 21-24, | ||
| diabetes-related symptoms | Sym3 Abnormal sypmtom at foot/feet | 1.00 | 28, 33, | |||
| e.g., hypoglycemia, | Sym4 Nephropathy-related symptoms | 1.00 | 36-39] | |||
| hyperglycemia, | Sym5 Cardiovascular disease-related | 1.00 | ||||
| neuropathy, nephropathy, | symptoms | |||||
| retinopathy | Sym6 Have a blurred vision | 1.00 | ||||
| Sym7 Have infected symptom in the body | 1.00 | |||||
| Psychological | Relating to psychological | Psychol Feel depression and anxiety | 1.00 | ✓ [7, 10, | ✓ | ✓ |
| Well-being | well-being especially | Psycho2 Can find a way to relieve stress | 1.00 | 21-24, 28 | ||
| (Psycho) | disease-related e.g., | Psycho3 Positive well-being and adjustment | 1.00 | 33-40] | ||
| anxiety, depression, coping, | Psycho4 Can live with life satisfaction | 1.00 | ||||
| positive well-being and adjustment, life satisfaction, concentration | Psycho5 Concentrate on work or activities | 0.83 | ||||
| Self-care | Relating to self-care | SM1 Able to look after yourself in time and | 1.00 | ✓ [7, 10, | ✓ | ✓ |
| management | behavior managing disease, | accurate if hypoglycemia occur | 21-24, | |||
| (SM) | able to follow | SM2 Able to look after yourself in time and | 1.00 | 27-30, | ||
| recommendations, | accurate if hyperglycemia occur | 33, | ||||
| exercising, check-ups, | SM3 Measure blood glucose level once a | 0.83 | 35-39] | |||
| monitoring, diet control, | week | |||||
| drug compliance | SM4 Weight control | 1.00 | ||||
| SM5 Look after feet health | 1.00 | |||||
| SM6 Sweet meal diet control | 1.00 | |||||
| SM7 Carbohydrate diet control | 1.00 | |||||
| SM8 High-fat diet control | 1.00 | |||||
| SM9 Salty foods diet control | 1.00 | |||||
| SM10 Avoid beverages contained alcohol | 1.00 | |||||
| SM11 Drug compliance | 1.00 | |||||
| SM12 Exercise at least 3–5 times a week | 1.00 | |||||
| Social well- | Relating to family and | Soc1 Family relations | 1.00 | ✓ [7, 10, | ✓ | ✓ |
| being (Soc) | intimate relations, social | Soc2 Friends and acquaintances relations | 1.00 | 23, 24, | ||
| contact, integration and | Soc3 Attend family activities | 1.00 | 28, | |||
| social opportunities, leisure | Soc4 Attend community events | 1.00 | 33-39] | |||
| activities, and satisfaction, | Soc5 Give advice to each other with | 1.00 | ||||
| travelling | diabetes patients | |||||
| Global | Relating to overall of | GlobH1 The hypoglycemia occur 3–4 times | 1.00 | ✓ [7, 10, | ✓ | ✓ |
| judgments | general quality of life and | a week | 21, 23, | |||
| of health | the impact of diabetes on | GlobH2 Physical examination to detect | 1.00 | 24, 28, | ||
| (GlobH) | general quality of life e.g., | complications of diabetes at least once a year | 33-40] | |||
| current health ratings, | GlobH3 The HbA1c more than 9% | 1.00 | ||||
| diabetes controls life, | GlobH4 Have a complication that much | 1.00 | ||||
| general restrictions, | affected on life | |||||
| diabetes restrictive, | GlobH5 Cannot do something due to be | 1.00 | ||||
| diabetes limits freedom | careful about the level of blood glucose | |||||
| Satisfaction | Relating to satisfaction | Satis1 Satisfied with information given by | 1.00 | ✓ [7, 10, | ✓ | ✓ |
| with care and | with care and treatment of | physicians and nurses | 21-24, | |||
| flexibility of | patients and care teams, | Satis2 Can apply the knowledge learned | 1.00 | 28, | ||
| treatment | (information, time, and | from doctors and nurses to control diabetes | 33-40] | |||
| (Satis) | care), access to care | Satis3 Satisfied with physician treatment | 1.00 | |||
| Satis4 Medical satisfaction | 1.00 | |||||
| Satis5 Satisfied with the process of health | 1.00 | |||||
| care services | ||||||
| Total 7 dimensions, 44 Items, Scale-content validity index average agreement: S-CVI/Ave = 0.96 | ||||||