
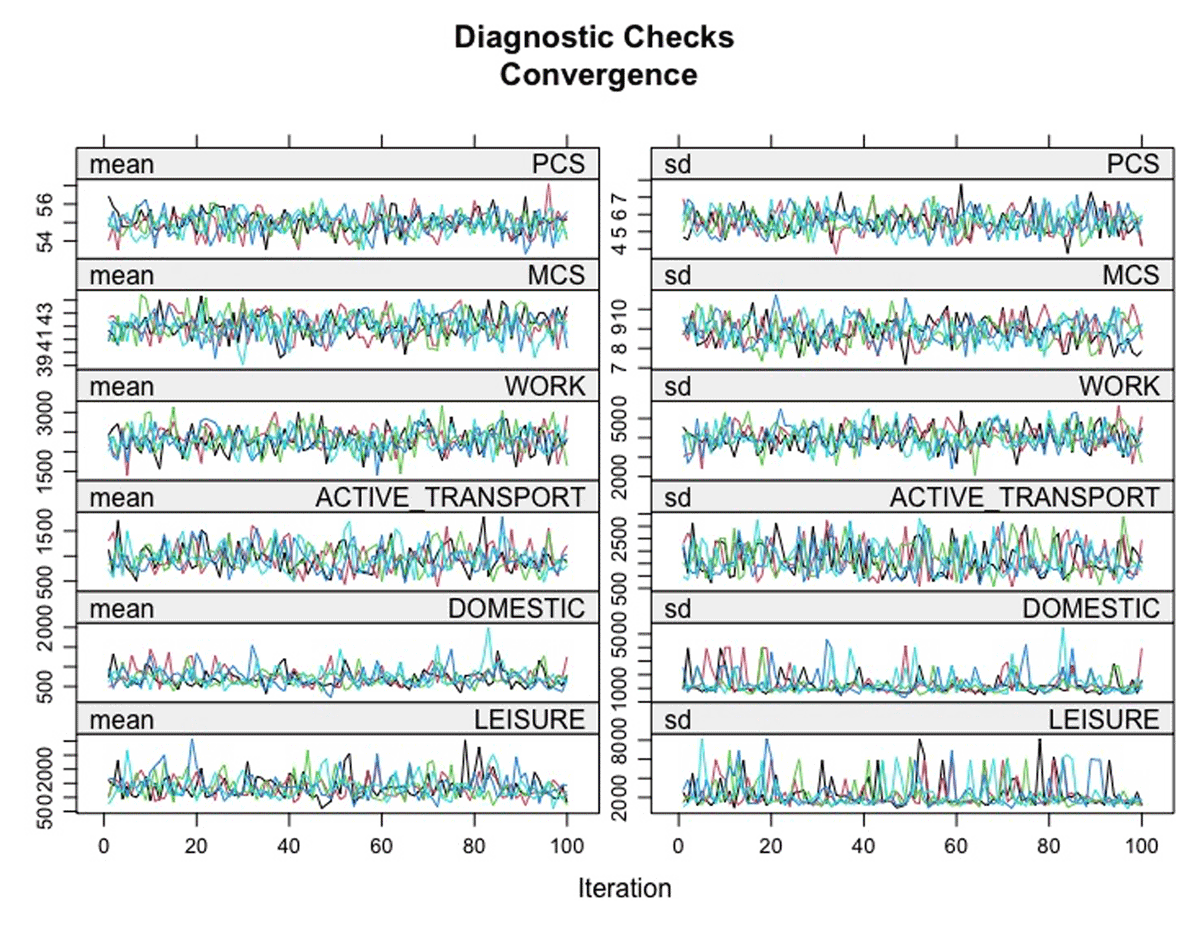
Figure 1
Diagnostic trace plots for the convergence of the Multivariate Imputation by Chained Equations (MICE) iterative Markov Chain Monte Carlo (MCMC) algorithm.
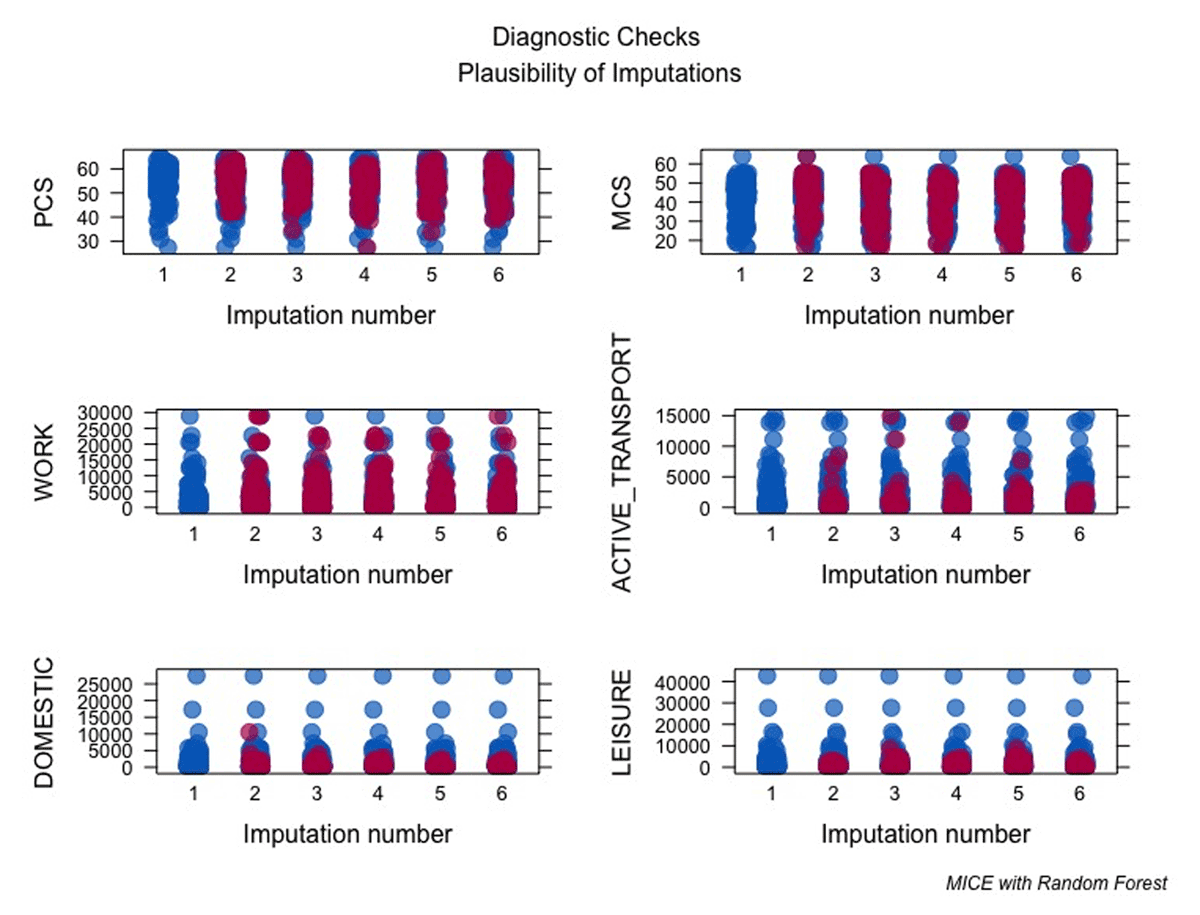
Figure 2
Diagnostic plots for the plausibility of Multivariate Imputation by Chained Equations (MICE) imputations.
Table 1
Demographic features representative of the sample participants.
| Demographic | N = 398* | ||
|---|---|---|---|
| Sex/Gender | Education | ||
| Female | 301 (76.2) | High School | 34 (15.5) |
| Male | 94 (23.8) | College/University | 86 (39.3) |
| Ethnicity | Graduate School | 99 (45.2) | |
| Hispanic | 22 (5.6) | Mother’s Education | |
| Non-Hispanic | 370 (94.4) | Below High School | 10 (2.8) |
| Race | High School | 118 (32.9) | |
| Asian | 25 (6.3) | College/University | 141 (39.3) |
| Black | 13 (3.3) | Graduate School | 90 (25.1) |
| Multiple | 18 (4.5) | Father’s Education | |
| White | 321 (81.1) | Below High School | 18 (5.1) |
| Other | 19 (4.8) | High School | 114 (32.4) |
| Role | College/University | 131 (37.2) | |
| Admin or Faculty | 39 (9.9) | Graduate School | 89 (25.3) |
| Graduate Student | 63 (16.0) | Greek Life | |
| Staff | 125 (31.7) | Current | 69 (39.9) |
| Undergraduate | 167 (42.4) | Former | 8 (4.6) |
| Age (years) | 32.3 (14.3) | Never | 96 (55.5) |
[i] * For Categorical Variables, table values are Count (%); For Continuous Variables, table values are Mean (SD); Nonresponses/NAs are removed from individual descriptive statistic calculations.
Table 2
Select physical activity measures and reported health of the sample participants.
| Demographic | N = 398* |
|---|---|
| Physical Health Composite Score | 55.3 (5.6) |
| Mental Health Composite Score | 42.1 (8.9) |
| Active/Transport MET Minutes per Week | 1216 (2102) |
| Domestic MET Minutes per Week | 1030 (2129) |
| Leisure MET Minutes per Week | 1704 (3306) |
| Work MET Minutes per Week | 2227 (4056) |
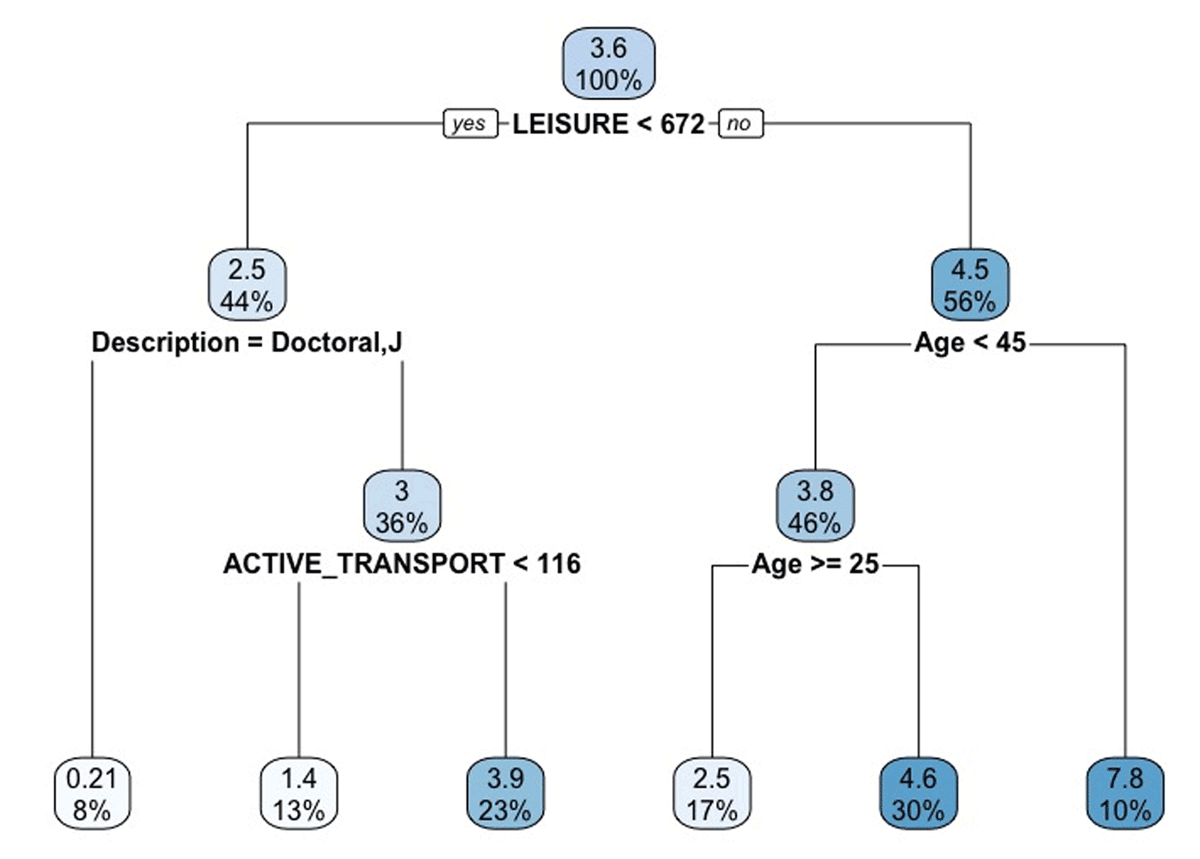
Figure 3
Regression tree predicting the age-specific mean difference score for physical health.
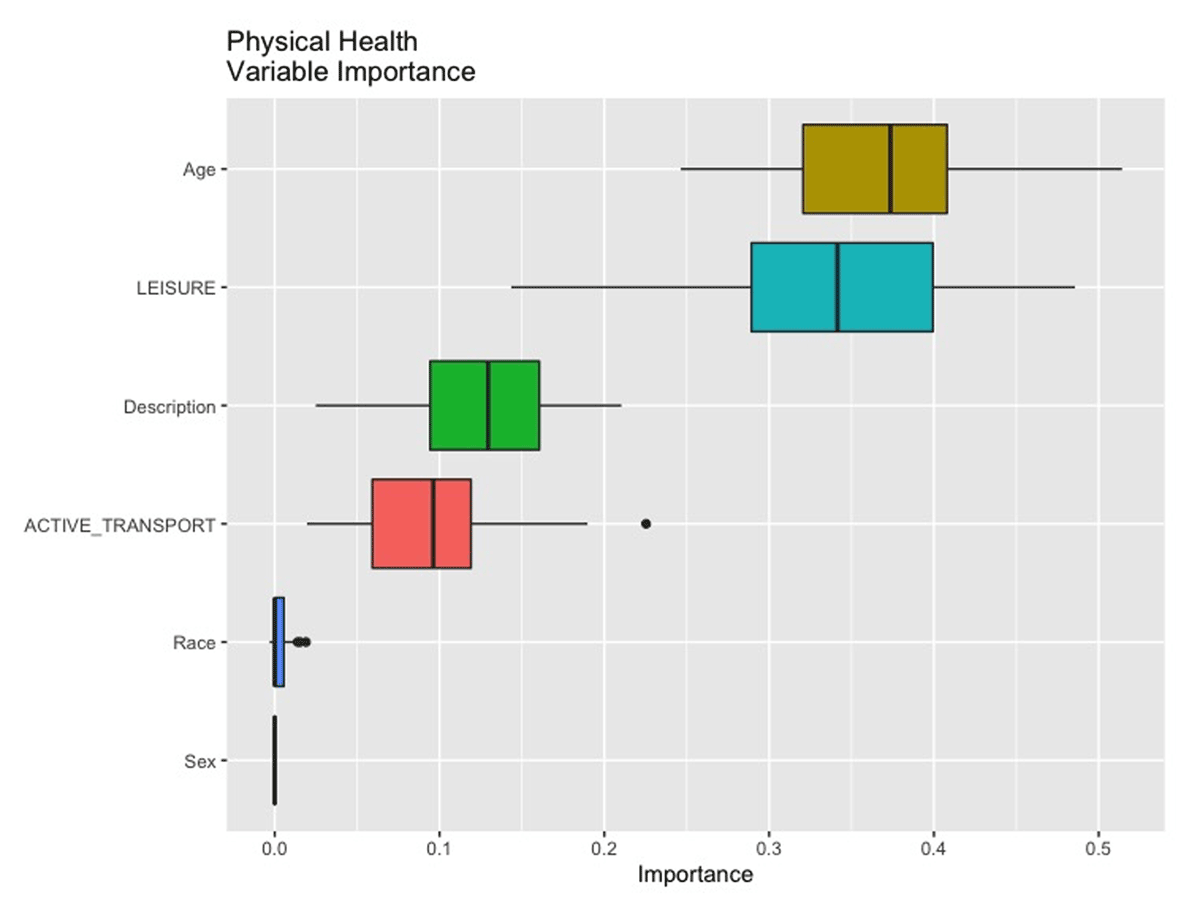
Figure 4
Mean variable-importance using the Root Mean Squared Error (RMSE) loss-function for predicting age-specific mean differences in physical health.
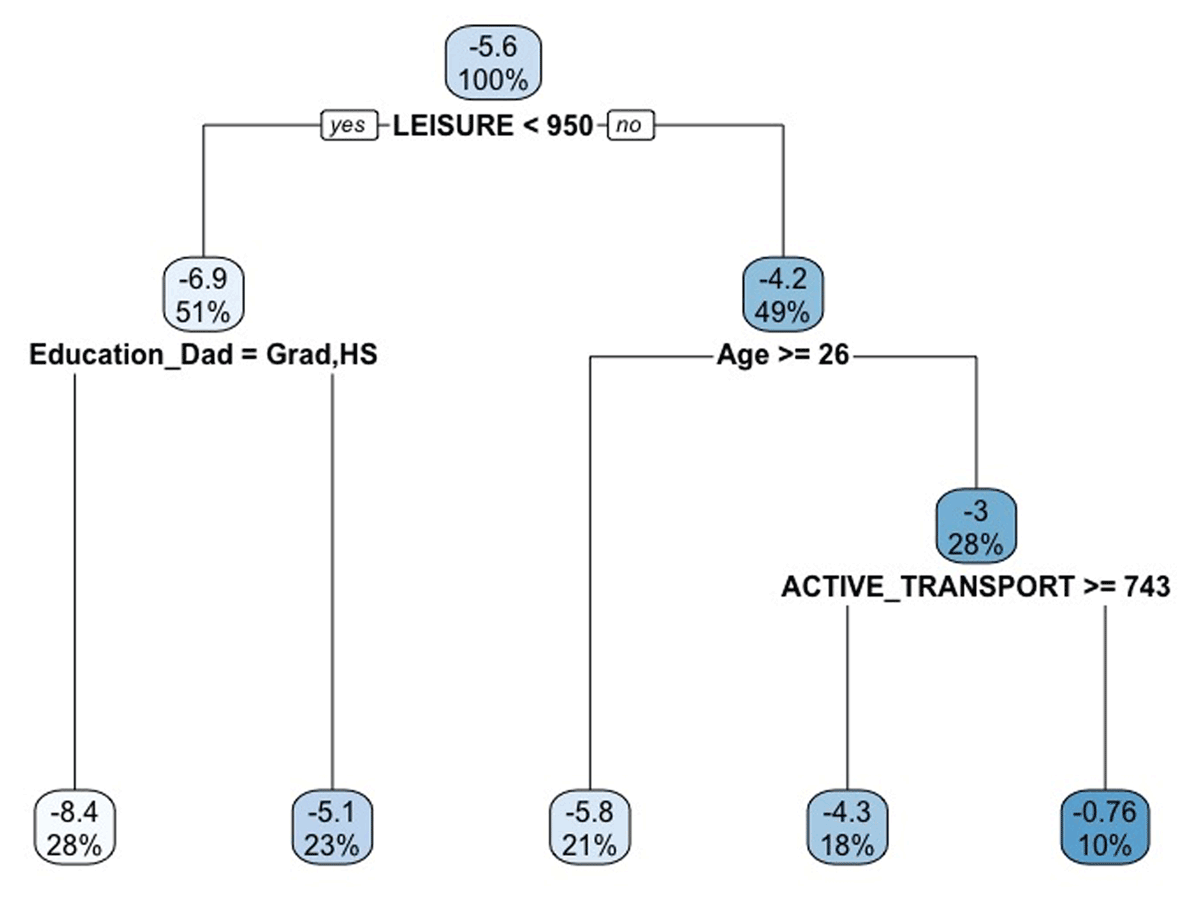
Figure 5
Regression tree predicting the age-specific mean difference score for mental health.
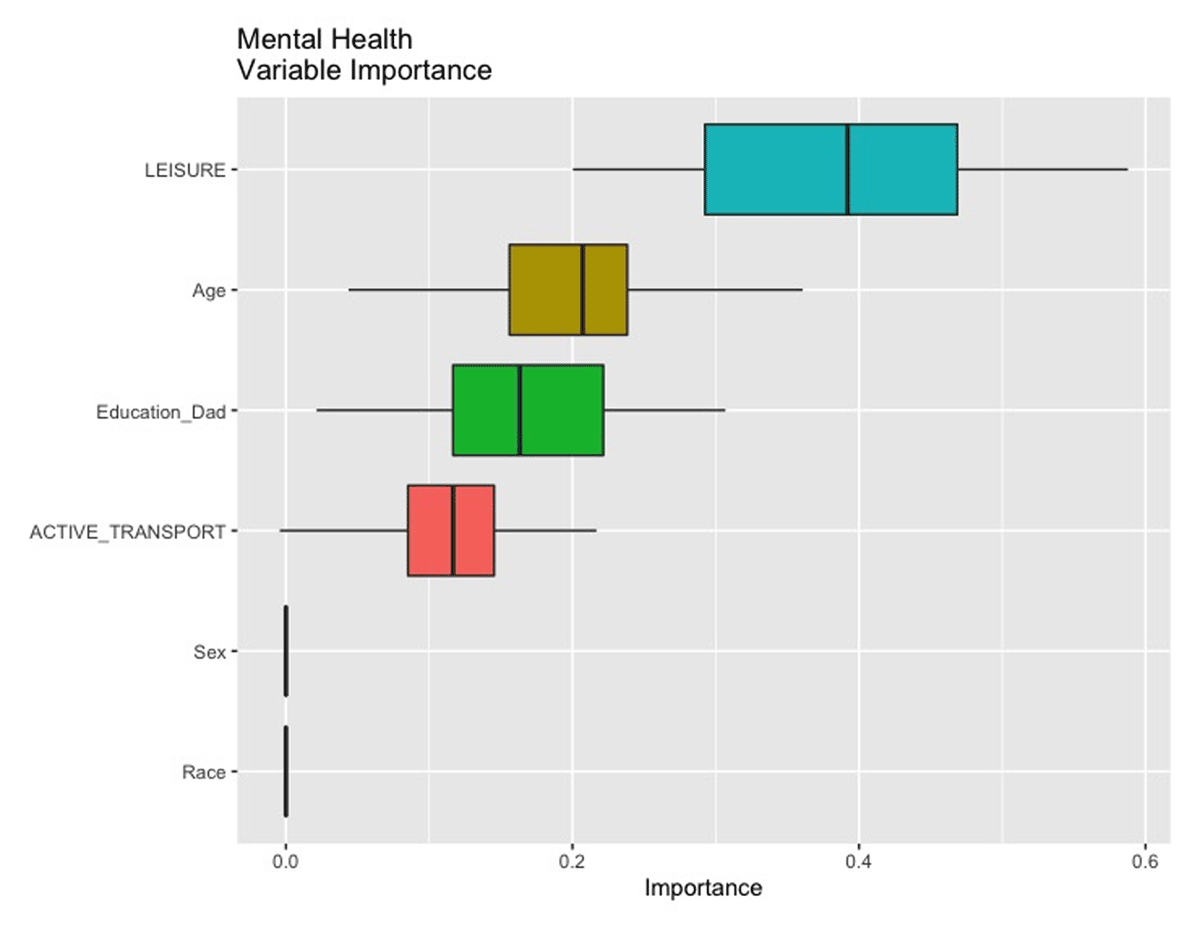
Figure 6
Mean variable-importance using the Root Mean Squared Error (RMSE) loss-function for predicting age-specific mean differences in mental health.