
Table 1
Participants by year.
| Year | Female | Male | Other | Total |
|---|---|---|---|---|
| 1st Year | 495 | 375 | 2 | 872 |
| 2nd Year | 499 | 387 | 8 | 894 |
| 3rd Year | 601 | 402 | 8 | 1011 |
| 4th Year | 781 | 625 | 5 | 1411 |
| 5th Year | 591 | 390 | 2 | 983 |
| 6th year | 280 | 207 | 3 | 490 |
| Total | 3247 | 2386 | 28 | 5661 |
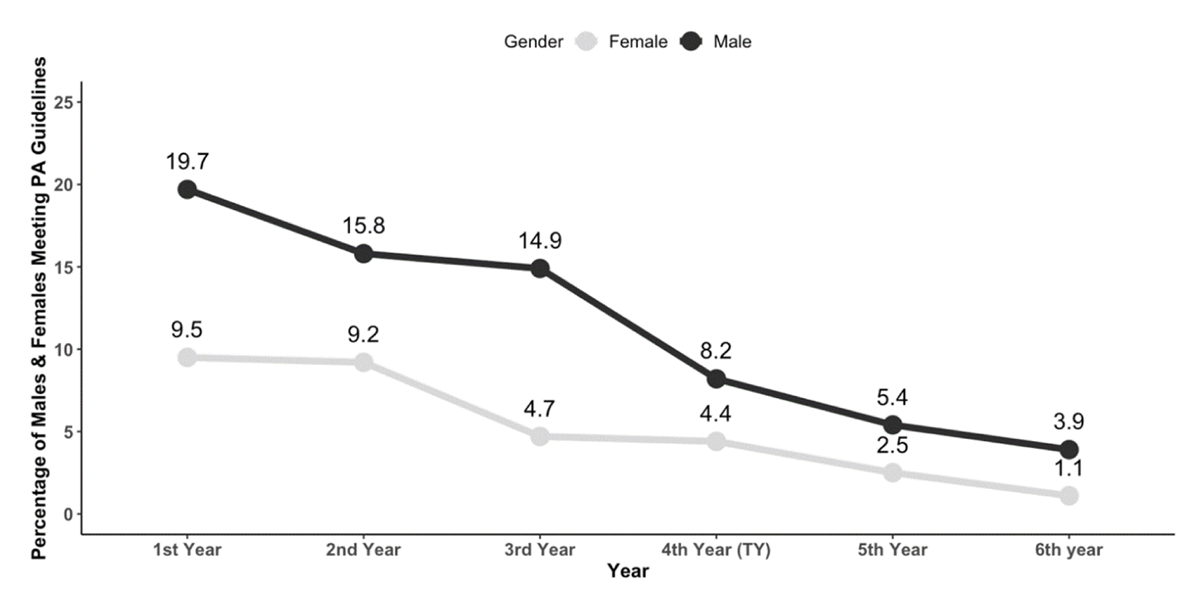
Figure 1
Percentage of students meeting PA guidelines by year and gender.
Table 2
Frequency of physical activity among males and females by year.
| Least Active (0–3 days) (% within sex) | Somewhat Active (4–7 days) (% within sex) | Most Active (8–14 days) (% within sex) | Sufficiently Active (% within sex) | |||||
|---|---|---|---|---|---|---|---|---|
| Male | Female | Male | Female | Male | Female | Male | Female | |
| 1st Year | 8.8% | 17.6% | 26.9% | 36.0% | 64.3% | 46.5% | 19.7% | 9.5% |
| 2nd Year | 11.1% | 19.6% | 31.0% | 36.7% | 57.9% | 43.7% | 15.8% | 9.2% |
| 3rd Year | 11.9% | 22.8% | 29.9% | 40.9% | 58.2% | 36.3% | 14.9% | 4.7% |
| 4th Year | 13.0% | 24.1% | 35.7% | 41.4% | 51.4% | 34.6% | 8.2% | 4.4% |
| 5th Year | 14.4% | 25.0% | 33.6% | 41.6% | 52.1% | 33.3% | 5.4% | 2.5% |
| 6th Year | 13.0% | 29.0% | 43.5% | 40.9% | 43.5% | 30.1% | 3.9% | 1.1% |
| Mean | 12.1% | 22.8% | 32.9% | 39.7% | 55.0% | 37.5% | 11.5% | 5.3% |
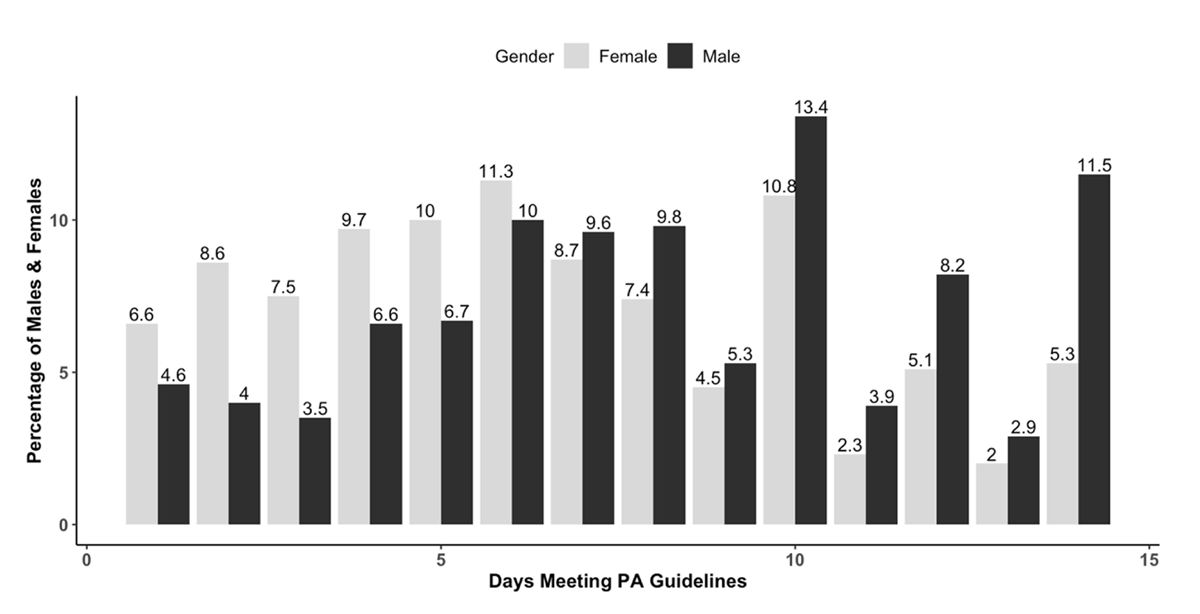
Figure 2
Days of physical activity 60+ min during past 2 weeks.
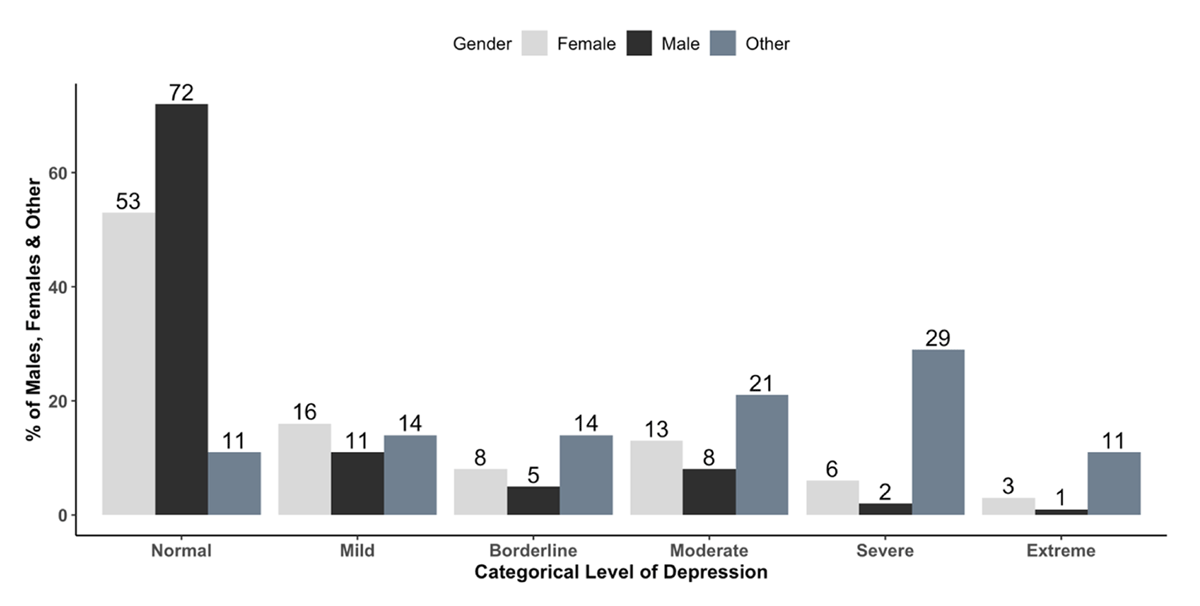
Figure 3
Participants by category of depression and gender.
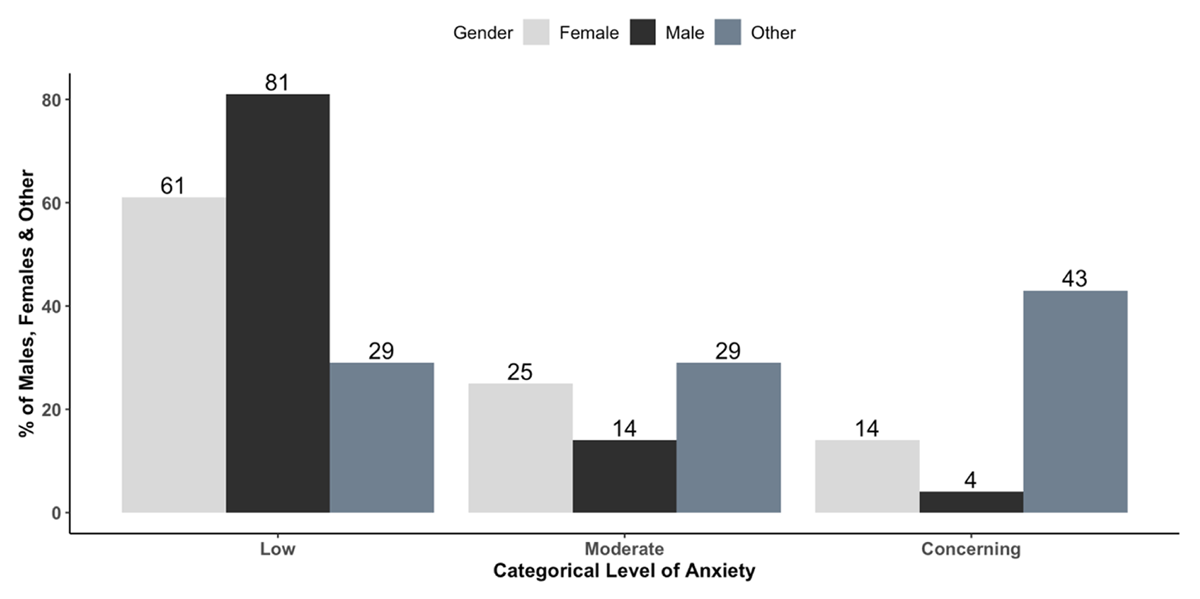
Figure 4
Participants by category of anxiety and gender.
Table 3
Mental health outcomes by year and gender.
| Year | Depression Mean (SD) | Anxiety Mean (SD) | Wellbeing Mean (SD) | ||||||
|---|---|---|---|---|---|---|---|---|---|
| Male | Female | Other | Male | Female | Other | Male | Female | Other | |
| 1st | 6.5(8.6) | 7.9(9.2) | 19.5(00.7 | 11.3(11.3) | 14.7(12.4) | 26.5(17.7) | 51.1(8.1) | 48.2(8.6) | 36.5(3.5) |
| 2nd | 8.7(10.5) | 12.6(11.7) | 25.1(16.3) | 13.9(11.3) | 19.5(13.8) | 28.5(19.6) | 49.4(9.3) | 46.3(9.7) | 35.4(5.2) |
| 3rd | 9.1(10.2) | 14.8(12.2) | 23.0(13.8) | 13.7(10.9) | 21.2(13.8) | 30.1(17.9) | 48.5(8.8) | 44.1(9.3) | 40.6(5.9) |
| 4th | 7.6(8.9) | 13.5(11.2) | 23.6(9.6) | 12.5(10.6) | 20.1(12.6) | 28.0(9.9) | 49.8(8.2) | 45.5(9.1) | 44.2(9.2) |
| 5th | 8.4(9.7) | 14.2(11.5) | 38.0(4.2) | 12.3(10.5) | 20.2(13.1) | 36.0(8.5) | 49.0(9.1) | 43.9(9.2) | 24.5(6.4) |
| 6th | 9.3(9.2) | 14.1(11.4) | 41.0(18.1) | 12.6(10.5) | 21.1(14.0) | 47.0(14.7) | 47.2(7.9) | 43.3(9.3) | 24.3(5.5) |
| Mean | 8.4(9.6) | 13.6(11.4) | 26.7(14.2) | 13.3(10.8) | 19.1(13.4) | 31.4(16.2) | 49.4(8.6) | 45.3(9.3) | 36.6(8.7) |
Table 4
Number of sports played and associations with wellbeing, depression and anxiety by gender.
| Physical Activity Subgroup | Percentage of | Wellbeing Mean (SD) | Depression Mean (SD) | Anxiety Mean (SD) | ||||
|---|---|---|---|---|---|---|---|---|
| Male | Female | Male | Female | Male | Female | Male | Female | |
| Least Active (0–3 days) | 12.1% | 22.8% | 45.9(9.3) | 42.0(9.9) | 10.9(10.7) | 16.3(12.9) | 15.5(11.3) | 22.5(14.0) |
| Somewhat Active (4–7 days) | 32.9% | 39.7% | 48.9(8.2) | 45.1(8.7) | 8.6(9.4) | 12.9(11.0) | 13.2(11.4) | 20.0(13.2) |
| Most Active (8–14 days) | 55.0% | 37.5% | 50.4(8.5) | 47.6(9.0) | 7.3(9.2) | 10.9(10.6) | 11.8(10.3) | 17.2(12.7) |
| Number of Sports Played | Male | Female | Male | Female | Male | Female | Male | Female |
| 0 | 14% | 24% | 45.6(9.8) | 41.9(9.7) | 11.6(11.2) | 17.0(12.7) | 15.9(12.5) | 23.1(14.1) |
| 1 | 24% | 32% | 48.9(8.8) | 44.8(9.1) | 8.6(10.2) | 13.2(11.2) | 12.7(10.7) | 20.2(13.3) |
| 2 | 31% | 27% | 50.2(7.7) | 47.0(8.6) | 7.7(8.6) | 10.9(10.3) | 12.6(10.7) | 17.4(12.6) |
| 3+ | 31% | 18% | 50.5(8.4) | 48.3(8.6) | 6.8(8.7) | 9.9(10.1) | 11.5(10.2) | 16.5(12.2) |
| Team Sport | Male | Female | Male | Female | Male | Female | Male | Female |
| Yes | 76% | 58% | 50.1(8.2) | 46.9(8.8) | 7.3(8.8) | 11.0(10.3) | 11.8(10.1) | 17.4(12.5) |
| No | 24% | 42% | 47.1(9.6) | 43.1(9.6) | 10.7(11.1) | 15.7(12.5) | 15.7(12.5) | 22.4(13.9) |