
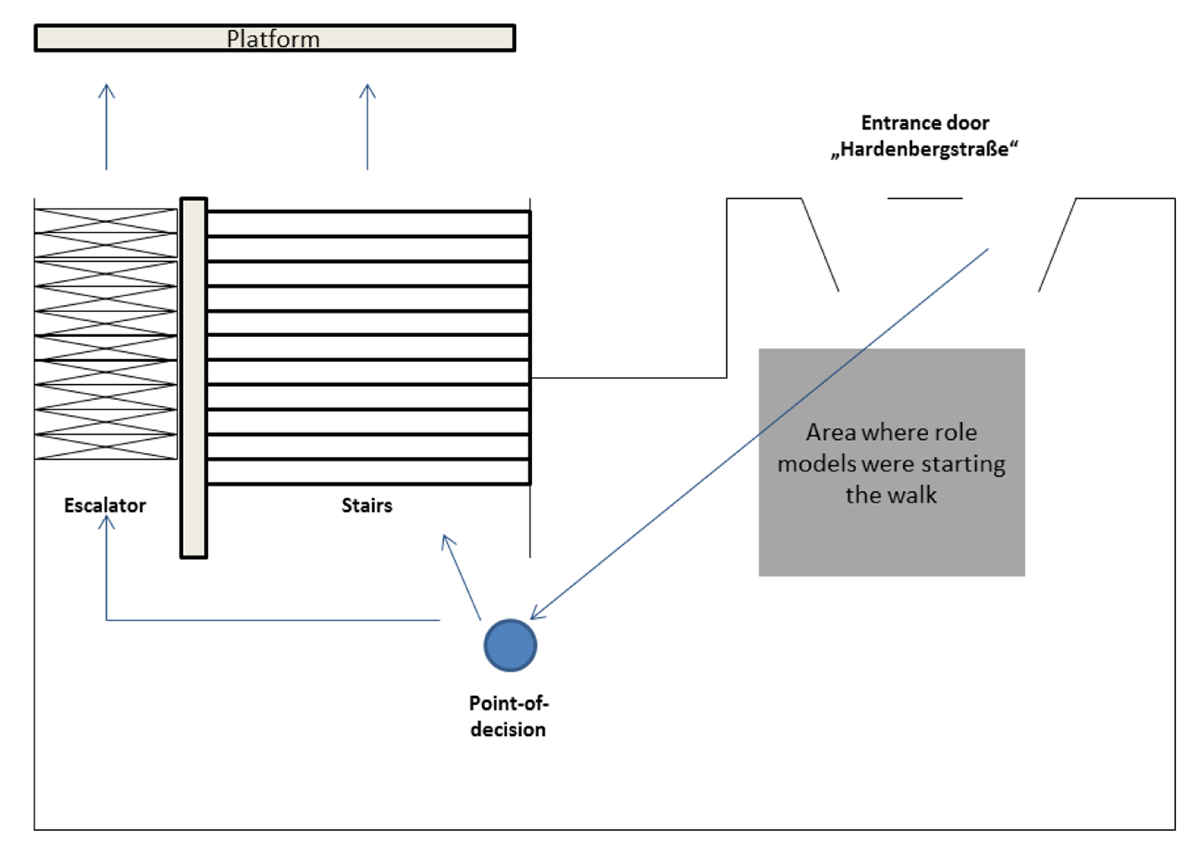
Figure 1
Passenger’s path to the staircase.
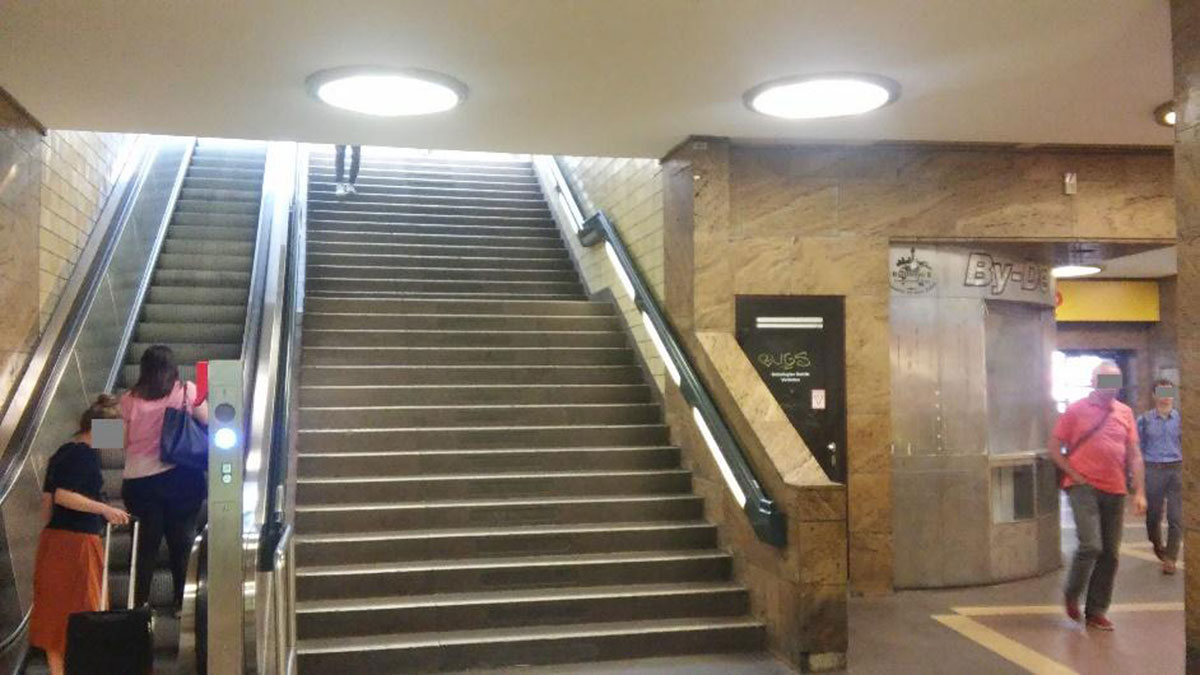
Figure 2
Setting at “S-Bahnhof Zoologischer Garten”, Berlin.
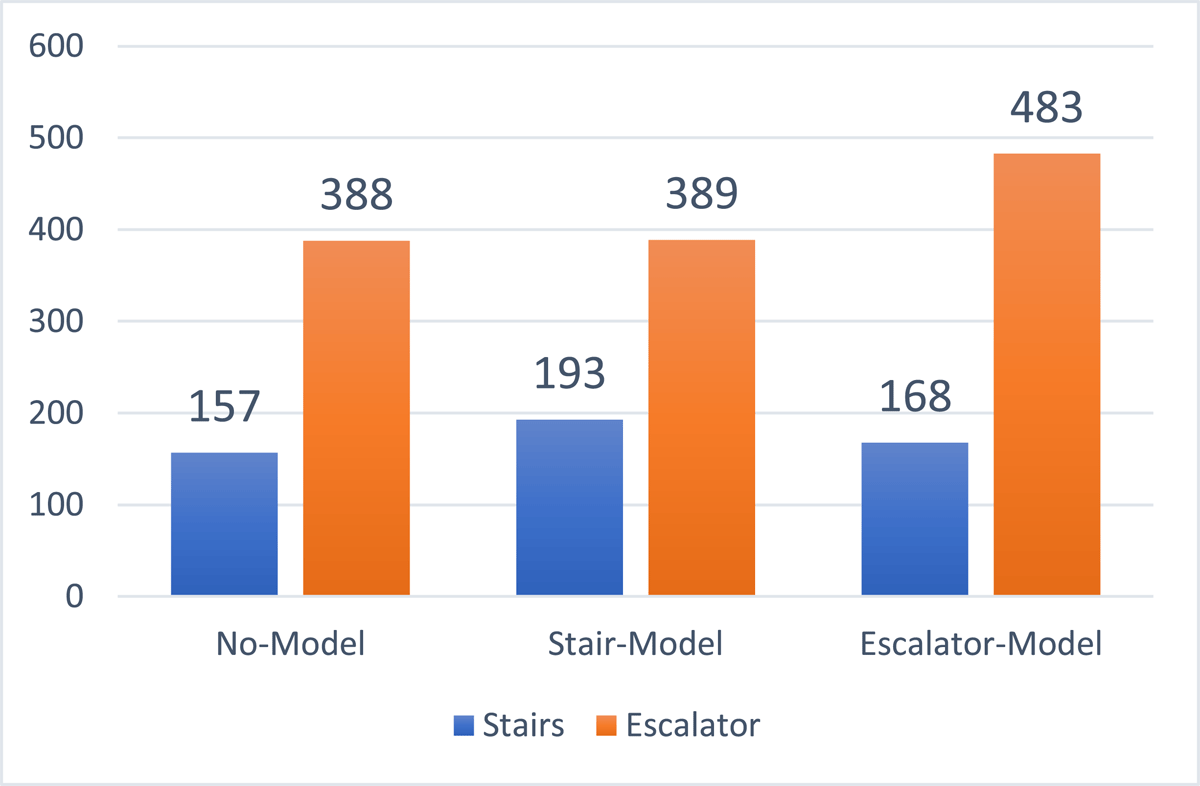
Figure 3
Counts of participants by Intervention Type and Decision.
Table 1
Stair and Escalator Use by Intervention Type.
| Intervention Type | Decision | ||
|---|---|---|---|
| Stairs | Escalator | Total | |
| Control (no model) | |||
| total count | 157 | 388 | 545 (31%) |
| share | 29% | 71% | |
| Stair-Model | |||
| total count | 193 | 389 | 582 (33%) |
| share | 33% | 67% | |
| Escalator-Model | |||
| total count | 168 | 483 | 651 (37%) |
| share | 26% | 74% | |
| Total | |||
| total count | 518 | 1260 | 1778 (100%) |
| share | 29% | 71% | |
[i] Pearson chi2(2) = 8.0921; Pr = 0.017.
Table 2
Binomial Logistic Regression of Stair Use on Model-Interventions.
| Variables | Stair Use (1) Escalator (0) | |
|---|---|---|
| Model A Stair-model vs control | Model B Escalator-model vs control | |
| Odds Ratio (p-Value) | Odds Ratio (p-Value) | |
| Intervention Type | ||
| baseline: no model | 1 | 1 |
| Stair-model | 0.165 | |
| (0.209) | ||
| Escalator-model | –0.117 | |
| (0.394) | ||
| Traffic volume | 0.00776* | –0.00336 |
| (0.075) | (0.489) | |
| Model | –0.00812 | –0.0306 |
| (0.92) | (0.704) | |
| Constant | –1.269*** | –0.681** |
| (0.000) | (0.013) | |
| Observations | 1,127 | 1,196 |
[i] *** p < 0.01, ** p < 0.05, * p < 0.1.