
Table 1
Table of demographic information of participants.
| Height (cm) | Weight (kg) | History (years) | Age (years) | Leg length (cm) | Foot length (mm) | Foot width (mm) |
|---|---|---|---|---|---|---|
| 175.17 ± 4.99 | 66.96 ± 4.44 | 9.58 ± 1.24 | 23 ± 1.65 | 90.79 ± 1.86 | 267.78 ± 5.04 | 102.07 ± 5.07 |
[i] Note: The right leg of all participants was measured.

Figure 1
The difference of COP area between CI and CON at each moment.
Table 2
Table of COP area of two intervention at each moment.
| COP area (mm2) | ①CI | ②CON | P-value | Δ (①–②) | ||
|---|---|---|---|---|---|---|
| Mean ± SD | 95% CI | Mean ± SD | 95% CI | |||
| Post warm up | 380.43 ± 179.10 | [230.694–530.161] | 401.68 ± 148.06 | [277.897–525.455] | 0.912 | –5.788 |
| Post fatigue | 741.44 ± 409.30 | [399.259–1083.623] | 635.56 ± 287.52 | [395.189–875.936] | ||
| post intervention | 660.15 ± 169.63 | [518.337–801.968] | 431.70 ± 294.44 | [185.542–677.863] | ||
| 24 h Post intervention | 618.55 ± 501.74 | [199.086–1038.02] | 518.14 ± 366.19 | [211.998–824.286] | ||
| 48 h Post intervention | 523.66 ± 257.03 | [308.779–738.546] | 872.63 ± 516.23 | [441.049–1304.21] | ||
| 72 h Post intervention | 415.71 ± 187.73 | [258.771–572.658] | 514.96 ± 445.14 | [142.819–887.111] | ||
| RM ANOVA | Whether the spherical hypothesis is satisfied? Yes (P = 0.509) | F (5, 35) = 1.557 | The interaction was not significant (P = 0.237) | |||

Figure 2
The difference of COP maximum displacement in ML between CI and CON at each moment. Note: “a” indicates that there is a significant difference between the moment of post warm up and other moments (post fatigue, post intervention, 24 h post intervention, 48 h post intervention and 72 h post intervention). “*” indicates that there was a significant difference between the CI and the CON.
Table 3
The COP maximum displacement of the two intervention at each moment in ML.
| Maximum displacement (%) | ①CI | ②CON | P-value | Δ (①–②) | ||
|---|---|---|---|---|---|---|
| Mean ± SD | 95% CI | Mean ± SD | 95%CI | |||
| Post warm up | 31.88 ± 5.38 | [27.374–36.376] | 33.75 ± 3.01 | [31.232–36.268] | 0.243 | –1.875 |
| Post fatigue | 42.87 ± 7.15 | [36.898–48.849] | 42.90 ± 8.16 | [36.075–49.723] | 0.991 | –0.025 |
| post intervention | 41.94 ± 6.58a | [36.439–47.446] | 40.76 ± 4.98 | [36.596–44.922] | 0.653 | 1.184 |
| 24 h post intervention | 38.78 ± 8.57 | [31.615–45.936] | 39.33 ± 8.17 | [32.506–46.160] | 0.853 | –0.557 |
| 48 h post intervention | 37.11 ± 6.84 | [31.396–42.825] | 40.01 ± 6.71 | [34.401–45.618] | 0.106 | –2.899 |
| 72 h post intervention | 36.01 ± 8.88* | [28.585–43.439] | 39.39 ± 8.85 | [31.993–46.784] | 0.005 | –3.376* |
| RM ANOVA | Whether the spherical hypothesis is satisfied? Yes (P = 0.313) | F (5,35) = 7.485 | The interaction was significant (P < 0.001) | |||
[i] Note: “a” indicates that there is a significant difference between the moment of post warm up and other moments (post fatigue, post intervention, 24 h post intervention, 48 h post intervention and 72 h post intervention). “*” indicates that there was a significant difference between the CI and the CON.
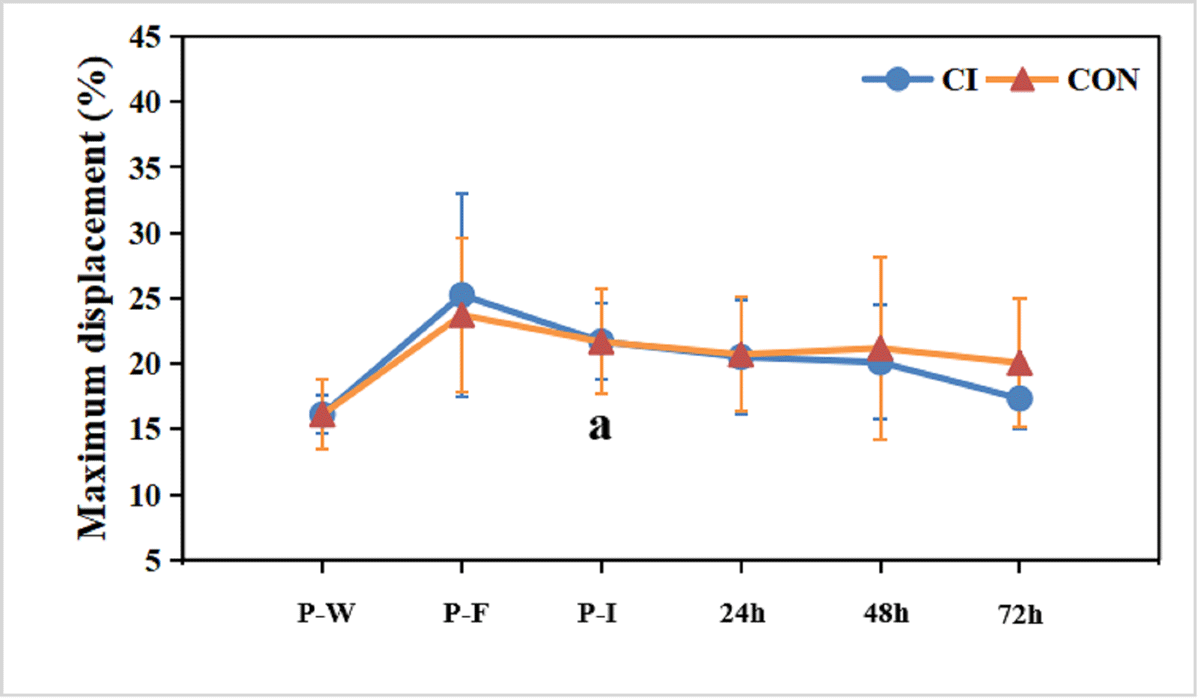
Figure 3
The difference of COP maximum displacement in AP between CI and CON at each moment. Note: “a” indicates that there is a significant difference between the moment of post warm up and other moments (post fatigue, post intervention, 24 h post intervention, 48 h post intervention and 72 h post intervention).
Table 4
The COP maximum displacement of the two intervention at each moment in AP.
| maximum displacement (%) | ①CI | ②CON | P-value | Δ (①–②) | ||
|---|---|---|---|---|---|---|
| Mean ± SD | 95% CI | Mean ± SD | 95% CI | |||
| Post warm up | 16.13 ± 1.46 | [14.906–17.344] | 16.13 ± 2.64 | [13.916–18.334] | 1 | 0 |
| Post fatigue | 25.25 ± 7.74 | [18.780–31.717] | 23.72 ± 5.92 | [18.770–28.673] | 0.457 | 1.527 |
| Post intervention | 21.70 ± 2.91a | [19.269–24.128] | 21.68 ± 4.02 | [18.315–25.037] | 0.988 | 0.022 |
| 24 h post intervention | 20.51 ± 4.39 | [16.838–24.178] | 20.72 ± 4.34 | [17.088–24.349] | 0.903 | –0.211 |
| 48 h post intervention | 20.10 ± 4.36 | [16.456–23.753] | 21.18 ± 7.00 | [15.324–27.036] | 0.752 | –1.076 |
| 72 h post intervention | 17.34 ± 2.32 | [15.395–19.280] | 20.06 ± 4.87 | [15.995–24.134] | 0.211 | –2.728 |
| RM ANOVA | Whether the spherical hypothesis is satisfied? Yes (P = 0.053) | F (5, 35) = 4.110 | The interaction was significant (P = 0.005) | |||
[i] Note: “a” indicates that there is a significant difference between the moment of post warm up and other moments (post fatigue, post intervention, 24 h post intervention, 48 h post intervention and 72 h post intervention).

Figure 4
The difference of COP displacement velocity in ML between CI and CON at each moment.
Table 5
The COP displacement velocity of the two intervention at each moment in ML.
| displacement velocity (mm/s) | ①CI | ②CON | P-value | Δ(①–②) | ||
|---|---|---|---|---|---|---|
| Mean ± SD | 95% CI | Mean ± SD | 95% CI | |||
| Post warm up | 579.72 ± 65.48 | [524.979–634.468] | 593.50 ± 71.92 | [533.378–653.630] | 0.86 | –1.098 |
| Post fatigue | 772.05 ± 127.01 | [665.861–878.229] | 772.95± 116.02 | [675.954–869.937] | ||
| post intervention | 774.56 ± 127.33 | [668.112–881.007] | 793.34 ± 125.11 | [688.740–897.934] | ||
| 24 h Post intervention | 785.67 ± 218.65 | [602.879–968.470] | 773.72 ± 203.16 | [603.875–943.560] | ||
| 48 h Post intervention | 791.77 ± 298.87 | [541.907–1041.626] | 791.48 ± 322.49 | [521.874–1061.094] | ||
| 72 hPost intervention | 724.57 ± 117.08 | [626.687–822.454] | 709.94 ± 128.52 | [602.491–817.389] | ||
| RM ANOVA | Whether the spherical hypothesis is satisfied? Yes (P = 0.067) | F (5, 35) = 0.968 | The interaction was no significant (P = 0.45) | |||

Figure 5
The difference of COP displacement velocity in AP between CI and CON at each moment.
Table 6
The COP displacement velocity of the two intervention at each moment in AP.
| displacement velocity (mm/s) | CI | ②CON | P-value | Δ(①–②) | ||
|---|---|---|---|---|---|---|
| Mean ± SD | 95% CI | Mean ± SD | 95% CI | |||
| Post warm up | 633.411 ± 27.647 | [568.037–698.784] | 625.903 ± 34.089 | [545.296–706.510] | 0.618 | 1.395 |
| Post fatigue | 809.653 ± 46.837 | [698.901–920.406] | 815.240 ± 43.338 | [712.763–917.717] | ||
| post intervention | 821.016 ± 45.384 | [713.700–928.332] | 814.846 ± 45.505 | [707.243–922.449] | ||
| 24 h Post intervention | 825.317 ± 80.098 | [635.916–1014.718] | 844.387 ± 87.485 | [637.519–1051.255] | ||
| 48 h Post intervention | 819.955 ± 94.528 | [596.432–1043.477] | 812.482 ± 91.238 | [596.739–1028.225] | ||
| 72 h Post intervention | 762.436 ± 52.411 | [638.505–886.367] | 750.560 ± 48.440 | [636.019–865.101] | ||
| RM ANOVA | Whether the spherical hypothesis is satisfied? Yes (P = 0.704) | F (5, 35) =1.326 | The interaction was no significant (P = 0.276) | |||

Figure 6
The difference of dynamic balance between CI and CON at each moment. Note: “a” indicates that there is a significant difference between the moment of post warm up and other moments (post fatigue, post intervention, 24 h post intervention, 48 h post intervention and 72 h post intervention). “b” indicates that there is a significant difference between the moment of post fatigue and other moments (post intervention, 24 h post intervention, 48 h post intervention and 72 h post intervention). “c” indicates that there is a significant difference between the moment of post intervention and other moment (24 h post intervention, 48 h post intervention and 72 h post intervention). “d” indicates that there is a significant difference between the moment of 24 h post intervention and other moment (48 h post intervention and 72 h post intervention). “e” indicates that there is a significant difference between the moment of 48 h post intervention and the moment of 72 h post intervention. “*” indicates that there was a significant difference between the CI and the CON.
Table 7
Table of dynamic balance of the two intervention at each moment.
| Dynamic balance (%) | ①CI | ②CON | P-value | Δ(①–②) | ||
|---|---|---|---|---|---|---|
| Mean ± SD | 95%CI | Mean ± SD | 95%CI | |||
| Post warm up | 98.83 ± 6.69 | [93.24–104.42] | 99.07 ± 7.38 | [92.90–105.24] | 0.643 | –0.239 |
| Post fatigue | 93.26 ± 6.34a | [87.96–98.56] | 92.76 ± 7.13a | [86.80–98.73] | 0.232 | 0.499 |
| post intervention | 90.17 ± 6.87ab | [84.43–95.92] | 92.22 ± 6.61a | [86.69–97.75] | 0.145 | –2.046 |
| 24 h Post intervention | 93.62 ± 6.92a* | [87.83–99.41] | 88.57 ± 6.90a | [82.81–94.34] | 0.004 | 5.049* |
| 48 h Post intervention | 95.77 ± 6.94acd* | [89.97–101.57] | 91.65 ± 6.55ad | [86.17–97.13] | 0.002 | 4.113* |
| 72 h Post intervention | 97.46 ± 6.69abcde* | [91.87–103.05] | 93.61 ± 6.84ade | [87.89–99.33] | 0.001 | 3.857* |
| RM ANOVA | Whether the spherical hypothesis is satisfied? Yes (P = 0.198) | F (5, 35) =15.004 | The interaction was significant (P = 0) | |||
[i] Note: “a” indicates that there is a significant difference between the moment of post warm up and other moments (post fatigue, post intervention, 24 h post intervention, 48 h post intervention and 72 h post intervention). “b” indicates that there is a significant difference between the moment of post fatigue and other moments (post intervention, 24 h post intervention, 48 h post intervention and 72 h post intervention). “c” indicates that there is a significant difference between the moment of post intervention and other moment (24 h post intervention, 48 h post intervention and 72 h post intervention). “d” indicates that there is a significant difference between the moment of 24 h post intervention and other moment (48 h post intervention and 72 h post intervention). “e” indicates that there is a significant difference between the moment of 48 h post intervention and the moment of 72 h post intervention. “*” indicates that there was a significant difference between the CI and the CON.