
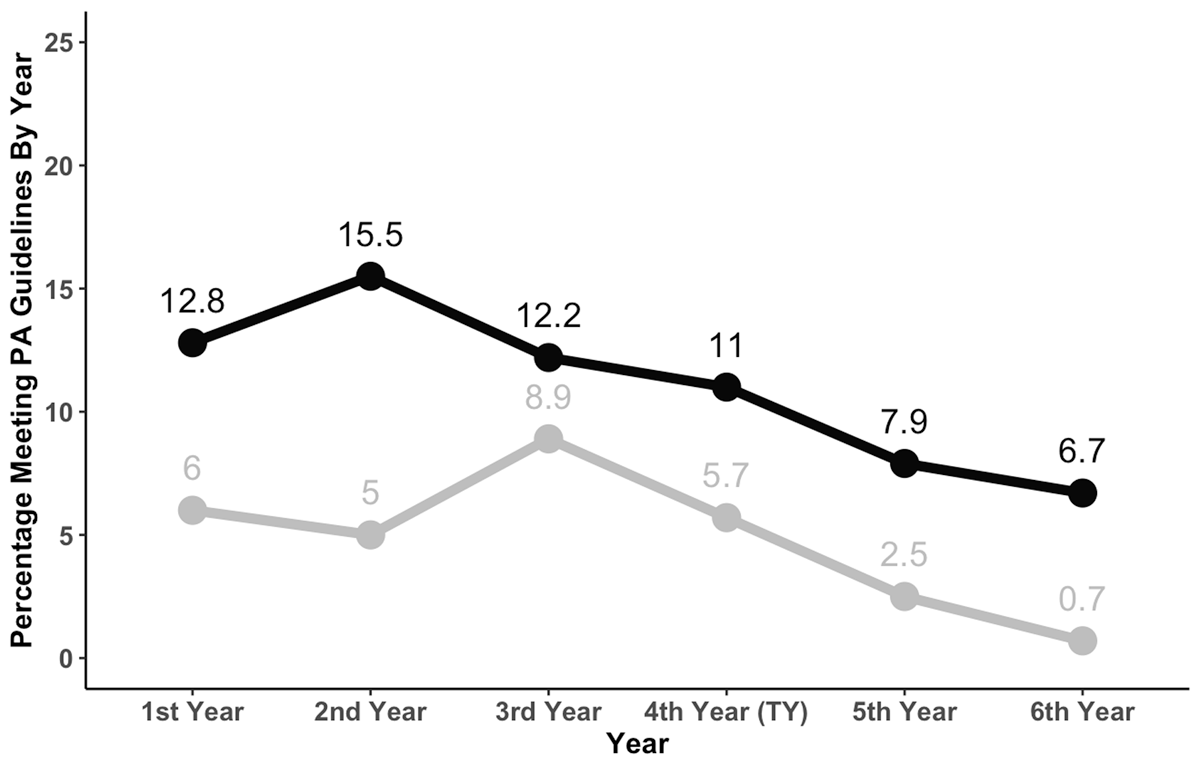
Figure 1
Percentage of students meeting PA guidelines by year and gender.
Table 1
Participants by year and gender.
| Year | Male | Female | Other | Total |
|---|---|---|---|---|
| 1st Year | 335 | 401 | 10 | 746 |
| 2nd Year | 278 | 397 | 6 | 681 |
| 3rd Year | 139 | 224 | 3 | 366 |
| 4th Year | 219 | 262 | 3 | 484 |
| 5th Year | 265 | 238 | 8 | 511 |
| 6th Year | 90 | 138 | 5 | 233 |
| Total | 1326 | 1660 | 35 | 3021 |
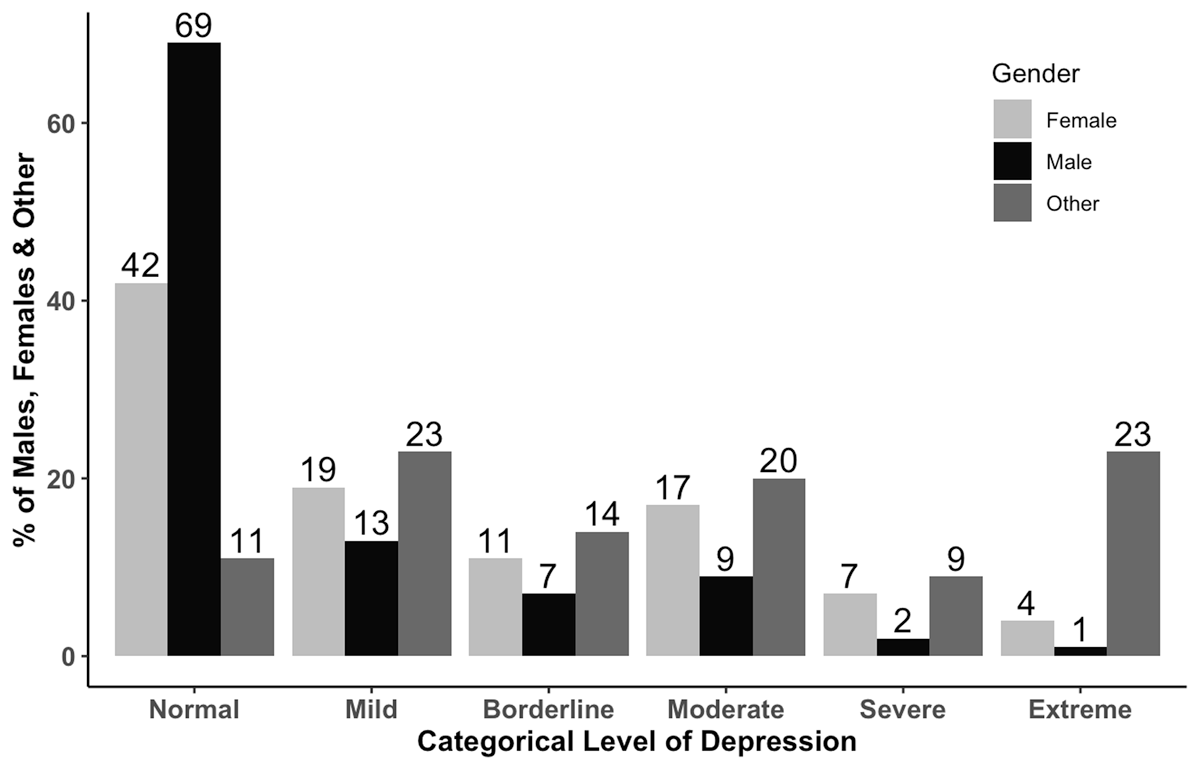
Figure 2
Participants by category of depression and gender.
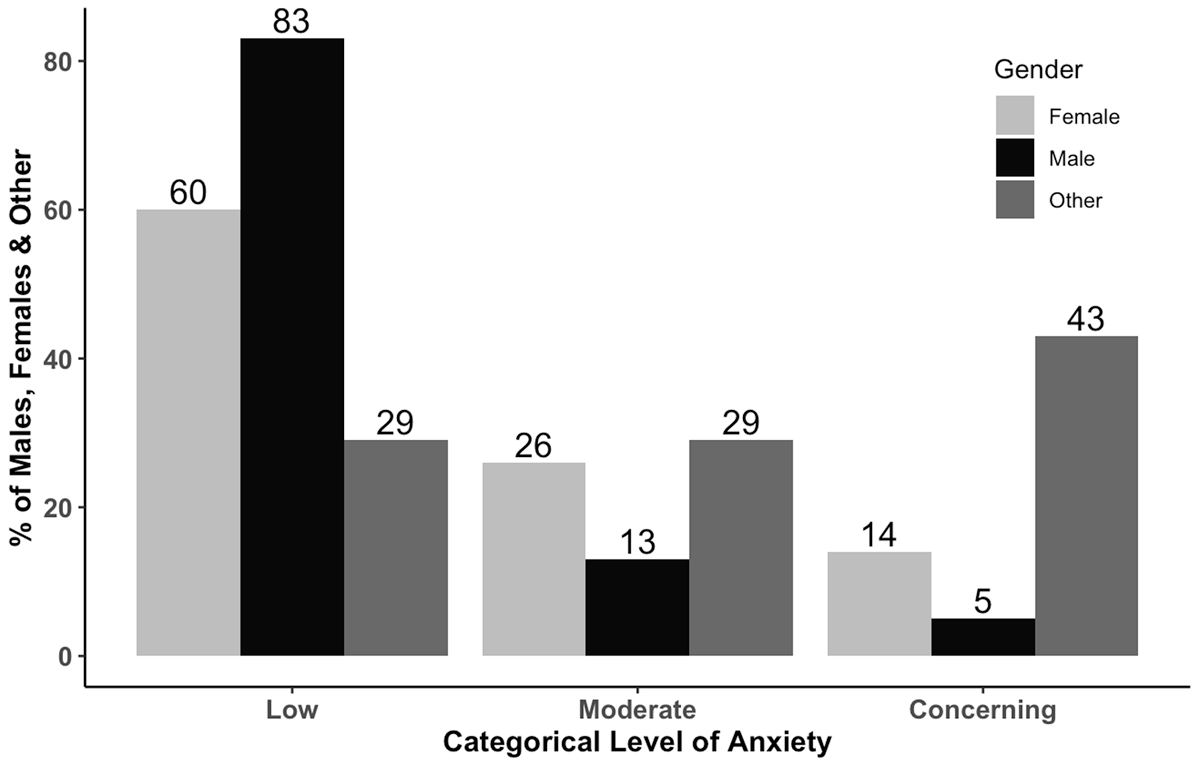
Figure 3
Participants by category of anxiety and gender.
Table 2
Frequency of physical activity among males and females by year.
| Year | Least Active (0–3 days) (% within sex) | Somewhat Active (4–7 days) (% within sex) | Most Active (8–14 days) (% within sex) | Sufficiently Active (% within sex) | ||||
|---|---|---|---|---|---|---|---|---|
| Male | Female | Male | Female | Male | Female | Male | Female | |
| 1st Year | 14.4% | 15.4% | 31.4% | 36.9% | 54.2% | 47.7% | 12.8% | 6.0% |
| 2nd Year | 14.2% | 12.4% | 29.1% | 43.7% | 56.7% | 43.9% | 15.5% | 5.0% |
| 3rd Year | 8.2% | 21.8% | 32.1% | 35.9% | 59.7% | 42.3% | 12.2% | 8.9% |
| 4th Year | 9.3% | 12.7% | 36.1% | 38.6% | 54.6% | 48.6% | 11.0% | 5.7% |
| 5th Year | 15.1% | 22.8% | 36.1% | 48.7% | 48.8% | 28.6% | 7.9% | 2.5% |
| 6th Year | 15.9% | 34.4% | 26.1% | 44.5% | 58.0% | 21.1% | 6.7% | 0.7% |
| Mean | 13.1% | 17.7% | 32.3% | 40.9% | 54.6% | 41.4% | 11.6% | 5.2% |
Table 3
Mental health outcomes by year and gender.
| Year | Depression Mean (SD) | Anxiety Mean (SD) | Wellbeing Mean (SD) | ||||||
|---|---|---|---|---|---|---|---|---|---|
| Male | Female | Other | Male | Female | Other | Male | Female | Other | |
| 1st | 7.4(3.9) | 12.2(5.4) | 35.4(9.6) | 11.1(4.7) | 16.2(5.9) | 40.6(6.5) | 50.7(8.3) | 47.6(9.1) | 28.7(7.1) |
| 2nd | 9.6(5.5) | 15.2(6.0) | 25.5(7.8) | 12.6(6.8) | 20.3(6.7) | 26.5(7.3) | 48.2(9.9) | 44.5(9.2) | 36.5(9.3) |
| 3rd | 8.6(4.8) | 17.0(6.1) | 25.3(6.7) | 11.6(4.9) | 20.0(6.6) | 36.7(3.8) | 49.0(9.1) | 44.0(9.9) | 39.0(6.2) |
| 4th | 7.9(3.8) | 15.2(5.7) | 13.7(1.2) | 10.5(5.1) | 20.3(6.2) | 9.7(3.2) | 50.0(8.3) | 45.6(8.7) | 58.0(13.9) |
| 5th | 8.7(4.3) | 15.6(5.8) | 20.4(5.3) | 10.4(5.4) | 21.7(7.0) | 32.4(6.5) | 48.5(9.0) | 44.4(8.4) | 41.2(9.6) |
| 6th | 9.7(5.0) | 17.8(5.9) | 22.4(5.4) | 14.4(6.3) | 21.6(6.9) | 24.2(6.9) | 46.2(8.3) | 40.3(8.8) | 38.2(8.4) |
| Mean | 8.5(4.5) | 15.0(5.8) | 25.7(7.6) | 11.4(5.5) | 19.6(6.6) | 31.0(7.4) | 49.1(8.9) | 45.0(9.3) | 37.7(11.4) |
Table 4
Physical activity sub-groups and associations with wellbeing, depression and anxiety by gender.
| Percentage of | Wellbeing Mean (SD) | Depression Mean (SD) | Anxiety Mean (SD) | |||||
|---|---|---|---|---|---|---|---|---|
| Physical Activity Subgroup | Male | Female | Male | Female | Male | Female | Male | Female |
| Least Active (0–3 days) | 13.1% | 17.7% | 45.7(9.4) | 41.9(9.8) | 12.3(10.6) | 17.8(12.7) | 15.4(11.1) | 21.4(14.2) |
| Somewhat Active (4–7 days) | 32.3% | 40.9% | 48.8(8.5) | 45.2(8.9) | 8.8(9.1) | 14.4(11.2) | 11.8(11.0) | 19.3(13.1) |
| Most Active (8–14 days) | 54.6% | 41.4% | 50.5(8.1) | 47.6(9.2) | 7.1(9.7) | 14.0(10.3) | 10.3(10.1) | 18.8(12.5) |
| Number of Sports Played | Male | Female | Male | Female | Male | Female | Male | Female |
| 0 | 15% | 25% | 44.4(9.6) | 42.7(9.8) | 12.4(11.1) | 17.5(12.6) | 13.6(12.6) | 22.0(14.0) |
| 1 | 29% | 36% | 48.7(8.9) | 44.8(9.0) | 7.9(10.3) | 15.1(11.3) | 11.5(10.5) | 20.1(13.5) |
| 2 | 33% | 30% | 50.0(7.5) | 46.3(8.8) | 8.7(8.5) | 13.5(10.2) | 11.6(10.9) | 17.5(12.4) |
| 3+ | 23% | 10% | 51.5(8.6) | 47.0(8.5) | 6.5(8.8) | 13.1(10.3) | 9.7(10.3) | 18.1(12.1) |
| Team Sport | Male | Female | Male | Female | Male | Female | Male | Female |
| Yes | 76% | 60% | 50.2(8.1) | 45.9(8.5) | 7.6(8.5) | 14.1(10.5) | 10.8(10.2) | 18.3(12.4) |
| No | 24% | 40% | 45.6(9.5) | 43.6(9.7) | 11.4(11.3) | 16.4(12.4) | 13.4(12.4) | 21.6(13.8) |
| Changes In PA Levels | Male | Female | Male | Female | Male | Female | Male | Female |
| Unsure | 2.7% | 3.9% | 44.2(13.6) | 42.0(9.0) | 11.2(5.4) | 16.8(5.8) | 11.7(5.8) | 22.2(6.1) |
| Less Active | 43.8% | 39.7% | 48.1(8.9) | 43.4(9.2) | 9.1(4.5) | 16.6(5.9) | 12.2(5.5) | 20.2(6.6) |
| More Active | 33.4% | 38.6% | 50.5(8.1) | 46.1(9.2) | 8.0(4.6) | 14.4(5.8) | 10.4(5.3) | 19.7(6.4) |
| About The Same | 19.9% | 17.7% | 50.0(8.9) | 46.9(8.8) | 7.5(4.3) | 12.1(5.3) | 11.3(6.0) | 17.4(6.8) |