
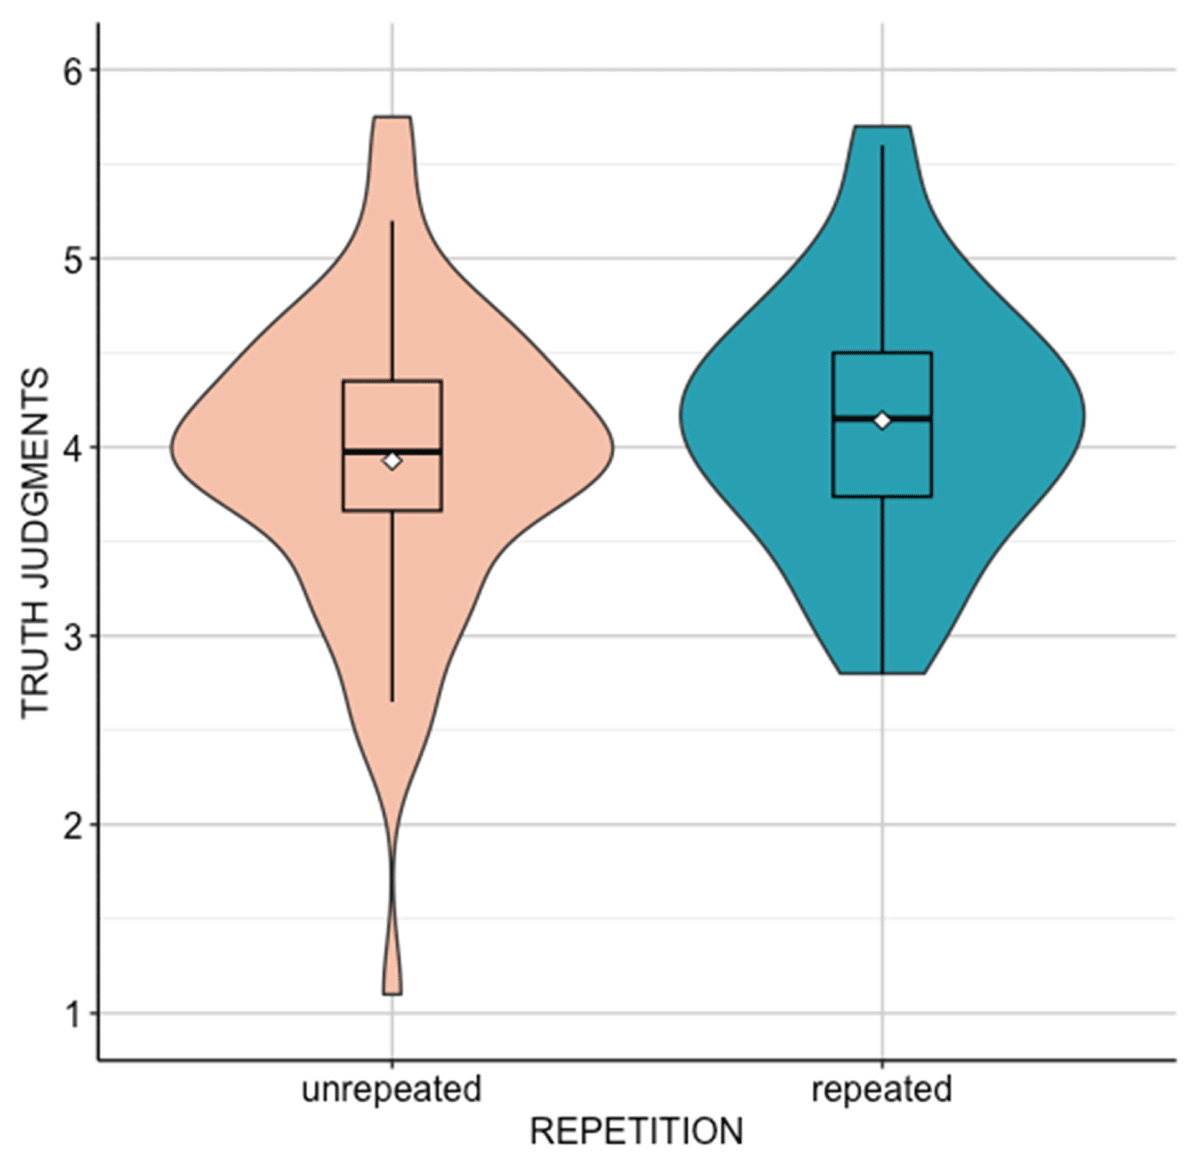
Figure 1
TViolin plot - Experiment 1. The boxes are the interquartile range; the bars represent the median; the white dots represent the mean.
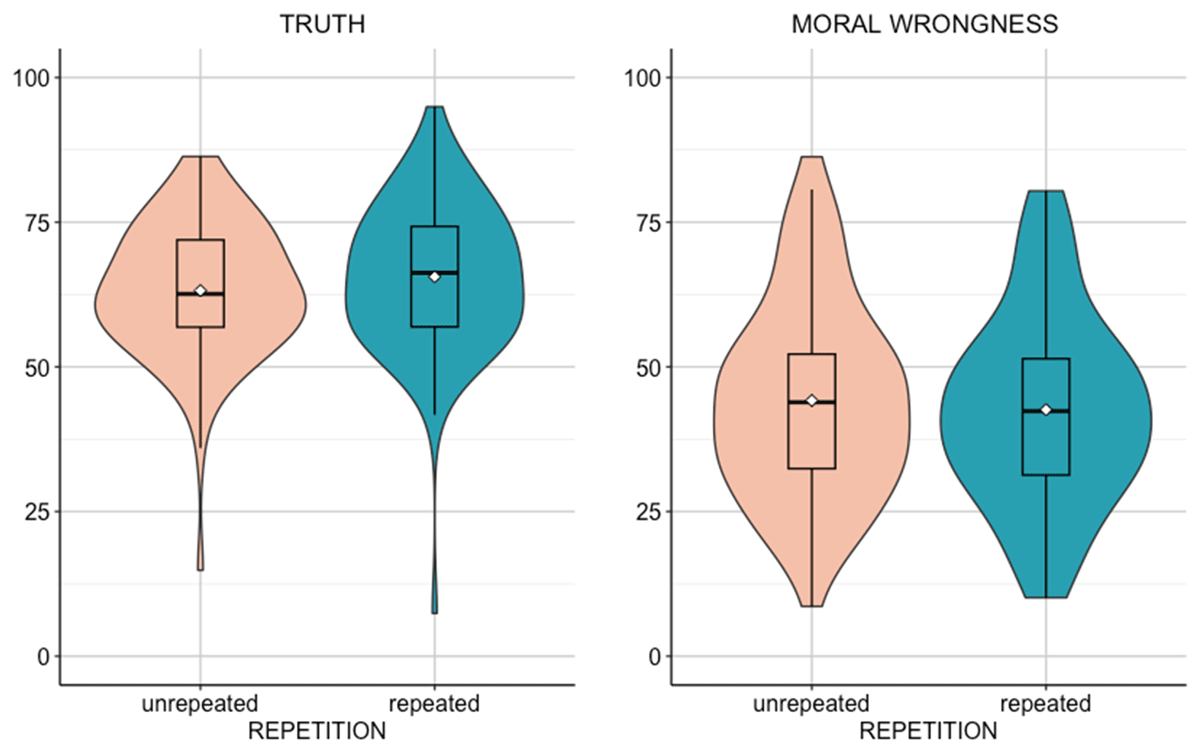
Figure 2
Violin plots - Experiment 2. The boxes are the interquartile range; the bars represent the median; the white dots represent the mean.