
Table 1
Descriptive and Inferential Statistics as a Function of Reflection Condition with Omnibus and Post-Hoc Tests (Study 1).
| REFLECTION CONDITION | CONTRAST 1 CR vs IR | CONTRAST 2 CR vs NR | CONTRAST 3 IR vs NR | ||||||||
|---|---|---|---|---|---|---|---|---|---|---|---|
| VARIABLE | CO-REFLECTION (N = 102) M (SD) | INDIVIDUAL REFLECTION (N = 103) M (SD) | NO REFLECTION (N = 103) M (SD) | F(2, 305) | η2 | T | D | T | D | T | D |
| 1. Avoidance | 3.18 (1.15) | 3.38 (1.13) | 4.70 (1.07) | 56.0*** | 0.27 | –1.22 | 0.17 | –9.76*** | 1.36 | –8.61*** | 1.18 |
| 2. Minimisation | 3.18 (1.17) | 3.37 (1.13) | 4.20 (1.15) | 22.6*** | 0.13 | –1.17 | 0.16 | –6.32*** | 0.88 | –5.16*** | 0.72 |
| 3. Genuine Forgiveness | 5.59 (0.75) | 5.38 (0.75) | 5.00 (1.06) | 12.3*** | 0.08 | 2.02 | 0.24 | 4.62*** | 0.68 | 2.97** | 0.44 |
| 4. Unforgiveness | 2.57 (0.86) | 3.11 (0.95) | 3.25 (1.10) | 13.7*** | 0.08 | –4.25*** | 0.55 | –4.90*** | 0.69 | –0.98 | 0.14 |
| 5. Processing | 5.85 (0.73) | 5.93 (0.68) | 5.13 (1.27) | 22.9*** | 0.13 | –0.87 | 0.09 | 4.95*** | 0.77 | 5.65*** | 0.86 |
| 6. Meta-Perceived VC | 5.38 (0.93) | 5.15 (0.97) | 4.80 (1.13) | 8.45*** | 0.05 | 1.73 | 0.23 | 4.00*** | 0.57 | 2.37* | 0.34 |
| 7. Whole Story | 5.61 (0.86) | 5.22 (1.10) | 4.63 (1.33) | 20.3*** | 0.12 | 2.87* | 0.35 | 6.29*** | 0.88 | 3.46** | 0.53 |
[i] Note. *p < .05, **p < .01, ***p < .001. CR = Co-Reflection, IR = Individual Reflection, NR = No Reflection, VC = Value Consensus.
Table 2
Bivariate Correlations for Main Variables (Study 1).
| VARIABLE | 1 | 2 | 3 | 4 | 5 | 6 | 7 |
|---|---|---|---|---|---|---|---|
| 1. Avoidance | – | .64*** | –.20*** | .29*** | –.38*** | –.17** | –.37*** |
| 2. Minimisation | – | –.33*** | .49*** | –.32*** | –.32*** | –.40*** | |
| 3. Genuine Forgiveness | – | –67*** | .42*** | .65*** | .51*** | ||
| 4. Unforgiveness | – | –.31*** | –.56*** | –.50*** | |||
| 5. Processing | – | .43*** | .57*** | ||||
| 6. Meta-Perceived VC | – | .59*** | |||||
| 7. Whole Story | – |
[i] Note. *p < .05, **p < .01, ***p < .001.
Table 3
Unstandardised Coefficients for Predictors on Mediators, and Coefficients for the Predictors and Mediators on Outcome Variable.
| DEPENDENT VARIABLE | B | SE | T | CI95% | DEPENDENT VARIABLE | B | SE | T | CI95% |
|---|---|---|---|---|---|---|---|---|---|
| Processing | R2 = .13, F(2,305) = 22.9, p < .001 | Meta-Perceived VC | R2 = .05, F(2,305) = 8.45, p < .001 | ||||||
| Co-Reflection | .72 | .13 | 5.50 | [0.46, 0.97] | Co-Reflection | .58 | .14 | 4.08 | [0.30, 0.85] |
| Individual Reflection | .80 | .13 | 6.17 | [0.55, 1.06] | Individual Reflection | .35 | .14 | 2.47 | [0.07, 0.62] |
| Model 1: Avoidance | R2 = .31, F(4,303) = 34.5, p < .001 | Model 2: Minimisation | R2 = .20, F(4,303) = 19.2, p < .001 | ||||||
| Co-Reflection | –1.32 | .16 | –8.21 | [–1.63, –1.00] | Co-Reflection | –.76 | .16 | –4.65 | [–1.08, –0.44] |
| Individual Reflection | –1.09 | .16 | –6.77 | [–1.40, –0.77] | Individual Reflection | –.61 | .16 | –3.71 | [–0.93, –0.29] |
| Processing | –.31 | .07 | –4.23 | [–0.45, –0.16] | Processing | –.18 | .07 | –2.38 | [–0.32, –0.03] |
| Meta-Perceived VC | .03 | .07 | 0.50 | [–0.10, 0.17] | Meta-Perceived VC | –.23 | .07 | –3.36 | [–0.36, –0.10] |
| Model 3: Genuine Forgiveness | R2 = .45, F(4,303) = 63.2, p < .001 | Model 4: Unforgiveness | R2 = .35, F(4,303) = 40.2, p < .001 | ||||||
| Co-Reflection | .22 | .09 | 2.18 | [0.02, 0.41] | Co-Reflection | –.34 | .12 | –2.77 | [–0.58, –0.10] |
| Individual Reflection | .10 | .10 | 1.06 | [–0.09, 0.30] | Individual Reflection | .10 | .12 | 0.79 | [–0.14, 0.34] |
| Processing | .13 | .05 | 2.96 | [0.04, 0.22] | Processing | –.09 | .06 | –1.58 | [–0.20, 0.02] |
| Meta-Perceived VC | .49 | .04 | 11.9 | [0.41, 0.57] | Meta-Perceived VC | –.48 | .05 | –9.44 | [–0.58, –0.38] |
[i] Note. No-reflection is the reference condition. The bottom panel contains four models (separate analyses).
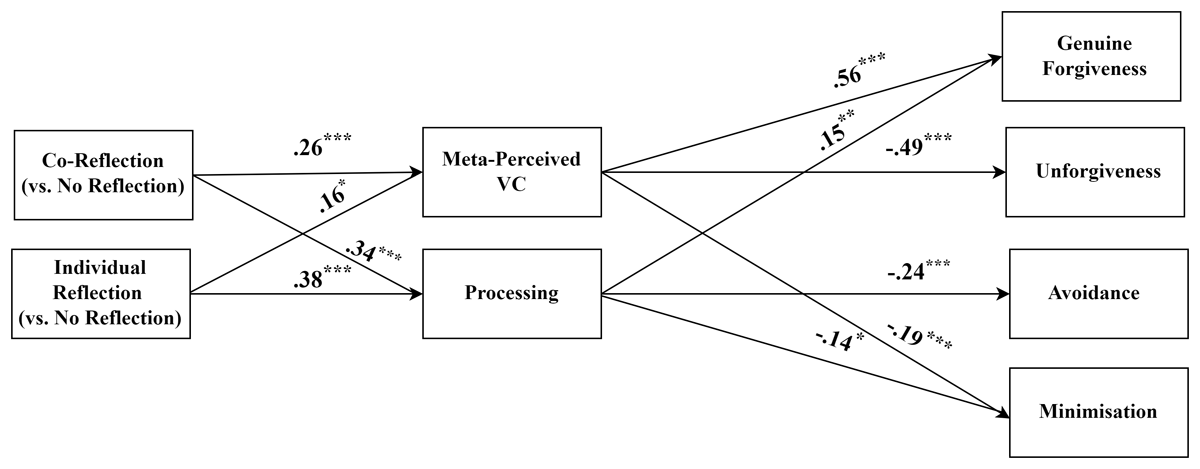
Figure 1
Standardised coefficients for the Mediated Regression Analyses of the Effect of Co-Reflection (vs. no reflection) and Individual Reflection (vs. no reflection) on the Meanings of Forgiveness via the Key Mediators (Study 1).
Note. *p < .05, **p < .01, ***p < .001. These results are summarised from separate analyses.
Table 4
Bias-Corrected Bootstrap Estimates for Indirect Effects (Study 1).
| DEPENDENT VARIABLE | IE | SE | CI95% | DEPENDENT VARIABLE | IE | SE | CI95% |
|---|---|---|---|---|---|---|---|
| Avoidance | Minimisation | ||||||
| CR → Processing | –.22 | .07 | [–0.37, –0.10] | CR → Processing | –.13 | .07 | [–0.27, –0.01] |
| IR → Processing | –.25 | .08 | [–0.41, –0.11] | IR → Processing | –.14 | .08 | [–0.30, –0.01] |
| Genuine Forgiveness | Unforgiveness | ||||||
| CR → Meta-Perceived VC | .28 | .08 | [0.14, 0.45] | CR → Meta-Perceived VC | –.28 | .08 | [–0.43, –0.14] |
[i] Note. CR = co-reflection, IR = individual reflection.
Table 5
Means, Standard Deviations, and Bivariate Correlations for Main Variables (Study 2).
| VARIABLE | M (SD) | 1 | 2 | 3 | 4 | 5 | 6 | 7 | 8 | 9 |
|---|---|---|---|---|---|---|---|---|---|---|
| 1. Co-Reflection | 4.64 (1.72) | – | .14 | .25*** | .20** | .78*** | –.54*** | .41*** | .77*** | .70*** |
| 2. Individual Reflection | 5.86 (0.96) | – | –.10 | –.10 | .14 | –.06 | .58*** | .11 | .31*** | |
| 3. Avoidance | 3.58 (1.51) | – | .75*** | .31*** | .08 | –.01 | .23** | .09 | ||
| 4. Minimisation | 3.15 (1.54) | – | .17* | .14 | –.07 | .11 | .07 | |||
| 5. Genuine Forgiveness | 4.75 (1.70) | – | –.63*** | .34*** | .80*** | .66*** | ||||
| 6. Unforgiveness | 3.51 (1.58) | – | –.08 | –.53*** | –.45*** | |||||
| 7. Processing | 5.28 (1.33) | – | .46*** | .47*** | ||||||
| 8. Meta-Perceived VC | 4.89 (1.65) | – | .64*** | |||||||
| 9. Whole Story | 4.83 (1.55) | – |
[i] Note. *p < .05, **p < .01, ***p < .001. VC = Value Consensus.
Table 6
Unstandardised Coefficients for Predictors on Mediators (Study 2).
| DEPENDENT VARIABLE | B | SE | T | CI95% |
|---|---|---|---|---|
| Processing | R2 = .44, F(2,176) = 69.3, p < .001 | |||
| Co-Reflection | .26 | .04 | 5.84 | [0.17, 0.34] |
| Individual Reflection | .73 | .08 | 9.29 | [0.58, 0.89] |
| Meta-Perceived Value-Consensus | R2 = .59, F(2,176) = 126.5, p < .001 | |||
| Co-Reflection | .74 | .05 | 15.7 | [0.65, 0.83] |
| Individual Reflection | .01 | .08 | 0.11 | [–0.16, 0.17] |
| Whole Story | R2 = .54, F(2,305) = 102.8, p < .001 | |||
| Co-Reflection | .61 | .05 | 13.0 | [0.51, 0.70] |
| Individual Reflection | .35 | .08 | 4.23 | [0.19, 0.52] |
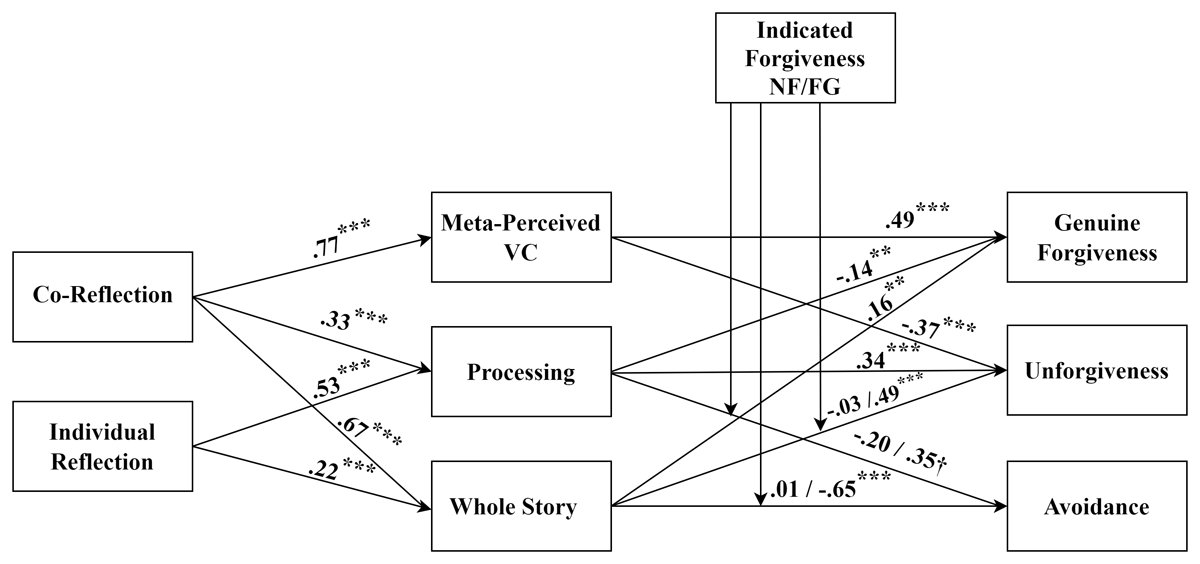
Figure 2
Standardised coefficients for the Mediated Regression Analyses of the Effect of Co-Reflection and Individual Reflection on the Meanings of Forgiveness via the Key Mediators with Moderation by Indicated Forgiveness (Study 2).
Note. †p = .05, *p < .05, **p < .01, ***p < .001. NF = no indicated forgiveness, FG = indicated forgiveness. These results are summarised from separate analyses.
Table 7
Unstandardised Coefficients of the Mediators and Moderator (Indicated Forgiveness) on Dependent Variables (Study 2).
| DEPENDENT VARIABLE | B | SE | T | CI95% | DEPENDENT VARIABLE | B | SE | T | CI95% |
|---|---|---|---|---|---|---|---|---|---|
| Model 1: Avoidance | R2 = .16, F(9, 169) = 3.61, p < .001 | Model 2: Minimisation | R2 = .10, F(9, 169) = 2.20, p < .001 | ||||||
| Co-Reflection | .26 | .13 | 2.03 | [0.01, 0.52] | Co-Reflection | .29 | .14 | 2.14 | [0.02, 0.56] |
| Individual Reflection | –.22 | .15 | –1.46 | [–0.51, 0.08] | Individual Reflection | –.10 | .16 | –0.65 | [–0.41, 0.21] |
| Processing | .09 | .13 | 0.69 | [–0.17, 0.35] | Processing | –.07 | .14 | –0.48 | [–0.34, 0.21] |
| Meta-Perceived VC | .15 | .12 | 1.29 | [–0.08, 0.38] | Meta-Perceived VC | –.06 | .12 | –0.52 | [–0.31, 0.18] |
| Whole Story | –.32 | .12 | –2.65 | [–0.56, –0.08] | Whole Story | –.17 | .13 | –1.34 | [–0.42, 0.08] |
| Indicated Forgiveness | –.07 | .33 | –0.21 | [–0.73, 0.58] | Indicated Forgiveness | .03 | .35 | 0.09 | [–0.66, 0.72] |
| Model 3: Genuine Forgiveness | R2 = .73, F(9,169) = 51.0, p < .001 | Model 4: Unforgiveness | R2 = .47, F(9,169) = 16.8, p < .001 | ||||||
| Co-Reflection | .28 | .08 | 3.45 | [0.12, 0.44] | Co-Reflection | –.09 | .11 | –0.83 | [–0.30, 0.12] |
| Individual Reflection | .12 | .09 | 1.21 | [–0.07, 0.30] | Individual Reflection | –.23 | .12 | –1.90 | [–0.48, 0.01] |
| Processing | –.20 | .08 | –2.35 | [–0.36, –0.03] | Processing | .46 | .11 | 4.24 | [0.25, 0.67] |
| Meta-Perceived VC | .51 | .07 | 6.81 | [0.36, 0.66] | Meta-Perceived VC | –.34 | .10 | –3.55 | [–0.53, –0.15] |
| Whole Story | .23 | .08 | 2.97 | [0.08, 0.38] | Whole Story | –.27 | .10 | –2.67 | [–0.46, –0.07] |
| Indicated Forgiveness | .23 | .21 | 1.10 | [–0.18, 0.65] | Indicated Forgiveness | –.81 | .27 | –2.97 | [–1.36, –0.27] |
[i] Note. VC = value consensus, interaction terms are omitted, indicated forgiveness coded: 1 = no indication, 2 = forgiveness indication.
Table 8
Bias-Corrected Bootstrap Estimates for Simple Mediation, Moderated Mediation, and Conditional IE by Indicated Forgiveness.
| DEPENDENT VARIABLE | SIMPLE MEDIATION | MODERATED MEDIATION | CONDITIONAL INDIRECT EFFECTS | |||||||||
|---|---|---|---|---|---|---|---|---|---|---|---|---|
| IE | SE | CI95% | Index | SE | CI95% | NF | SE | CI95% | FG | SE | CI95% | |
| Avoidance | ||||||||||||
| CR → Processing | –.02 | .04 | [–0.11, 0.06] | .16 | .07 | [0.04, 0.30] | –.06 | .04 | [–0.15, 0.02] | .10 | .06 | [–0.01, 0.22] |
| IR → Processing | –.07 | .11 | [–0.29, 0.16] | .46 | .17 | [0.12, 0.80] | –.17 | .13 | [–0.43, 0.06] | .29 | .15 | [–0.01, 0.58] |
| Minimisation | ||||||||||||
| CR → Processing | –.04 | .03 | [–0.09, 0.03] | .02 | .06 | [–0.11, 0.14] | –.03 | .03 | [–0.09, 0.04] | –.01 | .06 | [–0.13, 0.10] |
| IR → Processing | –.10 | .09 | [–0.29, 0.07] | .06 | .17 | [–0.28, 0.40] | –.08 | .10 | [–0.31, 0.09] | –.02 | .16 | [–0.35, 0.29] |
| Genuine Forgiveness | ||||||||||||
| CR → Meta-Perceived VC | .37 | .07 | [0.23, 0.50] | .03 | .13 | [–0.22, 0.31] | .36 | .09 | [0.16, 0.51] | .39 | .11 | [0.18, 0.59] |
| CR → Whole Story | .11 | .05 | [–0.01, 0.21] | .13 | .11 | [–0.10, 0.33] | .07 | .06 | [–0.05, 0.20] | .20 | .10 | [0.01, 0.36] |
| Unforgiveness | ||||||||||||
| CR → Meta-Perceived VC | –.26 | .08 | [–0.40, –0.10] | –.04 | .15 | [–0.38, 0.20] | –.24 | .08 | [–0.39, –0.06] | –.27 | .13 | [–0.58, –0.07] |
| CR → Whole Story | –.08 | .06 | [–0.19, 0.03] | –.28 | .12 | [–0.49, –0.02] | –.02 | .06 | [–0.14, 0.10] | –.30 | .10 | [–0.48, –0.06] |
[i] Note. IE = indirect effect, CR = co-reflection, IR = individual reflection, VC = value consensus, NF = no indicated forgiveness, FG = indicated forgiveness.
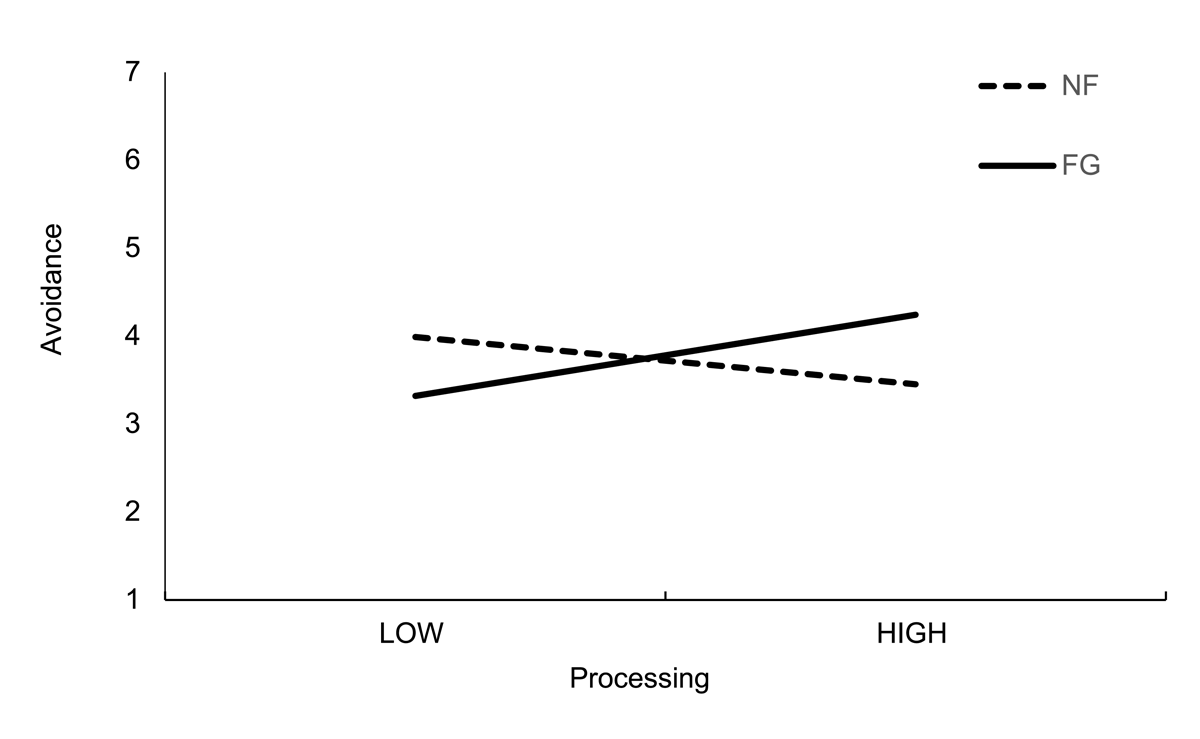
Figure 3
The relationship between processing and avoidance as a function of indicated forgiveness (Study 2). NF = no indicated forgiveness, FG = victim indicated forgiveness.