
Table 1
Manipulation Text Presented to Each Condition.
| ORIGINAL STUDY CONTROL | SYSTEM-PRESERVATION EXPERIMENTAL | TRUE CONTROL | |
|---|---|---|---|
| Salience of the system manipulation | WELL-BEING DEPENDS ON COUNTRY OF RESIDENCE Many people feel that the decision they make in terms of where to live is a very important one. In fact, recent surveys report that even at age 40, people still consider that their choice to live where they do was one of the most impactful decisions of their life. Indeed, sociological studies comparing the outcomes of residents of various countries show that there might be some truth to these perceptions. In particular, it seems that the country you live in has enormously broad effects on your life and well-being. In terms of financial well-being, for instance, the taxes you pay, the job and investment opportunities made available to you and the general state of the economy are all to a large extent under the control of your country’s government. But even in terms of social and personal well-being, the country you live in has substantial impacts: the quality of your social services (health and education), the leisure activities you have access to and time to pursue, even the likelihood that you will be happy with your eventual life-partner – all these aspects of your life are ones that are, at least according to these studies, to some degree dependent on the country you live in. | No text presented. | |
| Environmental message | Researchers have always been interested in the state of the natural environment and have paid attention to how it has changed over the years. Today, researchers are especially interested in the relationship between people and the environment. | ||
| Being pro-environmental allows us to protect and preserve the American way of life. It is patriotic to conserve the country’s natural resources | |||
Table 2
Summary of Results and Interpretation in Feygina et al. (2010, Study 3) and Our close replication Based on Only the Original Study Conditions (Original Study Control vs. System-Preservation Condition).
| FEYGINA ET AL. (2010, STUDY 3) | OUR CLOSE REPLICATION | |||
|---|---|---|---|---|
| Pro-environmental intentions | Interpretation | Results reported | Interpretation | Results |
| Main effect of system justification | ‘marginal’ … ‘in the expected direction’ | b = 0.46, SE = 0.26, β = .36, t(37) = 1.75, p = .09. | No | b = 0.05, SE = 0.09, β = .04, t(374) = 0.59, p = .553 |
| Main effect of condition | No | b = 0.20, SE = 0.52, β = .06, ns | No | b = –0.40, SE = 0.50, β = –.11, t(374) = –0.81, p = .421 |
| Interaction between system justification and condition | Yes | b = 0.95, SE = 0.41, β = .49, t(37) = 2.29, p = .03 | No | b = 0.05, SE = 0.12, β = .06, t(374) = 0.43, p = .670 |
| Follow-up test 1 – comparing high (M + 1SD) versus low (M – 1SD) system justifiers | ||||
| Difference between conditions for high system justifiers? | Yes; PEB intentions were more pro-environmental in the system-preservation condition than the control | b = 1.40, SE = 0.82, β = .44, t(37) = 1.72, p = .09 | N/A – follow up tests not performed given non-significant interaction | |
| Difference between conditions for low system justifiers? | No; PEB intentions were not reliably different across conditions. | b = –1.00, SE = 0.65, β = –.32, t(37) = –1.53, p > .10 | ||
| Follow-up test 2 – examining relationship between system justification and PEB intentions in each condition | ||||
| Control condition | ‘A negative (albeit marginal) relationship’ | b = –0.46, SE = 0.26, β = –.36, t(37) = 1.75, p < .09 | N/A – follow up tests not performed given non-significant interaction | |
| Experimental condition | ‘negative relationship was eliminated’ … ‘no reliable relationship’ | b = 0.49, SE = 0.32, β = .39, t(37) = 1.53, p = .14 | ||
| Petitions | Interpretation | Results reported | Interpretation | Results |
| Main effect of system justification | ‘marginal’, indicating system justification was inversely related to signing petitions | b = –0.64, SE = 0.38, Wald = 2.84, p = .09 | Yes | b = –.35, SE = 0.10, 95% CI [–0.54, –0.16], Odds ratio (OR) = 0.70, Wald = 13.08, p < .001 |
| Main effect of condition | No | b = 0.58, SE = 0.65, Wald = .82, ns | Yes | b = –1.36, SE = 0.54, 95% CI [–2.43, –0.31], OR = 0.26, Wald = 6.37, p = .012 |
| Interaction between system justification and condition | Yes | b = 1.26, SE = 0.57, Wald = 5.01, p = .03 | Yes | b = 0.37, SE = 0.13, 95% CI [0.12, 0.63], OR = 1.45, Wald = 8.20, p = .004 |
| Follow-up test 1 – comparing high (M + 1SD) versus low (M – 1SD) system justifiers | ||||
| Difference between conditions for high system justifiers? | No | None; inferred from statement ‘reframing environmentalism as supporting (rather than undermining) the American way or life eliminates the negative effect of system justification on pro-environmental behavior’. Graph shows cross-over interaction. | Yes. But note that robustness checks described in text indicate no significant difference at M + 1SD system justification; differences emerge at extremely high levels of system justification in exploratory analyses. | 49.33% of high system justifiers (M + 1SD) sign most petitions in the system-preservation condition versus 34.40% in the control condition. |
| Difference between conditions for low system justifiers? | Yes | Possible backfire? But note that robustness checks indicate no significant difference at M – 1SD, or any low level of system justification. | 60.59% of low system justifiers (M – 1SD) sign most petitions in the original study control condition versus 47.48% in the system-preservation condition. | |
| Follow-up test 2 – examining relationship between system justification and petitions signed in each condition | ||||
| Control condition | ‘marginal negative effect of system justification on the probability of signing petitions’ | None | Negative effect of system justification on the likelihood of signing petitions | b = –0.35, SE = 0.10, 95% Asymptotic CI [–0.54, –0.16], Wald = 13.08, p < .001 |
| Experimental condition | ‘no longer a reliable relationship’ | b = 0.63, SE = 0.41, Wald = 2.33, ns | No effect | b = 0.02, SE = 0.09, 95% Asymptotic CI [–0.15, 0.20], Wald = 0.08, p = .783 |
Table 3
Overview of Study Differences between Original Study and Our Close Replication.
| FEYGINA ET AL. (2010, STUDY 3) | OUR CLOSE REPLICATION | |
|---|---|---|
| Sample | 41 New York University undergraduate students (30 women, 11 men). No age or nationality information reported. | 567 adults living in, and identifying their nationality as, United States of America (276 women, 272 men). Ages ranged from 18 to 93 years (M = 37.06, SD = 13.92). |
| Setting | Computers in a controlled, in-person laboratory setting. | Online study; participants took part in their own environment. |
| Conditions | 1) Original control condition, 2) System-preservation experimental condition. | 1) Original control condition, 2) System-preservation experimental condition, 3) True control condition. |
| PEB intentions | Identical; pro-environmental behaviour intentions (10 items, 9-point response scale). Analysis used the mean score of 10 items as the dependent variable in a linear regression analysis. | |
| Petitions | Seven pro-environmental petitions presented after a false debrief, ostensibly unrelated to the study. Created a 3-point measure by recoding data into: no petitions signed (34.1% of participants), a few petitions signed (i.e., one to three petitions, 29.3%), most petitions signed (i.e., four to seven petitions, 36.6%), to use in an ordered logistic regression. | Seven pro-environmental petitions presented online and before the debrief, updated for relevance. Created a 3-point measure by recoding data into: no petitions signed (34.0% of participants), a few petitions signed (i.e., one to three petitions, 16.9%), most petitions signed (i.e., four to seven petitions, 49.0%), to use in an ordered logistic regression. In addition, analysed data using the count of how many petitions were signed, using a negative binomial regression. |
Table 4
Means (standard deviations) for Pro-Environmental Variables for Each Experimental Condition.
| PRO-ENVIRONMENTAL BEHAVIOUR INTENTIONS | TOTAL PETITIONS SIGNED | |
|---|---|---|
| System-preservation condition (n = 190) | 4.48 (1.93) | 3.17 (2.76) |
| Original study control condition (n = 188) | 4.67 (1.72) | 3.28 (2.95) |
| True control condition (n = 189) | 4.59 (1.87) | 3.31 (2.88) |
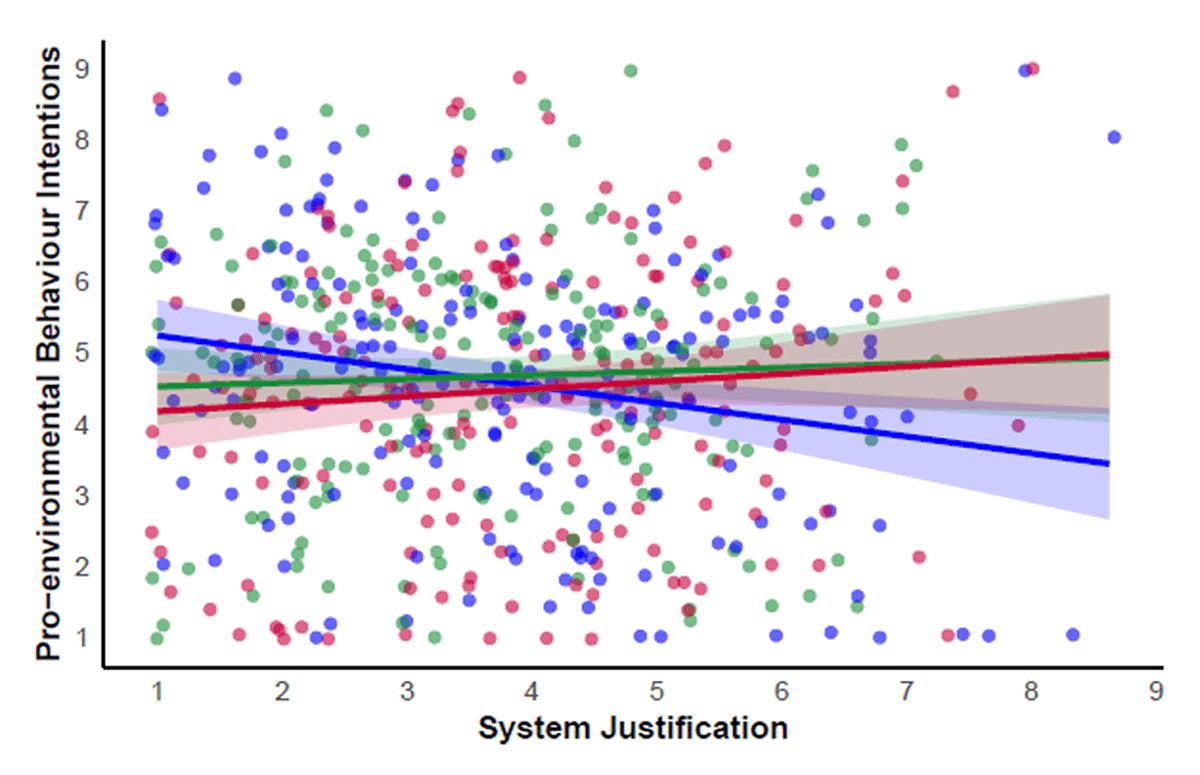
Figure 1
Associations between System Justification and Pro-environmental Behaviour Intentions in the System-Preservation Condition (Red), Original Study Control Condition (Green) and True Control Condition (Blue).
Note. Shaded areas represent 95% confidence intervals. Data points are jittered to avoid overlap.
Table 5
Percentages of Those Lower and Higher in System Justification Signing None, a Few, and Most Pro-Environmental Petitions in All Study Conditions.
| LOWER SYSTEM JUSTIFICATION | HIGHER SYSTEM JUSTIFICATION | |||
|---|---|---|---|---|
| M – 1.5SD | M – 1SD | M + 1SD | M + 1.5SD | |
| Original study control condition | ||||
| None | 18.80 | 23.36 | 47.79 | 54.65 |
| A few | 13.56 | 15.28 | 17.62 | 16.70 |
| Most | 67.65 | 61.36 | 34.58 | 28.65 |
| System-preservation condition | ||||
| None | 34.82 | 34.39 | 32.70 | 32.29 |
| A few | 17.65 | 17.60 | 17.40 | 17.34 |
| Most | 47.53 | 48.01 | 49.90 | 50.37 |
| True control condition | ||||
| None | 20.34 | 23.87 | 41.67 | 46.74 |
| A few | 14.20 | 15.45 | 17.94 | 17.71 |
| Most | 65.47 | 60.68 | 40.39 | 35.55 |
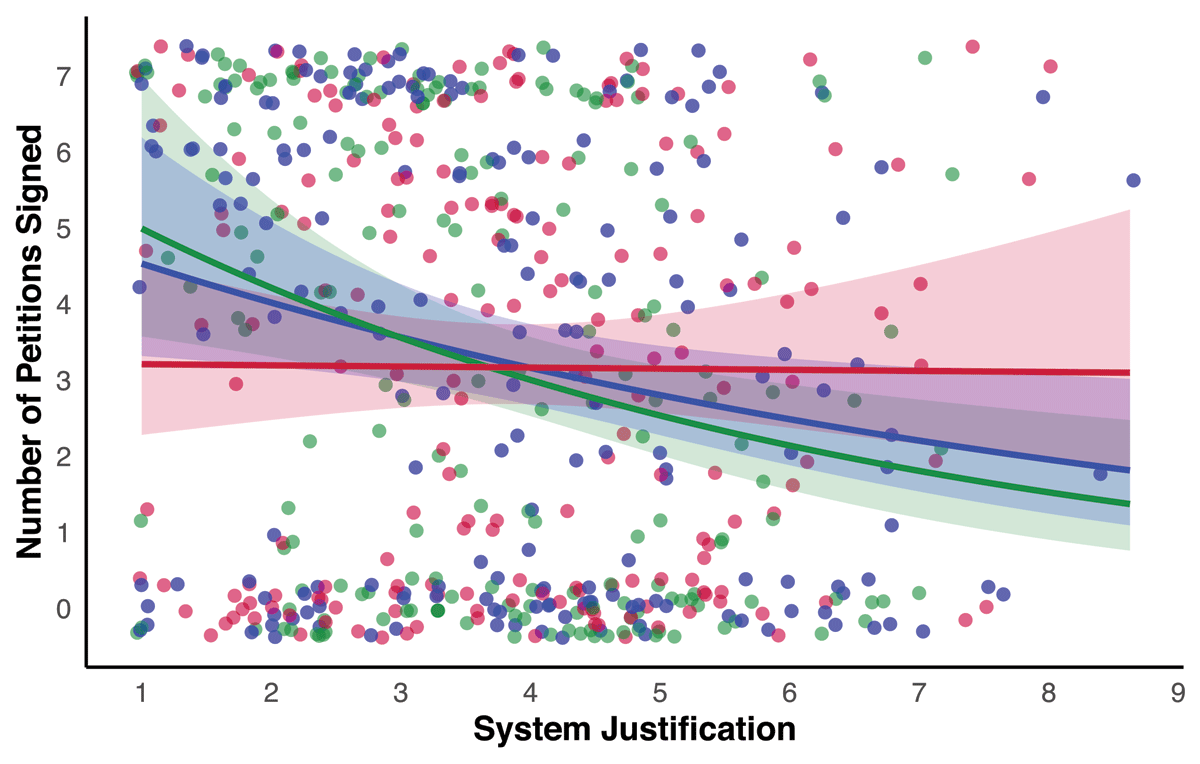
Figure 2
Associations between System Justification and the number of pro-environmental petitions signed in the System-Preservation Condition (Red), Original Study Control Condition (Green) and True Control Condition (Blue).
Note. Shaded areas represent 95% confidence intervals. Data points are jittered to avoid overlap.