
Table 1
Study inclusion and exclusion criteria.
| Population | Inclusion: hospitalized patients, >65 years old, multimorbidity, complex needs (including non-healthcare needs). |
| Intervention | Inclusion: Inter-organizational coordination (IOC). Exclusion: Interventions tailored for specific diseases and interventions where hospital and non-hospital actors were not both actively participating (e.g. hospital-based care coordinators limited to referring patients to non-hospital service providers). |
| Comparator | Inclusion: standard care. |
| Outcomes | Inclusion: Length of hospital stay (LoS) and/or hospital readmissions. |
| Context | At least two distinct service providers jointly responsible for in- and outpatient health- and non-health care. |
| Type of study | Inclusion: Randomized Controlled Trials (RCT), Non-Randomized Studies of Interventions (NRSI) Exclusion: Studies without control group, single center studies (Controlled Before After, Difference-in-Difference), less than three measurements before/after intervention (Interrupted Time Series). |
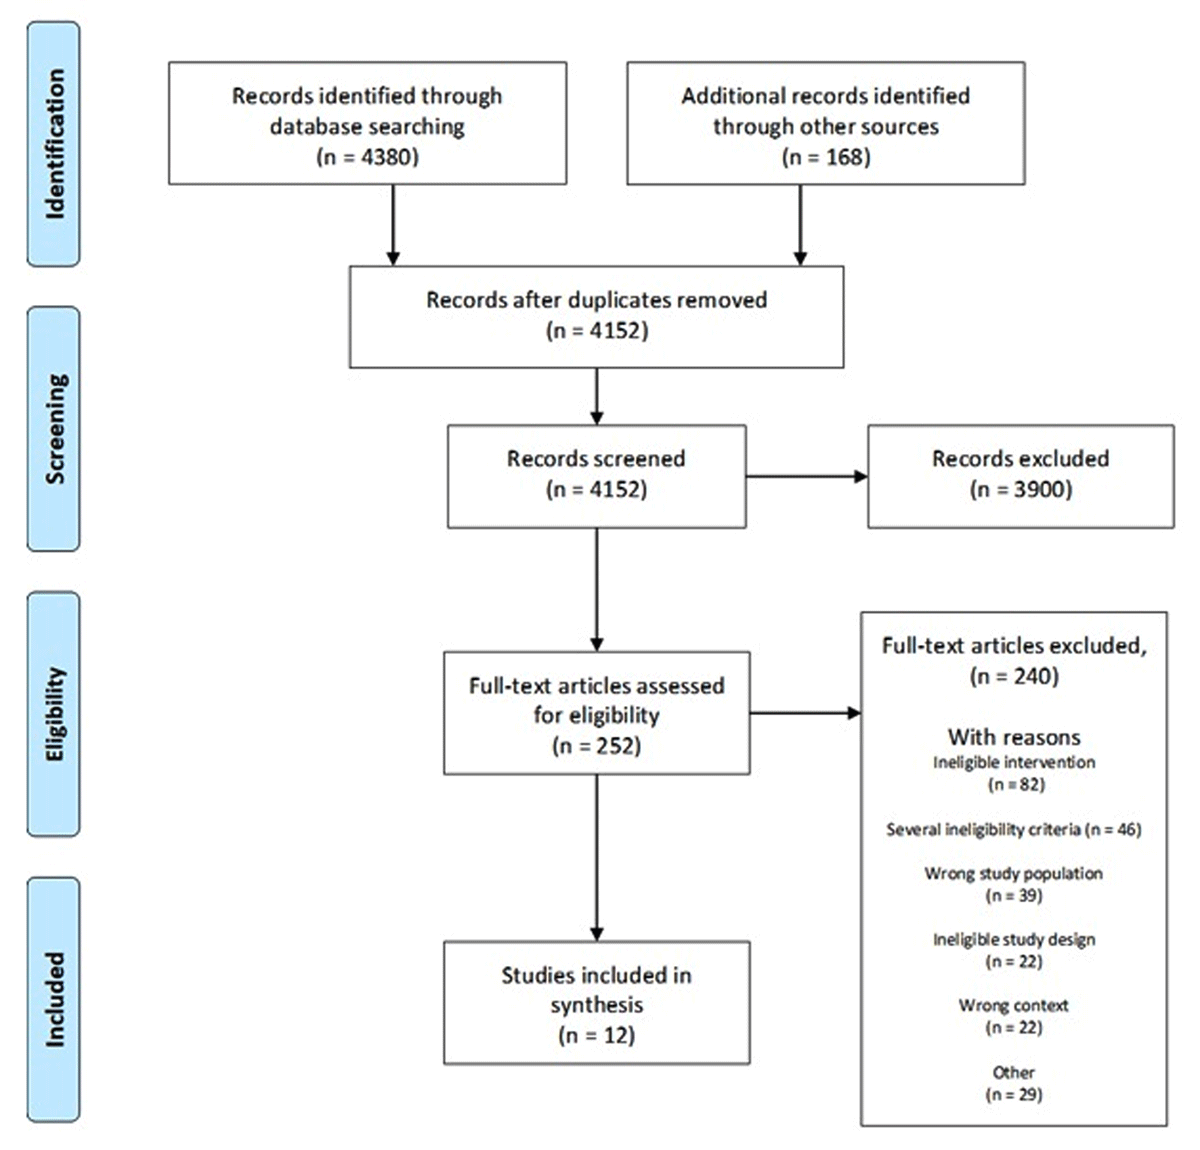
Figure 1
Study selection flow chart.
Table 2
Characteristics of included studies.
| AUTHOR, YEAR | COUNTRY | TYPE OF STUDY | PARTICIPANTS (n, TOTAL) | INTERVENTION AND KEY CHARACTERISTICS | DURATION OF FOLLOW-UP AFTER DISCHARGE (WEEKS) | OUTCOME ASSESSMENT (DAYS) | PARTICIPATING SERVICE PROVIDERS | REPORTED OUTCOMES |
|---|---|---|---|---|---|---|---|---|
| Berntsen 2019 | Norway | NRSI: Synthetic RCT, | 1218 | Patient Centered Team (PACT) Cross-organizational multidisciplinary geriatric team. | As needed. | 30–180 | Hospital and municipality. | Readmission, LoS, Mortality, Emergency- and planned outpatient visits |
| Buurman 2016 | Netherlands | RCT | 674 | Transitional Care Bridge Program Comprehensive Geriatric Assessment, multidisciplinary team | 24 | 30–180 | Hospitals and affiliated home care organizations. | Readmission, Mortality, ADL, Discharge destination |
| Cordato 2018 | Australia | RCT | 43 | Regular Early Assessment Post-Discharge (REAP) Conjoint visits by geriatrician and nurse to nursing homes | 4 | 180 | Hospitals and nursing homes. | Readmission, LoS, ED-visits |
| Crilly 2011 | Australia | NRSI: Quasi-Experimental | 177 | Hospital in the Nursing Home (HINH) Admission avoidance program Outreach service from hospital to nursing homes. | As needed. | 28–365 | Hospital and nursing homes. | Readmission, LoS, ED-visits |
| Jenq 2016 | US | NRIS: DiD, ITS | <30 000 | Greater New Haven Coalition for Safe Transitions and Readmission Reductions program (Co-STARR) Connecting with community services. | 4 | 30 | Hospitals and community partner organization. | Readmission |
| Meyer 2022 | Germany | RCT | 110 | Tailored Intersectoral Discharge Program (TIDP) Cross-organizational multidisciplinary geriatric team | As needed. | 30–180 | Hospital and primary care providers | Readmission, LoS, Mortality, QoL, Discharge destination, Self confidence |
| Robert 2021 | Canada | NRSI: DiD, ITS | 1926 | Sub-Acute Care for Frail Elderly (SAFE) Restorative care in a long-term care home. | 4 | 30 | Hospital and long-term care organization. | Readmission, LoS, Emergency- and planned outpatient visits, Discharge destination |
| Rosstad 2017 | Norway | Cluster-RCT | 304 | Patient Trajectory for Home-dwelling elders (PaTH) Improved procedures for communication and follow-up. | 4 | 30–365 | Hospital and municipalities. | Readmission, LoS, Mortality, ADL, QoL, Outpatient services, Discharge destination |
| Sahota 2017 | UK | RCT | 212 | The Community In-reach Rehabilitation and Care Transition Co-localization in hospitals and rehabilitation. | As needed. | 28–91 | Hospitals and community partner organization. | Readmission, LoS, ADL, QoL |
| Sorensen 2021 | US | NRSI: Retrospective cohort study | 2964 | Collaboration between Primary Care-based Clinical Pharmacists and Community-based Health Coaches. Patient empowerment and medication management. | 4 | 30–90 | Hospitals and community-based organization. | Readmission, ED-visits |
| Thygesen 2015 | Denmark | RCT | 531 | Municipality based post-discharge follow-up visits. Conjoint visits by primary care physicians and municipal nurses. | 8 | 30–180 | Hospitals and municipalities. | Readmission, Mortality, Emergency- and planned outpatient visits, Discharge destination |
| Wong 2011 | Hong Kong | RCT | 555 | Health-Social Partnership Transitional Care Management Program (HSTCMP). Conjoint visits by nurses and social care services. | 4 | 28–84 | Hospitals and social service centers. | Readmission, QoL, Self- Efficacy, Satisfaction with care |
Table 3
Components and effects of interventions. Components that were found more than once are presented here together with effects on three outcomes (readmissions, LoS and mortality). For a more detailed description (including involved professions), see supplementary material B. Arrows indicate the direction of effect. Effect within 0.95–1.05 are presented as —. Follow-ups: H = Home, R = Remote, Blank = not reported.
| AUTHOR | INTERVENTION TARGETED TO NH-RESIDENTS | NON-CLINICAL COMPONENTS | PRE-DISCHARGE COMPONENTS | TRANSITIONAL COMPONENTS | POST-DISCHARGE COMPONENTS | READMISSIONS | LENGTH OF STAY | MORTALITY | |||||||||
|---|---|---|---|---|---|---|---|---|---|---|---|---|---|---|---|---|---|
| PARTNERSHIPS OR AGREEMENTS | WORKFLOW IMPROVEMENT | SHARED PATIENT ENROLLMENT | NEEDS ASSESSMENT (FUNCTIONAL, SOCIAL, COGNITIVE) | CARE PLAN | PERSONAL/ACTIVE HAND-OVER | DEDICATED COORDINATOR | HOSPITAL VISIT BY OUT. PAT. CARE | MULTI-PROFESSIONAL FOLLOW UP | FOLLOW-UP (HOME/PHONE) VISITS | INTERMEDIATE CARE UNIT | POST DISCHARGE PLAN | RECONCILIATION MEETINGS | |||||
| Berntsen 2019 | X | X | X | X | X | X | H, P | X | X | ↓ | ↓ | ↓* | |||||
| Buurman 2016 | X | X | X | X | X | H | ↑ | ↓ | |||||||||
| Cordato 2018 | X | X | H | ↓* | ↓* | ||||||||||||
| Crilly 2011 | X | X | X | H | X | — | ↓* | ||||||||||
| Jenq 2016 | X | X | X | X | P | X | X | — | |||||||||
| Meyer 2022 | X | X | X | X | — | ↑ | ↑ | ||||||||||
| Robert 2021 | X | X | X | X | X | X | X | X | ↑ | ↓* | |||||||
| Rosstad 2017 | X | X | R | X | H | X | X | ↓ | ↓ | ↓ | |||||||
| Sahota 2017 | X | X | X | X | H | ↑ | ↓ | ||||||||||
| Sorensen 2021 | X | X | X | X | H | X | ↓* | ||||||||||
| Thygesen 2015 | R | X | H | X | — | ↑ | ↓↑ | ||||||||||
| Wong 2011 | X | X | X | X | X | H, P | X | ↓* | |||||||||
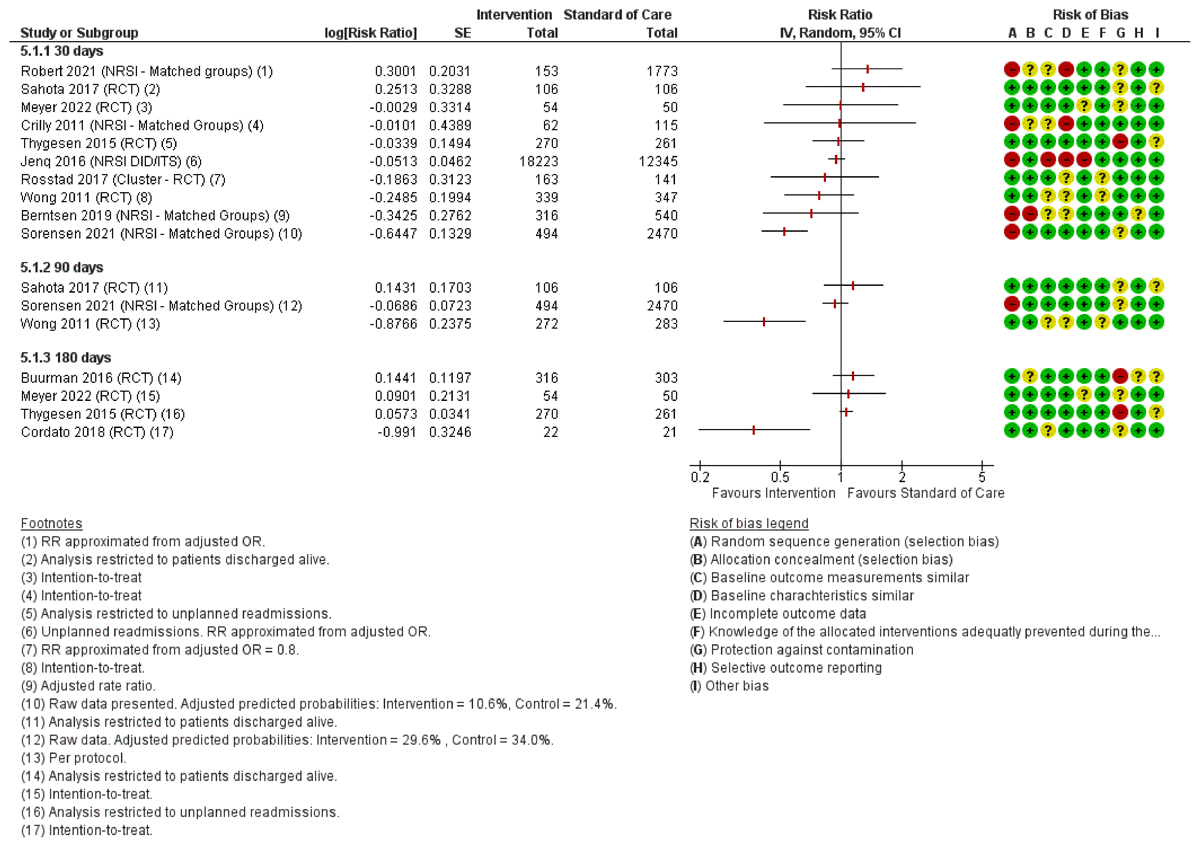
Figure 2
Forest plot of readmissions within 30–180 days. For the risk of bias assessment, red color indicates high risk of bias, yellow indicates unclear risk of bias and green indicates low risk of bias.
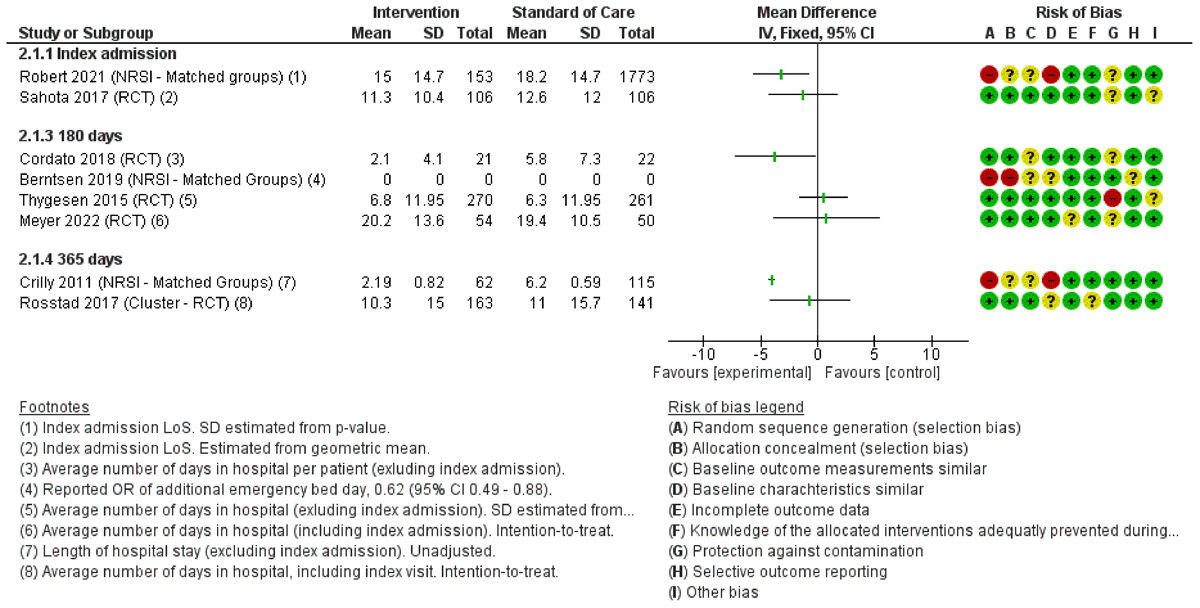
Figure 3
Forest plot with effect estimates for LoS at index admission and total number of days in hospital during 180–365 days.
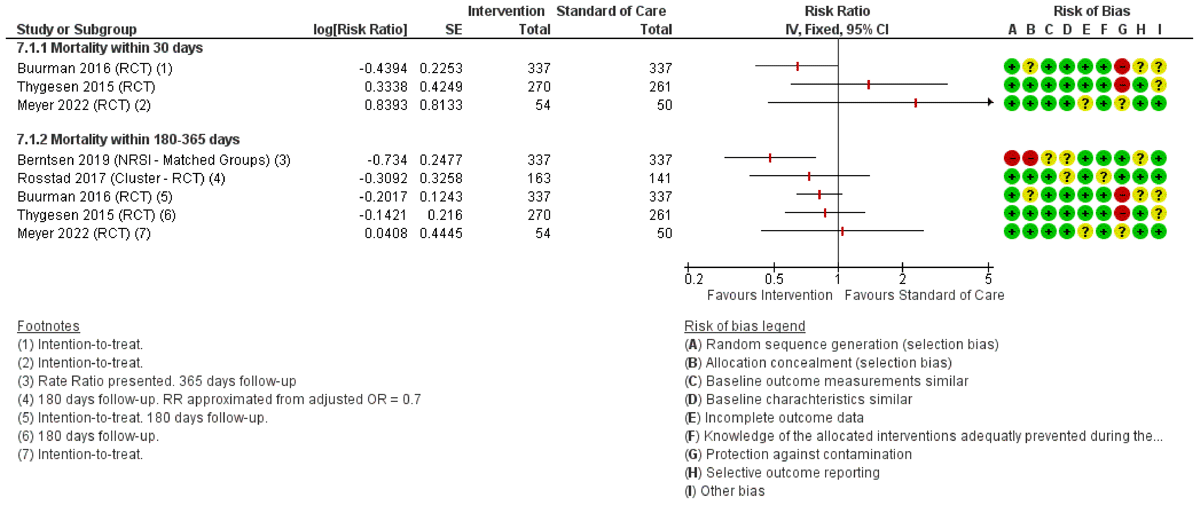
Figure 4
Forest plot of mortality within 30–365 days.