
Table 1
Distribution of the incidence of COVID-19 in institutionalized patients by nursing facility type.
| INCIDENCE OF COVID PER 1,000 RESIDENTS | ||||||||||||||
|---|---|---|---|---|---|---|---|---|---|---|---|---|---|---|
| WAVES AND VALEY PHASES | ||||||||||||||
| NUMBER OF RESIDENTS | 1ST WAVE | VALLEY PHASE 1 | 2ND WAVE | VALLEY PHASE 2 | 3D WAVE | VALLEY PHASE 3 | 4TH WAVE | VALLEY PHASE 4 | 5TH WAVE | VALLEY PHASE 5 | 6TH WAVE | TOTAL | ||
| NURSING FACILITY TYPE | Nursing facilities for the elderly | 11,550 | 189.44 | 82.68 | 90.74 | 11.17 | 73.07 | 1.30 | 1.56 | 1.56 | 27.97 | 4.85 | 114.29 | 598.61 |
| Mental health center | 203 | 59.11 | 14.78 | 19.70 | 0.00 | 14.78 | 4.93 | 0.00 | 4.93 | 49.26 | 9.85 | 68.97 | 246.31 | |
| Center for disabled people | 1228 | 140.88 | 92.83 | 134.36 | 31.76 | 123.78 | 8.14 | 0.00 | 0.00 | 53.75 | 0.81 | 96.09 | 682.41 | |
| Youth home | 297 | 0.00 | 26,94 | 43.77 | 3.37 | 23.57 | 6.73 | 3.37 | 3.37 | 77.44 | 10.10 | 144.78 | 343.43 | |
| Center for people at risk of social exclusion | 55 | 109.09 | 18.18 | 36.36 | 0.00 | 54.55 | 18.18 | 0.00 | 0.00 | 0.00 | 0.00 | 163.64 | 400.00 | |
| Convent | 36 | 194.44 | 194.44 | 0.00 | 0.00 | 0.00 | 0.00 | 0.00 | 0.00 | 0.00 | 0.00 | 55.56 | 444.44 | |
| TOTAL | 13369 | 178.47 | 81.38 | 92.15 | 12.64 | 75.47 | 2.17 | 1.42 | 1.50 | 31.57 | 4.64 | 112.65 | 594.06 | |
Table 2
Mortality rate of institutionalized patients with confirmed COVID-19 diagnosis.
| COVID MORTALITY RATE PER 1,000 RESIDENTS | ||||||||||||
|---|---|---|---|---|---|---|---|---|---|---|---|---|
| 1ST WAVE | VALLEY PHASE 1 | 2ND WAVE | VALLEY PHASE 2 | 3D WAVE | VALLEY PHASE 3 | 4TH WAVE | VALLEY PHASE 4 | 5TH WAVE | VALLEY PHASE 5 | 6TH WAVE | TOTAL | |
| RESIDENTS WITH COVID DIAGNOSIS | 97.84 | 32.31 | 30.37 | 3.89 | 19.37 | 0.22 | 0.37 | 0.30 | 6.88 | 0.22 | 2.69 | 194.48 |
| ≤30 DAYS SINCE DIAGNOSIS | 57.90 | 11.89 | 11.89 | 1.12 | 6.96 | 0.00 | 0.07 | 0.15 | 3.74 | 0.00 | 2.02 | 95.74 |
| >30 DAYS SINCE DIAGNOSIS | 39.94 | 20.42 | 18.48 | 2.77 | 12.42 | 0.22 | 0.30 | 0.15 | 3.14 | 0.22 | 0.67 | 98.74 |
Table 3
Distribution of the incidence of COVID-19 in workers by nursing facility type.
| INCIDENCE OF COVID PER 1,000 WORKERS | ||||||||||||||
|---|---|---|---|---|---|---|---|---|---|---|---|---|---|---|
| WAVES AND VALEY PHASES | ||||||||||||||
| NUMBER OF WORKERS | 1ST WAVE | VALLEY PHASE 1 | 2ND WAVE | VALLEY PHASE 2 | 3D WAVE | VALLEY PHASE 3 | 4TH WAVE | VALLEY PHASE 4 | 5TH WAVE | VALLEY PHASE 5 | 6TH WAVE | TOTAL | ||
| NURSING FACILITY TYPE | Nursing facilities for the elderly | 5970 | 58.96 | 47.91 | 76.55 | 7.87 | 64.49 | 5.19 | 7.20 | 1.51 | 64.66 | 17.76 | 204.86 | 556.95 |
| Mental health center | 144 | 48.61 | 20.83 | 20.83 | 0.00 | 13.89 | 0.00 | 0.00 | 0.00 | 41.67 | 13.89 | 194.44 | 354.17 | |
| Center for disabled people | 1407 | 24.16 | 24.16 | 78.89 | 9.24 | 61.83 | 2.84 | 4.26 | 2.13 | 65.39 | 14.93 | 188.34 | 476.19 | |
| Youth home | 99 | 0.00 | 0.00 | 101.01 | 0.00 | 10.10 | 0.00 | 0.00 | 0.00 | 70.71 | 10.10 | 242.42 | 434.34 | |
| Center for people at risk of social exclusion | 28 | 0.00 | 35.71 | 71.43 | 0.00 | 71.43 | 0.00 | 35.71 | 35.71 | 107.14 | 0.00 | 214.29 | 571.43 | |
| Convent | 13 | 0.00 | 0.00 | 384.62 | 0.00 | 0.00 | 76.92 | 0.00 | 0.00 | 0.00 | 0.00 | 230.77 | 692.31 | |
| TOTAL | 7661 | 51.30 | 42.29 | 76.75 | 7.83 | 62.26 | 4.70 | 6.53 | 1.70 | 64.48 | 16.97 | 202.19 | 537.01 | |
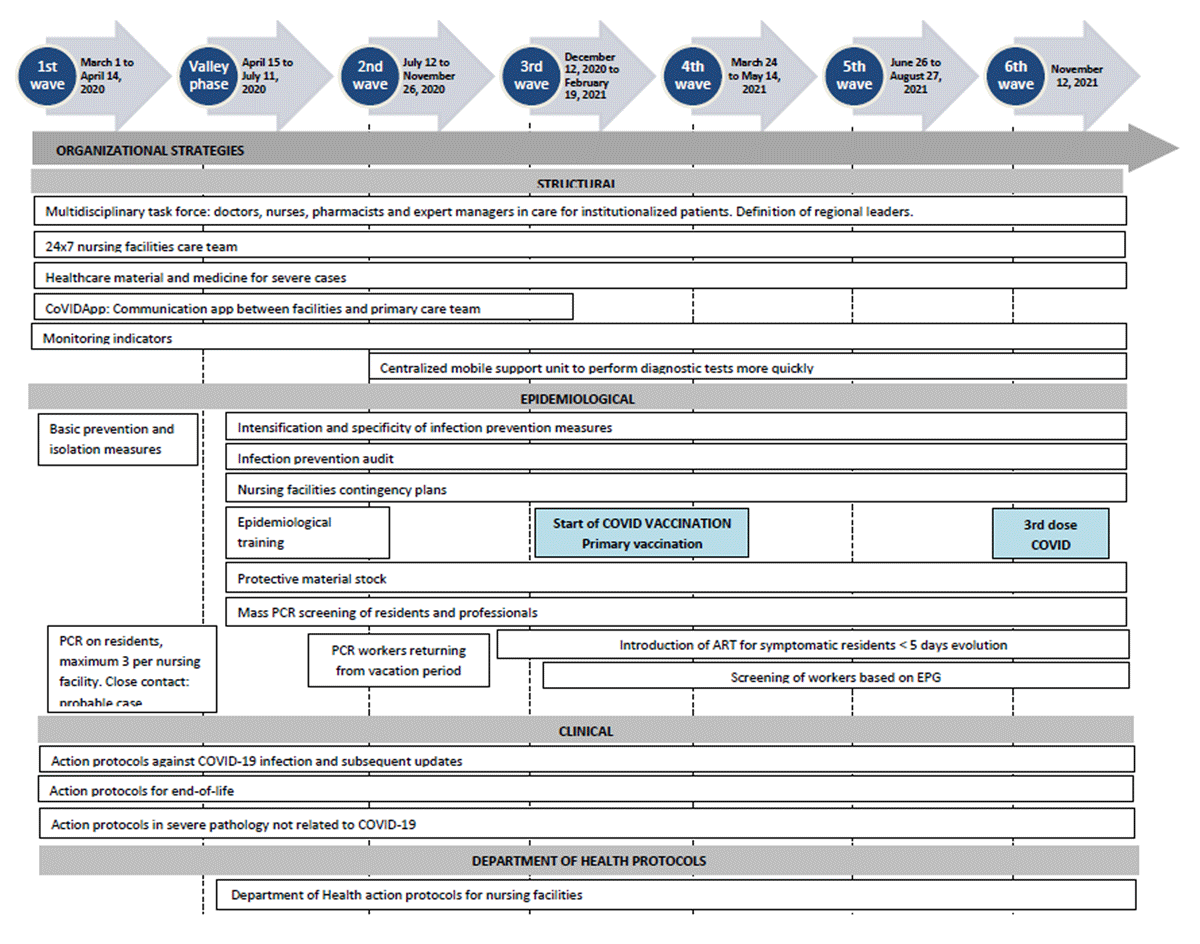
Figure 1
Main characteristics of the actions from the operational pandemic response.
PCR: Polymerase Chain Reaction.
EPG: Epidemiological Potential Growing. Trend indicator of the risk of relapse. ART: Rapid antigen test.
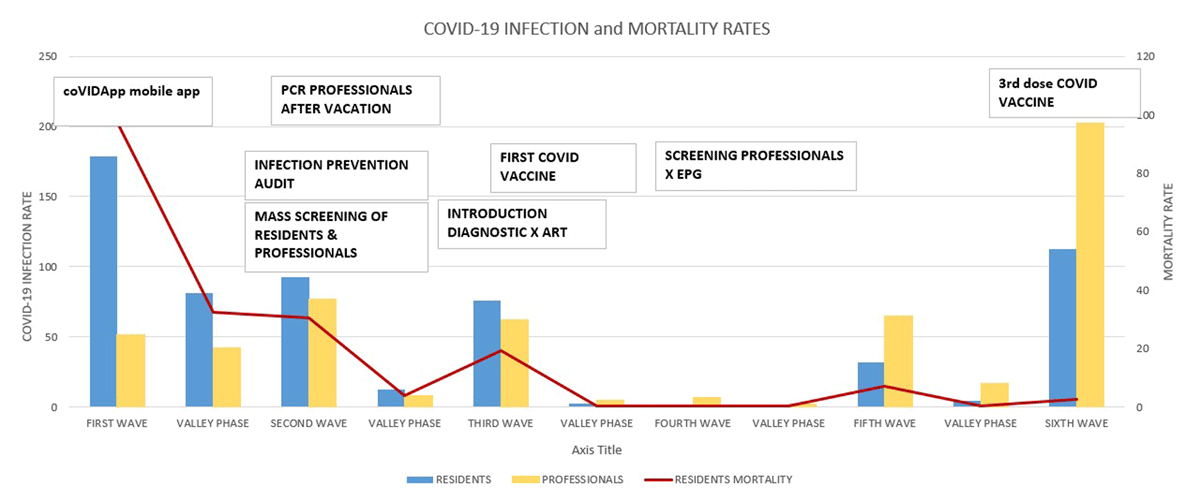
Figure 2
Impact of different measures adopted in our territory to favor control of COVID-19 infection and mortality rates.
ART: Rapid antigen test.
EPG: Epidemiological Potential Growing. Trend indicator of the risk of relapse.