
Table 1
Challenges, barriers and proposed solutions to the new model of care.
| CHALLENGE | BARRIER | SOLUTION |
|---|---|---|
| Direction and Strategy | ||
| Several clinical services involved without common governance. | Conflict of powers between heads of service. | Transversal leadership system. Semi-annual rotation of the leadership position. |
| Incorporate patients into decision making. | Absence of references in the institution. | Incorporation of patients into the governance team. |
| The best multidisciplinary model of care and preferential circuits is not defined. | Absence of references. | Creation of a committee of experts. Bibliographic review. Hiring a specialized consulting firm. |
| Unify the center in the same location. | Need to renew facilities. New location available away from the general hospital. | Search for financing for the works. Transfer between locations. |
| Ability to respond to expected patient demand. | High care volume workload. Call effect due to the center’s novelty. | Prioritize patients treated with biological therapies or targeted molecules. |
| Processes Management | ||
| Patient-centered clinical care. | System focused on the process. | Redefinition of processes. Preparation of a patient-centered process map. |
| Patients with more than one IMIDs not correctly integrated. | Complexity in the management of these patients by different professionals. | Creation of a multidisciplinary committee for the management of these patients. |
| Professional maintenance of each patient. | Center far from individual services. | Reconciliation of the agendas of the professionals involved. |
| Incorrect referral of patients. | Lack of knowledge by professionals. | Dissemination plan for the criteria for referral to the center. |
| Continuous evaluation of the results. | Difficulty of data exploitation. | Development of a specific dashboard. Collaboration with the hospital’s quality service. |
| People | ||
| Need for additional personnel to cover the service. | Lack of resources to hire new personnel. | Conciliation and displacement of previously available personnel. |
| Alliances | ||
| Improve communication with patient. | Lack of resources. | Search for financing to develop telemedicine projects. |
| Improving continuity of care between different levels. | Poor coordination with primary care. | Preparation of a training and communication plan between care levels. |
| National and international recognition as a reference center. | – | Seek support from hospital management and industry. Preparation of an image and dissemination plan. |
Table 2
Main initiatives implemented.
| Direction and Strategy |
|
|
|
|
|
|
|
|
|
|
|
| Processes Management |
|
|
|
|
|
|
| People |
|
|
|
|
| Alliances |
|
|
|
|
|
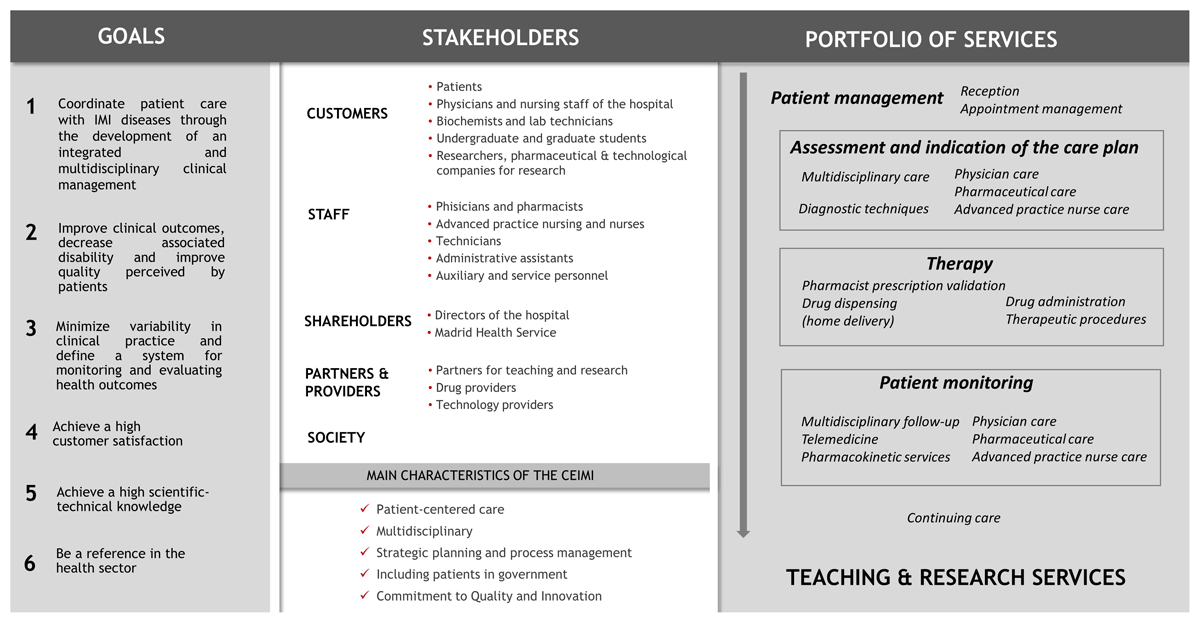
Figure 1
Goals, stakeholders and portfolio of services of the CEIMI.
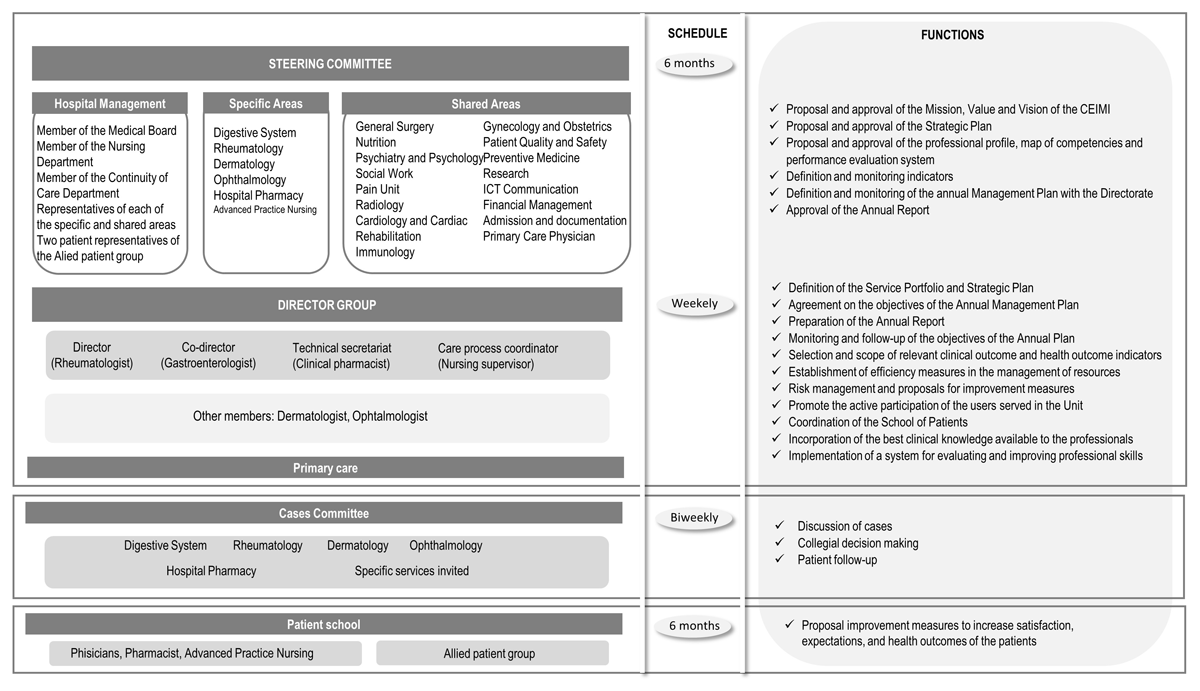
Figure 2
Management structure.
Table 3
Differences between the old and new care model.
| TRADITIONAL CARE MODEL | NEW INTEGRATED CARE MODEL | IMPROVEMENT |
|---|---|---|
| Direction and Strategy | ||
| Absence of mutual leadership team. Address dependent on each Clinical Service. | Transversal leadership system | Collaborative government. Participation of all professionals involved in decision making. |
| Case Committee no available | Case Committee | Collegiate and shared decision about the most appropriate care plan for each patient |
| Leadership system without patients | Patients included in the leadership system | Promote responsibility and empowerment of patients |
| Facilities distributed in multiple locations | Center located in a single location | The whole care process was performed on the same day and in the same place to avoid unnecessary hospital visits |
| Patients with more than one IMIDs | Mutidisciplinary consultations | Patients with different concomitant IMIDs were attended simultaneously in the same room by two or more different specialists |
| Model without nurses or with non-specialized nurses | Incorporation the figure of the APN with a key role | APN provide personalized and comprehensive quality care to patients and their environment through a care model of shared decision, patient-centered and coordinated between the different levels of care and health professionals |
| Processes Management | ||
| Process-centered model | Patient-centered model | Improving quality of care and patient experience |
| Multiple clinical circuits not coordinated with each other | Integrated and coordinated patient care circuit | Optimization of healthcare resources and improving patient experience |
| Evaluation plan not defined and dependent on each service | Implementation an evaluation plan | Measure results and optimize objectives |
| No standardized measurement of results or evaluation of processes | Implementation of a custom scorecard covering all process | Facilitates analysis and peer comparison |
| Patient Reported Outcomes not available | Incorporated Patient Reported Outcomes into clinical practice | Improvement clinical care |
| People | ||
| The competencies of each professional are not adequately defined | Development an organizational manual with adequate definition of competencies | Optimization of personal resources and improving professionals satisfaction |
| Welcome plan for staff not available | Creation of a welcome plan for staff | Improved staff satisfaction |
| Alliances | ||
| E-health tools not available | Teleconsultation and app available | Communication and real-time monitoring of patients and provide additional data to support clinical decision-making, improve the quality of care, and contribute to the empowerment of patients |
| Poor coordination with others services and primary care | Creation of internal alliances with different services and primary care | Improved coordination between care services and levelsnand the continuity of health care |
| School of Patient not available | Implementation of a School of Patient | Improve the education of the patient and their families |
Table 4
Key performance indicator.
| CLASS | INDICATOR | PERIODICITY OF EVALUATION |
|---|---|---|
| Activity | Nº of attended patients | Quarterly |
| Nº of patients treated with BT or TT | Quarterly | |
| Nº of new patients starting treatment at CEIMI | Quarterly | |
| Nº of physician’s consultations | Quarterly | |
| - Nº of telematic consultations | - Quarterly | |
| - % of unscheduled consultations | - Quarterly | |
| Nº of pharmacist consultations | Quarterly | |
| - Nº of telematic consultations | - Quarterly | |
| Nº of nurse consultations | Quarterly | |
| - Nº of telematic consultations | - Quarterly | |
| Nº of drug dispensations | Quarterly | |
| Nº of home delivery dispensations | Quarterly | |
| Nº of sessions in Day Hospital | Quarterly | |
| Nº of patients attended at Day Hospital | Quarterly | |
| % patients treated of the Health Area | Quarterly | |
| Health | Age, mean (SD) | Annual |
| % Male | Annual | |
| Effectiveness | ||
| % of patients in remission* | Annual | |
| % of patients admitted to hospital | Annual | |
| Nº hospital admission/patient/year | Annual | |
| Average stay of admission/patient | Annual | |
| % of patients with emergency room visits | Annual | |
| Nº emergency room visits/patient/year | Annual | |
| Safety | ||
| % of patients with treatment suspension due to toxicity | Quarterly | |
| Severe infusion reaction | Quarterly | |
| Nº of patients with severe extravasation problems | Quarterly | |
| Quality of live | ||
| EUROQOL, median (IQR) | Annual | |
| HAD, median (IQR) | Annual | |
| WPAI**, % | Annual | |
| WPAI***, mean (SD) | Annual | |
| QOL-RA, median (IQR) | Annual | |
| AsQOL, median (IQR) | Annual | |
| PsAQOL, median (IQR) | Annual | |
| IBDQ, median (IQR) | Annual | |
| DLQUI, median (IQR) | Annual | |
| Efficiency | ||
| % of patients with tapering of the treatment | Quarterly | |
| % of patients with intensification of treatment | Quarterly | |
| % of patients with biosimilar molecule**** | Quarterly | |
| Average cost per patient/year | Quarterly | |
| % patients with lower cost counseling | Quarterly | |
| Quality | ||
| % of patients with adherence > 90% | Annual | |
| % of patients with drug levels | Quarterly | |
| % of patients with antibodies anti-drug | Quarterly | |
| Satisfaction | Patient | |
| Average score on outpatient satisfaction | Annual | |
| With physicians | Annual | |
| With pharmacist | Annual | |
| With APN | Annual | |
| Coordination between professionals | Annual | |
| Customer | ||
| Average score on internal customer satisfaction | Biannual | |
| Average score on external customer satisfaction | Biannual | |
| Average score on student/resident satisfaction | Biannual | |
| People | ||
| Average global score on the work climate survey | Biannual | |
| Score of Physicians/pharmacist/nurses | Biannual | |
| Score of other non-sanitary staff | Biannual | |
| Score in specific aspects | Biannual | |
| Society | Nº of clinical trials | Annual |
| Nº of research projects | Annual | |
| Nº of publications | Annual | |
| Annual impact factor of scientific publications | Annual | |
| Nº of courses | Annual | |
| Nº of conferences | Annual | |
| Nº of visits received by other organizations | Annual | |
| Nº of mentions in the media | Annual | |
| Nº of twitter followers | Annual | |
| Nº of audiovisual tools | Annual | |
| Nº of prizes awarded | Annual | |