
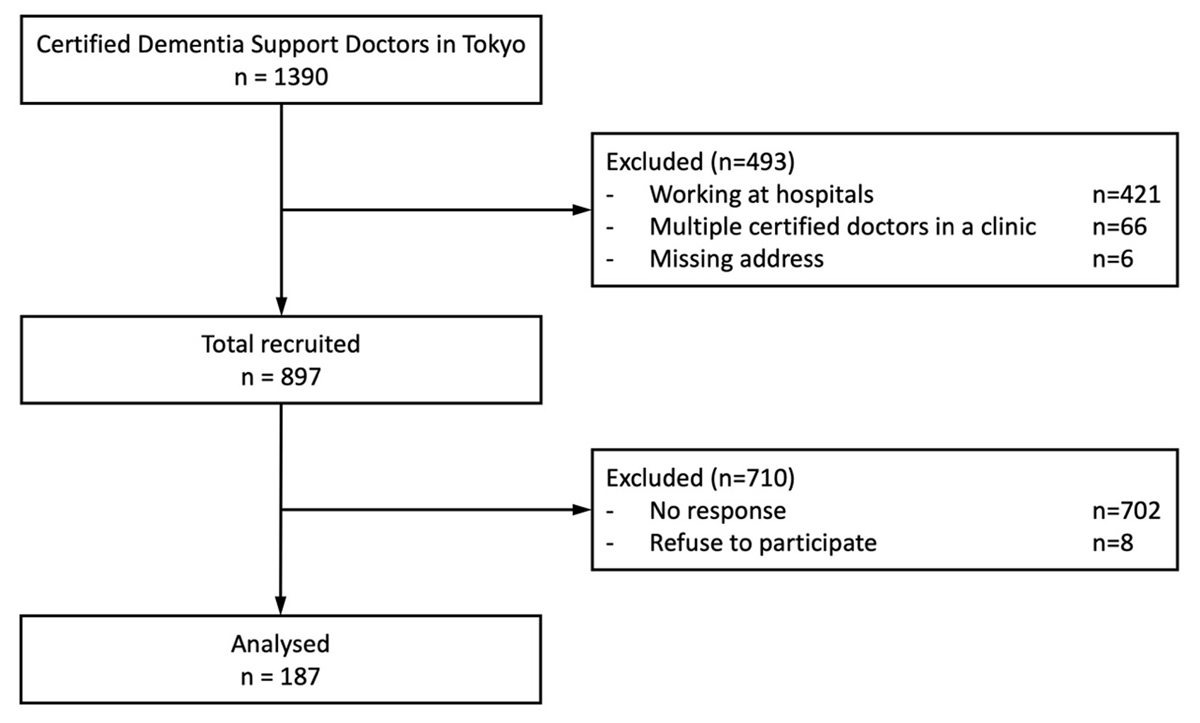
Figure 1
Flowchart of the participants.
Table 1
Sample characteristics.
| n = 187 | % | ||
|---|---|---|---|
| Age | 30–39 | 5 | 2.7% |
| 40–49 | 24 | 12.8% | |
| 50–59 | 60 | 32.1% | |
| 60–69 | 66 | 35.3% | |
| 70–99 | 30 | 16.1% | |
| Sex | Men | 148 | 79.1% |
| Women | 37 | 19.8% | |
| Specialty | Internal medicine | 132 | 70.6% |
| Psychiatry | 21 | 11.2% | |
| Family medicine | 8 | 4.3% | |
| Orthopaedic surgery | 6 | 3.2% | |
| Neurosurgery | 6 | 3.2% | |
| Surgery | 5 | 2.7% | |
| Other | 9 | 4.8% | |
| IIST | Yes | 61 | 32.6% |
[i] IIST, Initial-phase Intensive Support Team.
Table 2
Conditional probabilities of each variable for three-class latent class analysis.
| CONCEPTS | VARIABLES | ITEMS | PCP-led (46.6%) | CM-led (32.8%) | Stand-alone (20.6%) |
|---|---|---|---|---|---|
| Team member | Number of professions | 1 | 0.11 | 0.07 | 0.64 |
| 2–3 | 0.28 | 0.40 | 0.36 | ||
| 4≤ | 0.61 | 0.52 | 0.00 | ||
| Member’s decision-making responsibility | Doctors | Yes | 1.00 | 0.51 | 1.00 |
| No | 0.00 | 0.49 | 0.00 | ||
| Care managers | Yes | 0.25 | 0.97 | 0.09 | |
| No | 0.75 | 0.03 | 0.91 | ||
| Organisation’s role | Hosting care conferences | Clinics | 0.41 | 0.09 | 0.07 |
| Other organisations | 0.46 | 0.73 | 0.18 | ||
| Not held | 0.13 | 0.18 | 0.75 | ||
| Responsibility in care decisions | Clinics | 0.78 | 0.22 | 0.67 | |
| MCD | 0.08 | 0.05 | 0.24 | ||
| CCSC | 0.15 | 0.54 | 0.06 | ||
| LTC offices | 0.00 | 0.19 | 0.03 | ||
| Clinic’s inter-organisation communication | with MCD | Face to face | 0.15 | 0.12 | 0.03 |
| In writing | 0.56 | 0.68 | 0.58 | ||
| None | 0.29 | 0.19 | 0.39 | ||
| with CCSC | Face to face | 0.90 | 0.79 | 0.27 | |
| In writing | 0.08 | 0.13 | 0.20 | ||
| None | 0.02 | 0.08 | 0.53 | ||
| with LTC offices | Face to face | 0.76 | 0.83 | 0.14 | |
| In writing | 0.21 | 0.15 | 0.51 | ||
| None | 0.03 | 0.02 | 0.35 |
[i] MCD, Medical Centre for Dementia; CCSC, Community-based Comprehensive Support Centre; LTC, long-term care.
Table 3
Comparative description of the three models.
| MODEL NAME | MODEL DESCRIPTION |
|---|---|
| PCP-led Participatory Decision-making Model | PCPs take the lead in making care decisions for individuals with early-stage dementia, with CMs partially contributing. Verbal communication serves as the primary mode of interorganisational collaboration. PCPs and/or CMs host interprofessional care conferences across organisations, during which team members share information to coordinate care and inform decision-making. |
| CM-led Membership Responsibility Model | CMs assume the primary responsibility for making care decisions for individuals with early-stage dementia. PCPs participate in the interprofessional care team and attend conferences to fulfil their responsibilities of providing information and make care decisions pertaining of the medical aspect. Clinics, CCSCs, and LTC offices collaborate closely through direct communication across organisations. |
| Stand-alone and Letter Referrals Model | PCPs are solely responsible for care decision for individuals with early-stage dementia, in which CMs are not involved. The practice does not leverage Interprofessional team or care conferences. Clinics’ interorganisational communication relies on exchanges of written referrals and replies. |
Table 4
Human resources and services of clinics in each model.
| PCP-led (n = 84) | CM-led (n = 55) | Stand-alone (n = 36) | p | 1 vs 2 | 1 vs 3 | 2 vs 3 | |||||
|---|---|---|---|---|---|---|---|---|---|---|---|
| Human resources | Dr (full time), mean, SD | 1.7 | (1.2) | 1.5 | (1.2) | 1.4 | (1.1) | 0.455 | |||
| Dr (part time), mean, SD | 2.8 | (4.1) | 1.6 | (2.7) | 1.4 | (2.3) | 0.052 | ||||
| NS (full time), mean, SD | 2.9 | (3.8) | 2.2 | (4.4) | 1.1 | (1.9) | 0.056 | ||||
| NS (part time), mean, SD | 1.2 | (1.7) | 1.7 | (2.4) | 1.1 | (1.6) | 0.191 | ||||
| SW, n,% | 14 | (16.7%) | 4 | (7.3%) | 2 | (5.6%) | 0.109 | ||||
| CM, n,% | 11 | (13.1%) | 6 | (10.9%) | 2 | (5.6%) | 0.477 | ||||
| PT/OT/ST, n,% | 17 | (20.2%) | 10 | (18.2%) | 2 | (5.6%) | 0.13 | ||||
| Psych, n,% | 8 | (9.5%) | 3 | (5.5%) | 2 | (5.6%) | 0.597 | ||||
| Number of patients with early-stage dementia | <50 | 56 | (67.5%) | 38 | (70.4%) | 33 | (91.7%) | 0.027 | * | ||
| 50–99 | 12 | (14.5%) | 8 | (14.8%) | 0 | (0.0%) | |||||
| 100< | 15 | (18.0%) | 8 | (14.9%) | 3 | (8.4%) | |||||
| Perceived time for Dr consultation | <10 min | 24 | (29.3%) | 22 | (40.7%) | 16 | (45.7%) | 0.02 | * | ||
| 10–19 min | 38 | (46.3%) | 27 | (50.0%) | 15 | (42.9%) | |||||
| 20–29 min | 15 | (18.3%) | 4 | (7.4%) | 3 | (8.6%) | |||||
| 30 < min | 5 | (6.1%) | 1 | (1.9%) | 1 | (2.9%) | |||||
| Perceived time for NS consultation | 0 min | 45 | (57.0%) | 30 | (57.7%) | 26 | (76.5%) | 0.065 | |||
| <10 min | 14 | (17.7%) | 14 | (26.9%) | 6 | (17.6%) | |||||
| 10–19 min | 12 | (15.2%) | 5 | (9.6%) | 2 | (5.9%) | |||||
| 20 < min | 8 | (10.1%) | 3 | (5.8%) | 0 | (0.0%) | |||||
| SW or CM consultation | Yes | 11 | (13.2%) | 10 | (18.2%) | 1 | (2.9%) | 0.34 | |||
[i] PCP, primary care physician; CM, care manager; Dr, doctor; NS, nurse; SW, social worker; PT, physical therapist; OT, occupational therapist; ST, speech therapist; Psych, psychologist.
P-values for overall and pair-wise comparisons were calculated using chi-square and Z tests for categorical variables; one-way ANOVA and two-sample t-test for continuous variables; and Kruskal-Wallis and Mann-Whitney U tests for ordinal variables. For the pair-wise comparisons, p-values were corrected with Bonferroni method. The symbol * indicates statistical significance for pair-wise comparisons.
Table 5
Daily practices of support provision in each model.
| TOTAL (n = 175) | PCP-led (n = 84) | CM-led (n = 55) | Stand-alone (n = 36) | p | 1 vs 2 | 1 vs 3 | 2 vs 3 | |||||
|---|---|---|---|---|---|---|---|---|---|---|---|---|
| Cognitive function | ||||||||||||
| Assessment of cognitive function | 166 | (94.9%) | 84 | (100.0%) | 52 | (94.5%) | 30 | (85.7%) | 0.003 | * | ||
| Medication for BPSD | 164 | (93.7%) | 81 | (96.4%) | 53 | (96.4%) | 30 | (85.7%) | 0.052 | |||
| Physical health | ||||||||||||
| Assessment of physical health | 165 | (94.3%) | 81 | (96.4%) | 53 | (96.4%) | 31 | (88.6%) | 0.174 | |||
| Fall risk intervention | 151 | (86.3%) | 77 | (91.7%) | 47 | (85.5%) | 27 | (75.0%) | 0.051 | |||
| Care planning | ||||||||||||
| Medical care plan | 160 | (91.4%) | 84 | (100.0%) | 49 | (90.7%) | 27 | (79.4%) | <0.001 | * | ||
| Long-term care plan | 153 | (87.4%) | 82 | (97.6%) | 46 | (83.6%) | 25 | (71.4%) | <0.001 | * | * | |
| Carer support | ||||||||||||
| Assessment of carers’ health status | 144 | (82.3%) | 79 | (94.0%) | 46 | (85.2%) | 19 | (54.3%) | <0.001 | * | * | |
| Carer counselling | 100 | (57.1%) | 53 | (63.9%) | 32 | (59.3%) | 15 | (42.9%) | 0.105 | |||
| Informational support | ||||||||||||
| Patient basic information | 116 | (66.3%) | 68 | (81.0%) | 35 | (63.6%) | 13 | (36.1%) | <0.001 | * | ||
| Carer basic information | 116 | (66.3%) | 71 | (85.5%) | 33 | (61.1%) | 12 | (34.3%) | <0.001 | * | * | |
| Psychological health | ||||||||||||
| Assessment of psychological health | 119 | (68.0%) | 57 | (67.9%) | 38 | (69.1%) | 24 | (66.7%) | 0.97 | |||
| Post-diagnostic counselling | 102 | (58.3%) | 53 | (63.1%) | 33 | (60.0%) | 16 | (44.4%) | 0.157 | |||
| Social health | ||||||||||||
| Assessment of social health | 112 | (64.0%) | 63 | (75.0%) | 35 | (64.8%) | 14 | (40.0%) | 0.001 | * | ||
| Dementia café | 98 | (56.0%) | 59 | (70.2%) | 29 | (53.7%) | 10 | (28.6%) | <0.001 | * | ||
[i] PCP, primary care physician; CM, care manager; BPSD, behavioural and psychological symptoms of dementia.
P-values for overall and pair-wise comparisons were calculated using chi-square and Z tests. For the pair-wise comparisons, p-values were corrected with Bonferroni method. The symbol * indicates statistical significance for pair-wise comparisons.