
Table 1
Clinical characteristics of the implementation cohort (N = 264).
| CLINICAL CHARACTERISTICS | N (%) |
|---|---|
| Main clinical diagnoses grouped | |
| Arterial hypertension | 158 (59.8) |
| Skeletal muscle | 156 (59.1) |
| Cardiological | 112 (42.4) |
| Respiratory | 92 (34.8) |
| Cognitive disorder/dementia | 86 (32.6) |
| Diabetes Mellitus 2 | 83 (31.4) |
| Chronic kidney disease | 75 (28.4) |
| Complexity profile | |
| Advanced chronic disease patients | 147 (55.7) |
| Complex chronic patients | 117 (44.3) |
| ProPCC Programme inclusion criteria* | |
| Multimorbidity with a high risk of readmission | 145 (54.9) |
| Complex functional dependency | 53 (20.1) |
| Advanced complex disease | 51 (19.3) |
| Coping difficulties with polipharmacy | 48 (18.2) |
| Frequent visits to the Emergency Department for the same reason | 32 (12.1) |
| Difficulties accepting the lack of health | 31 (11.7) |
| Caregiver burden | 31 (11.7) |
| Coping difficulties in the care of patients living with dementia | 23 (8.7) |
| Adjusted morbidity groups (GMA) | |
| Group 4 | 156 (83) |
| Group 3 | 30 (16) |
| Groups 1–2 | 2 (1) |
| Place of residence | |
| Own home (with family or external caregiver support) | 240 (90.9) |
| Nursing home | 24 (9.1) |
[i] * Patients could have more than one inclusion criterion.
Table 2
Multidisciplinary collaboration derived from the implementation of the programme (N = 264).
| MULTIDISCIPLINARY COLLABORATION | N (%) |
|---|---|
| Presentation of cases in multidisciplinary meetings | |
| Case conference ProPCC 1 (primary care teams) | 174 (66%) |
| Case conference ProPCC 2 (community based teams) | 235 (89%) |
| Consultories ProPCC 3 (primary care and hospital-based teams) | 35 (13.3%) |
| Activation of community services | |
| Palliative care at home | 69 (26.1%) |
| Rehabilitation at home | 47 (17.8%) |
| Hospital-at-home | 22 (8.3%) |
| Activation of hospital resources | |
| Hospital-based Case Management unit | 89 (33.7%) |
Table 3
Time spent at home 6 months before and after the inclusion in the programme, for the general population and according to survival.
| N (%) | DAYS AT HOME 6 MONTHS PRE-INTERVENTION* | DAYS AT HOME 6 MONTHS POST-INTERVENTION* | VARIATION (DAYS, %) | P VALUE | |
|---|---|---|---|---|---|
| Survivors | 206 (78%) | 171.56 (17.28) | 177.01 (11.31) | 5.45 (3.17%) | p < 0.05 |
| Non survivors | 58 (22%) | 167.90 (23.68) | 172.66 (16.09) | 4.76 (2.83%) | p < 0.05 |
| Total | 264 (100%) | 169.23 (21.61) | 174.24 (14.67) | 5.01 (2.96%) | p < 0.05 |
[i] * Variables are mean (Standard Deviation).
Table 4
Variations in the use of healthcare resources 6 months before and after the inclusion in the programme, for the whole sample and after a segment-by-segment analysis based on survival.
| WHOLE SAMPLE (N = 264) | RESOURCE | 6-MONTHS PRE-INTERVENTION* | 6-MONTHS POST-INTERVENTION* | MEAN VARIATION | P VALUE |
|---|---|---|---|---|---|
| Primary care visits | Physician | 8.22 (8.28) | 11.45 (13.39) | 39.88% | <0.05 |
| Nurse | 9.33 (11.90) | 19.85 (19.34) | 111.84% | <0.05 | |
| Social worker | 0.99 (2.74) | 2.06 (3.65) | 107.76% | <0.05 | |
| Continuous/urgent care | 0.71 (3.67) | 0.72 (2.98) | 1.12% | 0.97 | |
| Hospital care use | Emergency department visits | 1.39 (1.69) | 0.87 (1.42) | –37.23% | <0.05 |
| Hospital admissions | 0.70 (1.05) | 0.49 (0.83) | –29.24% | <0.05 | |
| Hospital Stay | Hospital days | 12.77 (21.63) | 7.85 (14.75) | –38.29% | <0.05 |
| SURVIVORS (N = 206) | RESOURCE | 6-MONTHS PRE-INTERVENTION* | 6-MONTHS POST-INTERVENTION* | MEAN VARIATION | P VALUE |
| Primary care visits* | Physician | 7.77 (8.65) | 12.19 (14.1) | 56.89% | <0.05 |
| Nurse | 8.54 (12.03) | 21.25 (20.11) | 148.83% | <0.05 | |
| Social worker | 0.65 (1.77) | 2.14 (3.57) | 229% | <0.05 | |
| Continuous/urgent care | 0.65 (4) | 0.68 (3.3) | 3.75% | 0.97 | |
| Hospital care use | Emergency department visits | 1.29 (1.6) | 0.79 (1.39) | –38.76% | <0.05 |
| Hospital admissions | 0.62 (0.96) | 0.38 (0.75) | –39.3% | <0.05 | |
| Hospital Stay | Hospital days | 10.85 (19.84) | 6.47 (13.94) | –40.39% | <0.05 |
| NON-SURVIVORS (N = 58) | RESOURCE | 6-MONTHS PRE-INTERVENTION* | 6-MONTHS POST-INTERVENTION* | MEAN VARIATION | P VALUE |
| Primary care visits* | Physician | 9.81 (6.64) | 8.85 (10.22) | –9.79% | 0.54 |
| Nurse | 12.16 (11.12) | 14.91 (15.49) | 22.62% | 0.27 | |
| Social worker | 2.21 (4.63) | 1.79 (3.97) | –19% | 0.61 | |
| Continuous/urgent care | 0.88 (1.34) | 0.87 (1.34) | 1.14% | 1 | |
| Hospital care use | Emergency department visits | 1.78 (1.96) | 1.17 (1.52) | –34.27% | 0.06 |
| Hospital admissions | 0.97 (1.3) | 0.91 (0.98) | –6.19% | 0.81 | |
| Hospital Stay | Hospital days | 19.59 (26.1) | 12.79 (16.56) | –34.71% | 0.09 |
[i] * Variables are mean (standard deviation).
Table 5
Costs related to healthcare resources six months before and after inclusion in the programme, per patient.
| HEALTHCARE RESOURCES | 6-MONTHS PRE-INTERVENTION* | 6-MONTHS POST-INTERVENTION* | VARIATION* | ||||
|---|---|---|---|---|---|---|---|
| € | % ON TOTAL | € | % ON TOTAL | € | % ON TOTAL | ||
| Primary care | Physician | 411 | 5.67 | 573 | 14.72 | 162 | 39.42 |
| Nurse | 327 | 4.51 | 695 | 17.87 | 368 | 112.54 | |
| Social worker | 30 | 0.41 | 62 | 1.59 | 32 | 106.67 | |
| Continuous/urgent care | 75 | 1.03 | 76 | 1.94 | 1 | 1.33 | |
| Primary care total costs | 843€ | 11.63 | 1,406€ | 36.16 | 563€ | 66.79 | |
| Hospital care | Emergency department | 299 | 4.12 | 187 | 4.81 | –112 | –37.46 |
| Hospital stay | 6,107 | 84.26 | 2,296 | 59.06 | –3,811 | –62.40 | |
| Hospital care total costs | 6,406 | 88.37 | 2,483 | 63.86 | –3,923 | –61.24 | |
| Total costs per patient | 7,249 | 3,889 | –3,360 | –46.37 | |||
[i] * Variables are mean and %.
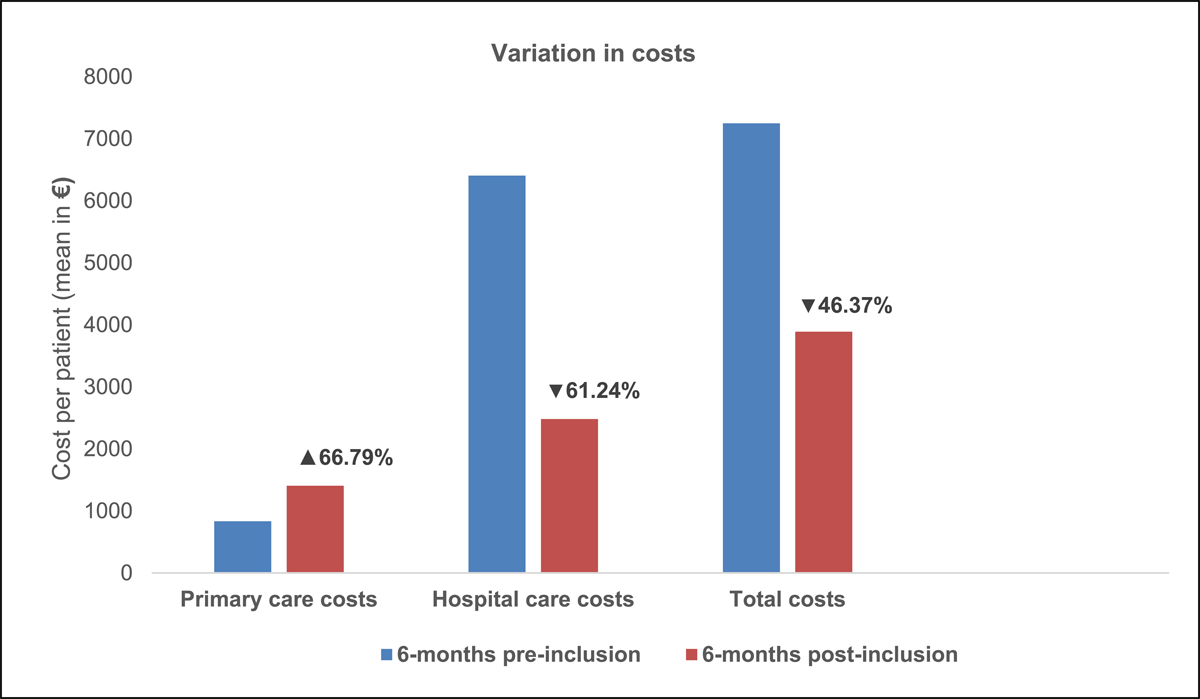
Figure 1
Variation in healthcare resources costs six months before and after inclusion in the programme, per patient.