
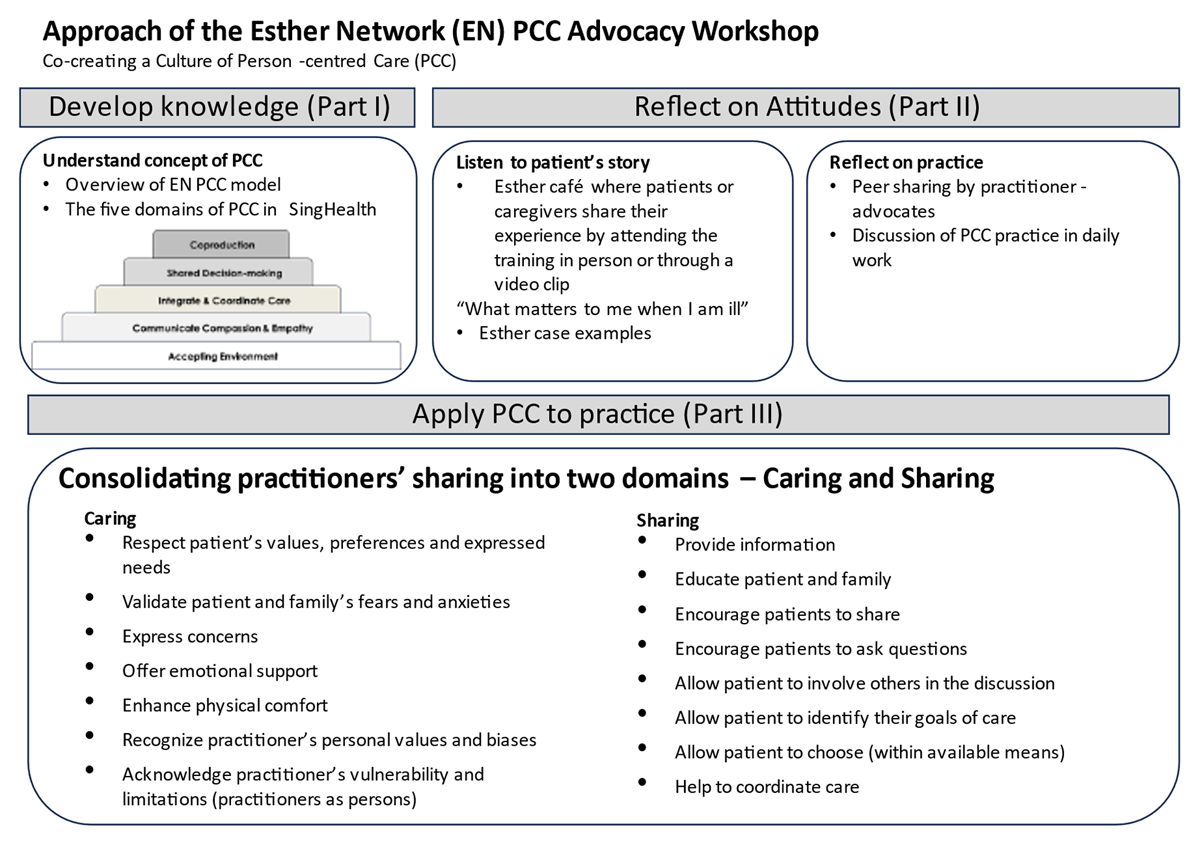
Figure 1
The Esther Network PCC Advocacy Training.
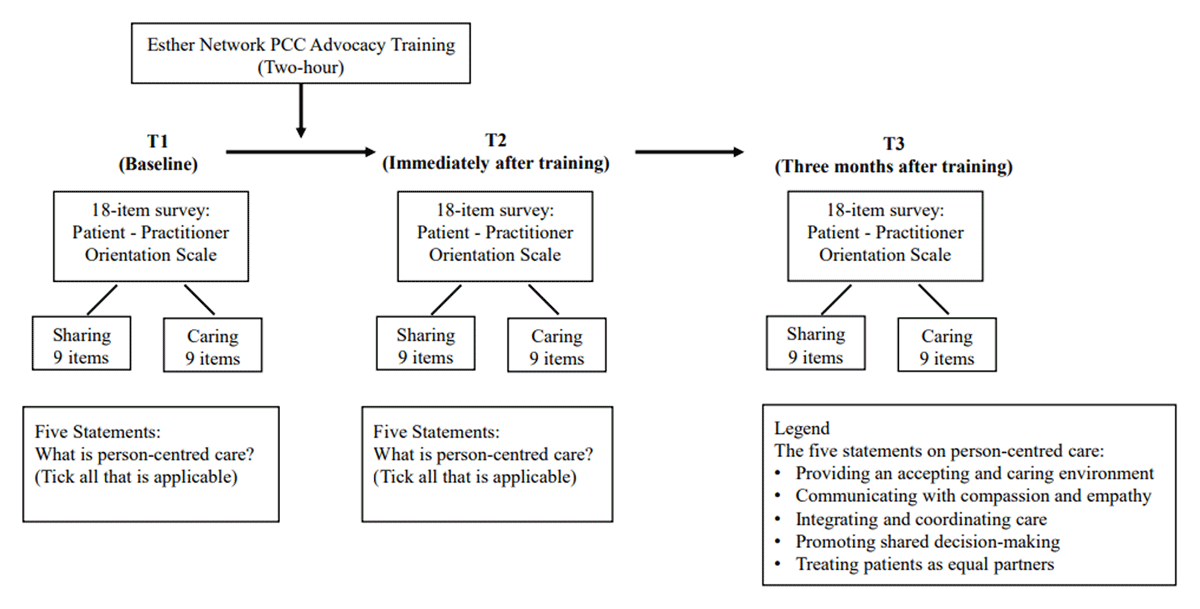
Figure 2
Research design.
#PCC, person-centred care.
Table 1
Characteristics of participants (N = 437) and baseline PPOS scores.
| MEAN (SD) SCORES | ||||
|---|---|---|---|---|
| CHARACTERISTICS | n (%) | OVERALL PPOS | SHARING SUB-SCALE | CARING SUB-SCALE |
| All participants | 437 (100%) | 4.28 | 4.13 | 4.43 |
| Age (mean, SD) | = 36.3 (9.60) | |||
| <30 | 112 (25.6%) | 4.20 (.47) | 4.01 (.57) | 4.39 (.53) |
| 30–39 | 217 (49.7%) | 4.30 (.52) | 4.16 (.64) | 4.45 (.54) |
| 40–49 | 57 (13.0%) | 4.40 (.59) | 4.27 (.79) | 4.53 (.56) |
| >=50 | 51 (11.7%) | 4.24 (.47) | 4.13 (.54) | 4.35 (.57) |
| p = 0.09 | p = 0.06 | p = 0.31 | ||
| Sex | ||||
| Male | 97 (22.2%) | 4.17 (.5) | 3.94 (.6) | 4.41 (.58) |
| Female | 340 (77.8%) | 4.31 (.52) | 4.19 (.64) | 4.44 (.54) |
| p = 0.02* | p < 0.001* | p = 0.59 | ||
| Ethnicity | ||||
| Chinese | 324 (74.1%) | 4.27 (.49) | 4.10 (.62) | 4.45 (.52) |
| Malay | 47 (10.8%) | 4.22 (.59) | 4.13 (.71) | 4.32 (.60) |
| Indian | 48 (11.0%) | 4.40 (.60) | 4.33 (.69) | 4.44 (.64) |
| Others | 18 (4.1%) | 4.32 (.49) | 4.27 (.62) | 4.38 (.50) |
| p = 0.43 | p = 0.10 | p = 0.46 | ||
| Profession | ||||
| Doctor | 76 (17.4%) | 4.33 (.44) | 4.13 (.54) | 4.54 (.48) |
| Nurse | 148 (33.9%) | 4.27 (.52) | 4.19 (.64) | 4.34 (.54) |
| Allied Health | 213 (48.7%) | 4.28 (.54) | 4.09 (.67) | 4.46 (.56) |
| p = .64 | p = .34 | p = 0.02* | ||
| Work experience (mean, SD) | = 11.84 (9.58) | |||
| <5 | 97 (22.2%) | 4.22 (.50) | 4.01 (.59) | 4.43 (.52) |
| 5–10 | 148 (33.9%) | 4.24 (.49) | 4.08 (.61) | 4.39 (.54) |
| 11–20 | 138 (31.6%) | 4.41 (.56) | 4.32 (.70) | 4.51 (.54) |
| 21–30 | 32 (7.3%) | 4.23 (.48) | 4.07 (.60) | 4.38 (.58) |
| >30 | 22 (5.0%) | 4.12 (.42) | 3.95 (.45) | 4.28 (.64) |
| p = 0.007* | p = 0.001* | p = 0.24 | ||
| PPOS category | ||||
| High (PPOS Score ≥ 4.50) | = 151 (34.6%) | |||
| Medium (PPOS Score >4.06 to <4.50) | = 136 (31.1%) | |||
| Low (PPOS Score ≤ 4.06) | = 150 (34.3%) | |||
| PCC endorsement | ||||
| All five PCC statements | = 329 (75.3%) | |||
[i] #PPOS, Patient-Practitioner Orientation Scale.
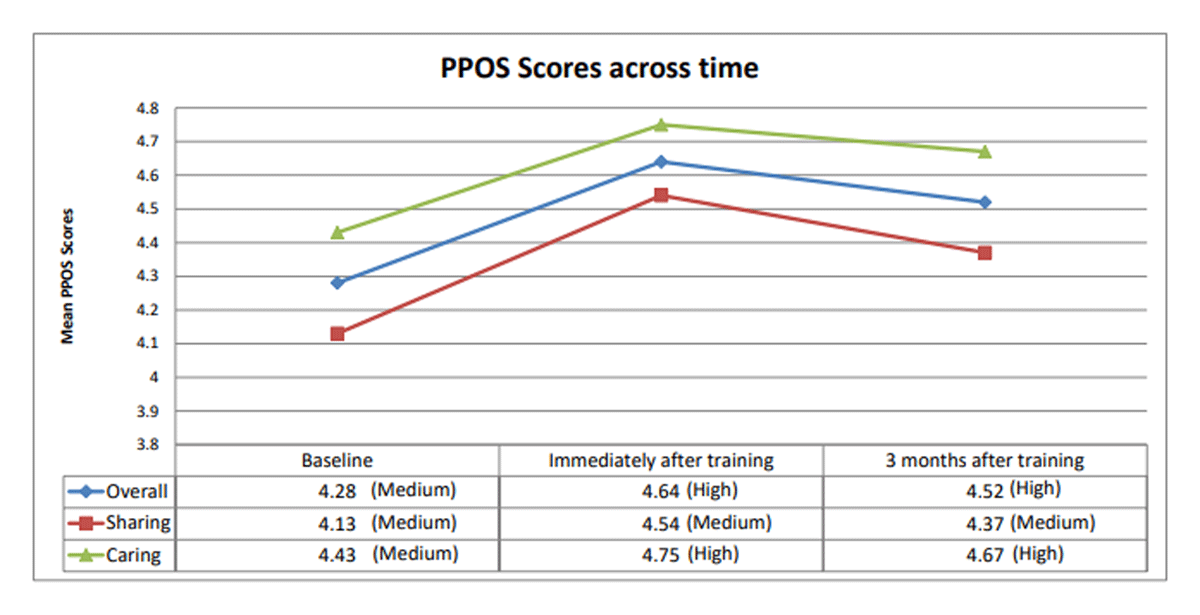
Figure 3
Relationship over time between PPOS scores (Overall, Sharing and Caring) and the advocacy training.
#PPOS=Patient-Practitioner Orientation Scale.
Table 2
Main and interaction effects on PPOS outcomes (Overall, Sharing and Caring).
| OVERALL PPOS | 95% CONFIDENCE INTERVAL | Sharing PPOS | 95% CONFIDENCE INTERVAL | Caring PPOS | 95% CONFIDENCE INTERVAL | |||||||
|---|---|---|---|---|---|---|---|---|---|---|---|---|
| OR | LOWER LIMIT | UPPER LIMIT | P-VALUE | OR | Lower limit | Upper limit | P-VALUE | OR | LOWER LIMIT | UPPER LIMIT | P-VALUE | |
| Sex | ||||||||||||
| Male | 1.00 (ref) | 1.00 (ref) | 1.00 (ref) | |||||||||
| Female | 1.79 | 1.16 | 2.76 | 0.008* | 2.13 | 1.34 | 3.38 | 0.001* | 1.32 | 0.84 | 2.07 | 0.236 |
| Profession | ||||||||||||
| Doctor | 1.00 (ref) | 1.00 (ref) | 1.00 (ref) | |||||||||
| Nurse | 0.68 | 0.39 | 1.19 | 0.177 | 1.00 | 0.58 | 1.75 | 0.990 | 0.48 | 0.28 | 0.85 | 0.012* |
| Allied Health | 0.85 | 0.52 | 1.41 | 0.534 | 1.10 | 0.66 | 1.84 | 0.715 | 0.77 | 0.46 | 1.29 | 0.323 |
| Time | ||||||||||||
| T1 | 1.00 (ref) | 1.00 (ref) | 1.00 (ref) | |||||||||
| T2 | 4.34 | 2.15 | 8.73 | <0.001* | 3.53 | 1.87 | 6.66 | <0.001* | 3.17 | 1.36 | 7.36 | 0.007* |
| T3 | 1.90 | 0.87 | 4.15 | 0.110 | 3.15 | 1.40 | 7.08 | 0.005* | 2.72 | 0.89 | 8.28 | 0.078 |
| Time*sex | ||||||||||||
| T2*Male | 1.00 (ref) | 1.00 (ref) | 1.00 (ref) | |||||||||
| T2*Female | 0.92 | 0.56 | 1.52 | 0.748 | 0.84 | 0.54 | 1.30 | 0.434 | 0.78 | 0.43 | 1.44 | 0.432 |
| T3*Male | 1.00 (ref) | 1.00 (ref) | 1.00 (ref) | |||||||||
| T3*Female | 0.43 | 0.26 | 0.72 | 0.001* | 0.54 | 0.31 | 0.93 | 0.026* | 0.44 | 0.25 | 0.79 | 0.005* |
| Time*profession | ||||||||||||
| T2*Doctor | 1.00 (ref) | 1.00 (ref) | 1.00 (ref) | |||||||||
| T2*Nurse | 0.74 | 0.38 | 1.44 | 0.373 | 1.17 | 0.63 | 2.16 | 0.627 | 0.78 | 0.35 | 1.73 | 0.537 |
| T2*Allied Health | 0.88 | 0.46 | 1.68 | 0.706 | 1.31 | 0.74 | 2.33 | 0.358 | 0.92 | 0.41 | 2.05 | 0.837 |
| T3*Doctor | 1.00 (ref) | 1.00 (ref) | 1.00 (ref) | |||||||||
| T3*Nurse | 1.72 | 0.91 | 3.24 | 0.093 | 1.22 | 0.60 | 2.49 | 0.576 | 0.87 | 0.36 | 2.12 | 0.762 |
| T3*Allied Health | 2.41 | 1.29 | 4.47 | 0.006* | 1.30 | 0.67 | 2.53 | 0.432 | 1.04 | 0.41 | 2.62 | 0.933 |
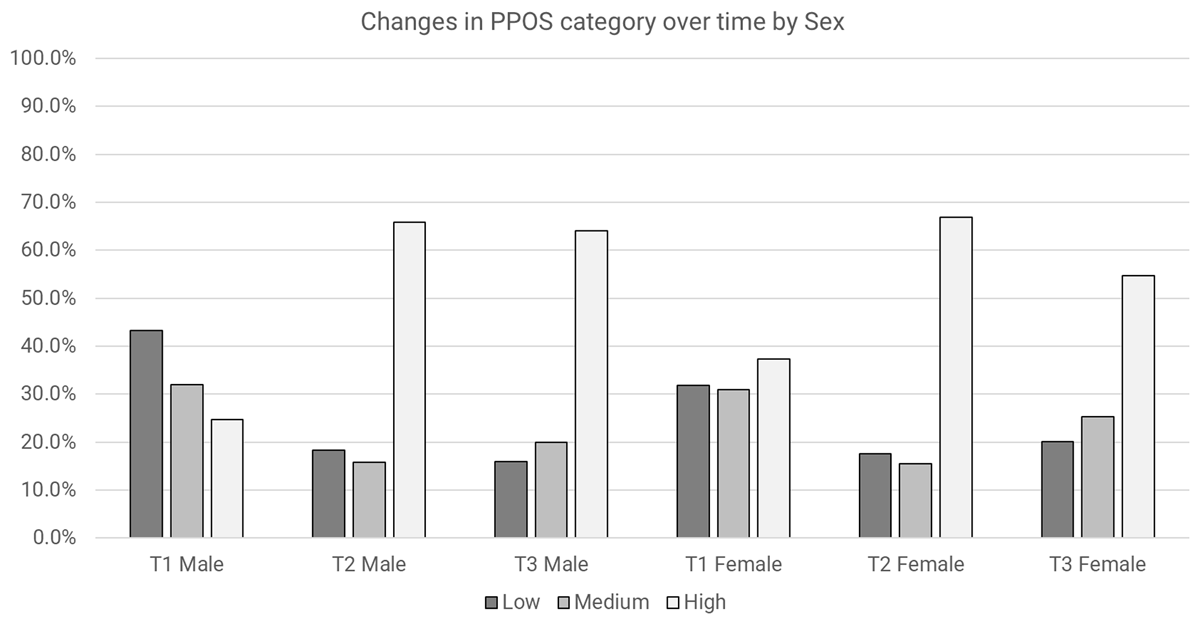
Figure 4
Changes in overall PPOS category over time by sex.
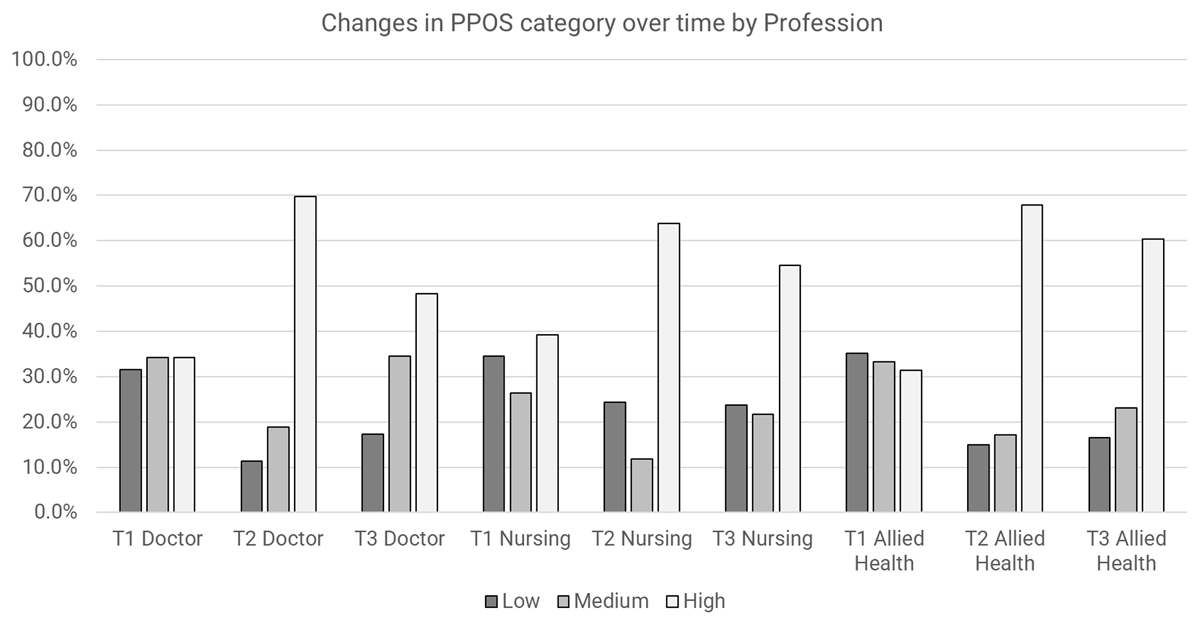
Figure 5
Changes in overall PPOS category over time by profession.
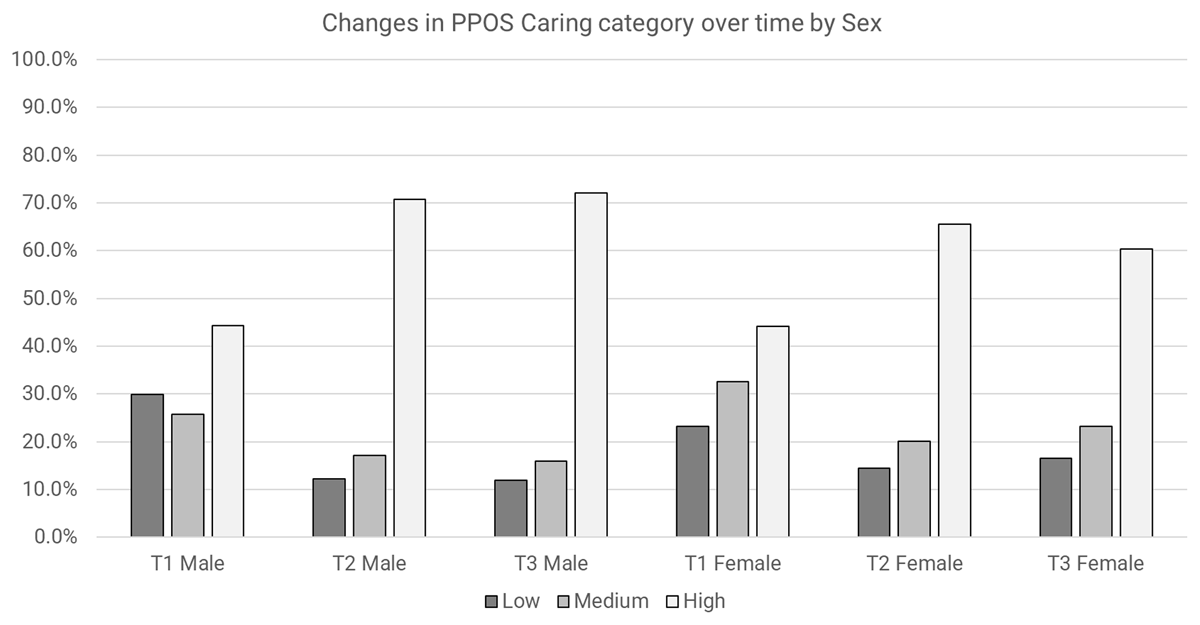
Figure 6
Changes in PPOS caring category over time by sex.