
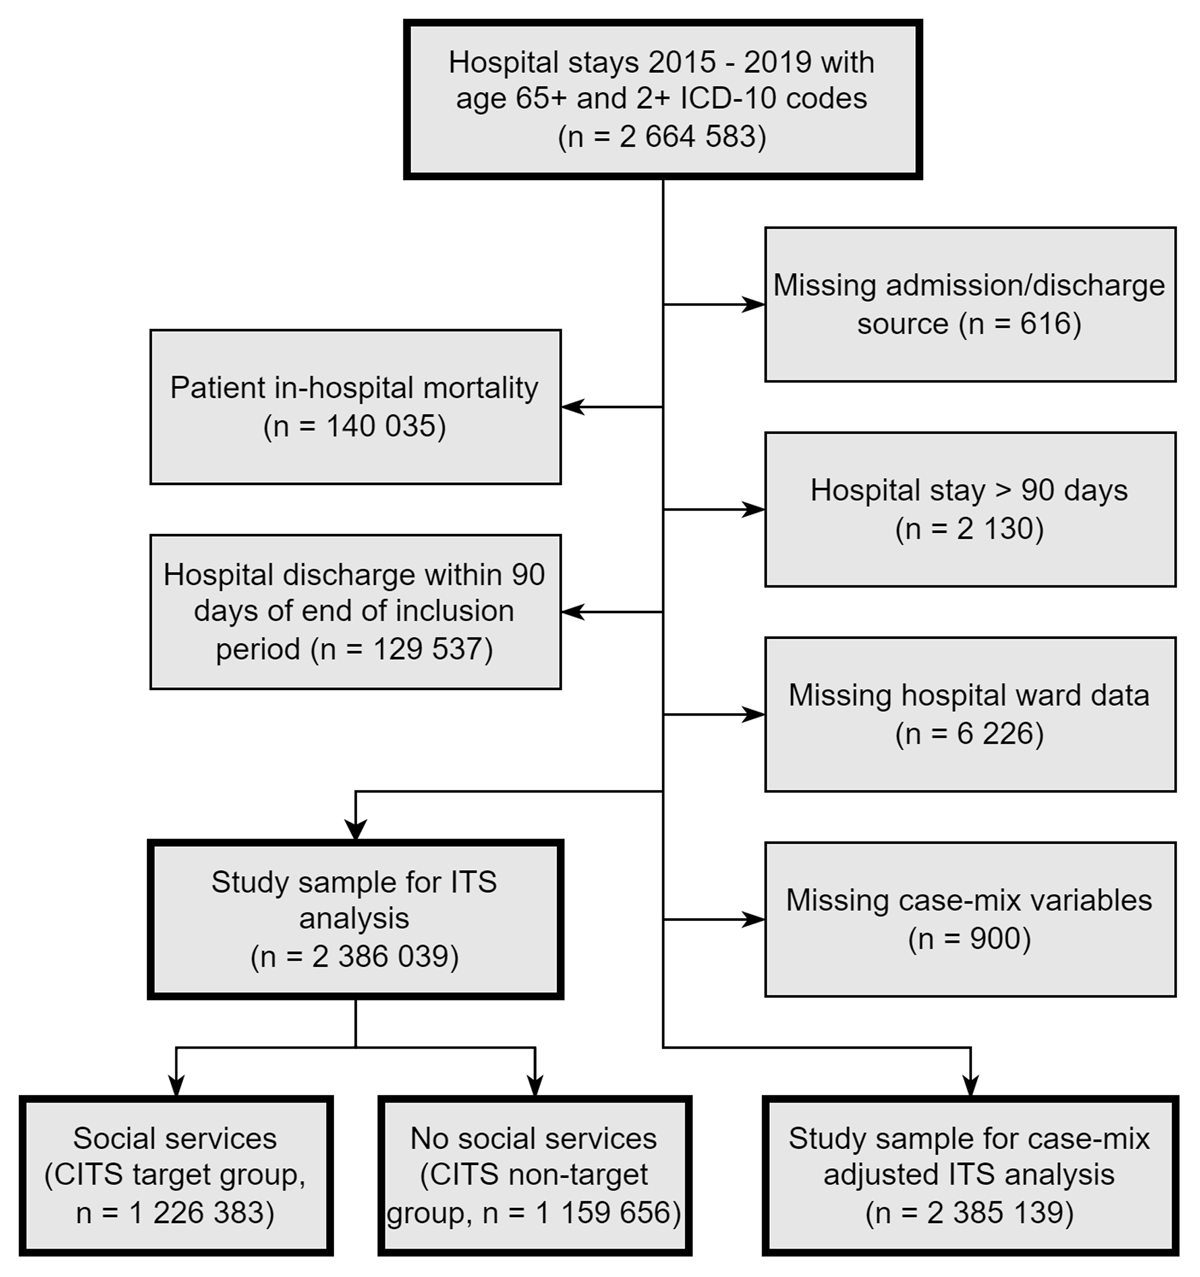
Figure 1
Inclusion/exclusion criteria flow chart.
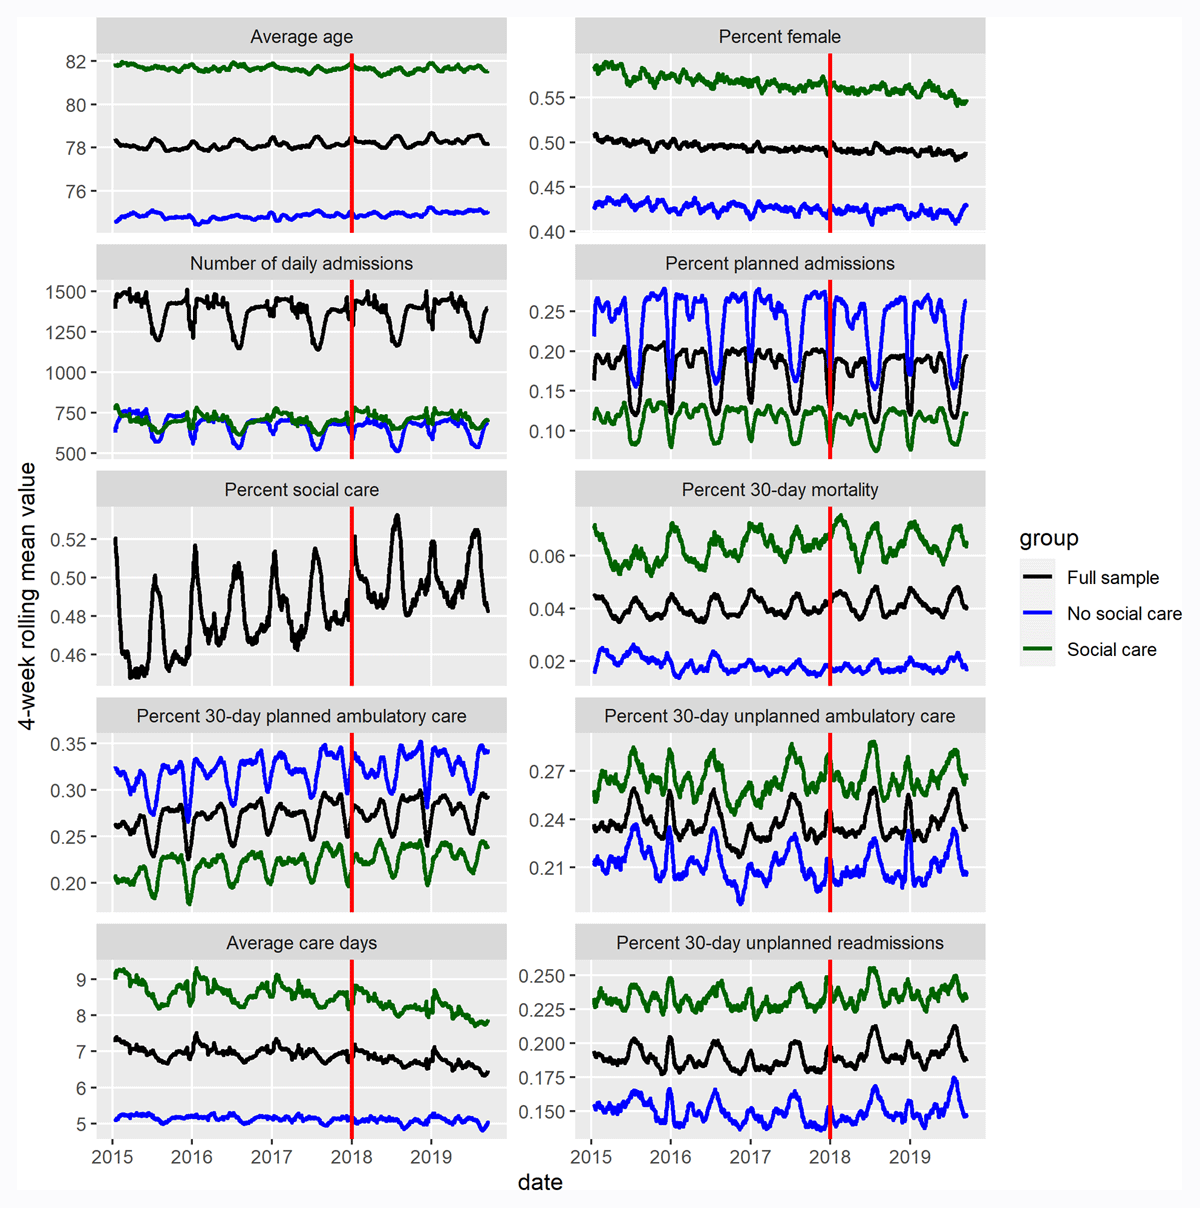
Figure 2
Descriptive statistics for the study sample used in the ITS-analysis and CITS-analysis (social care target group and no social care non-target group). All data presented using 28-day (4 week) rolling average values. Red vertical line denotes the time of intervention.
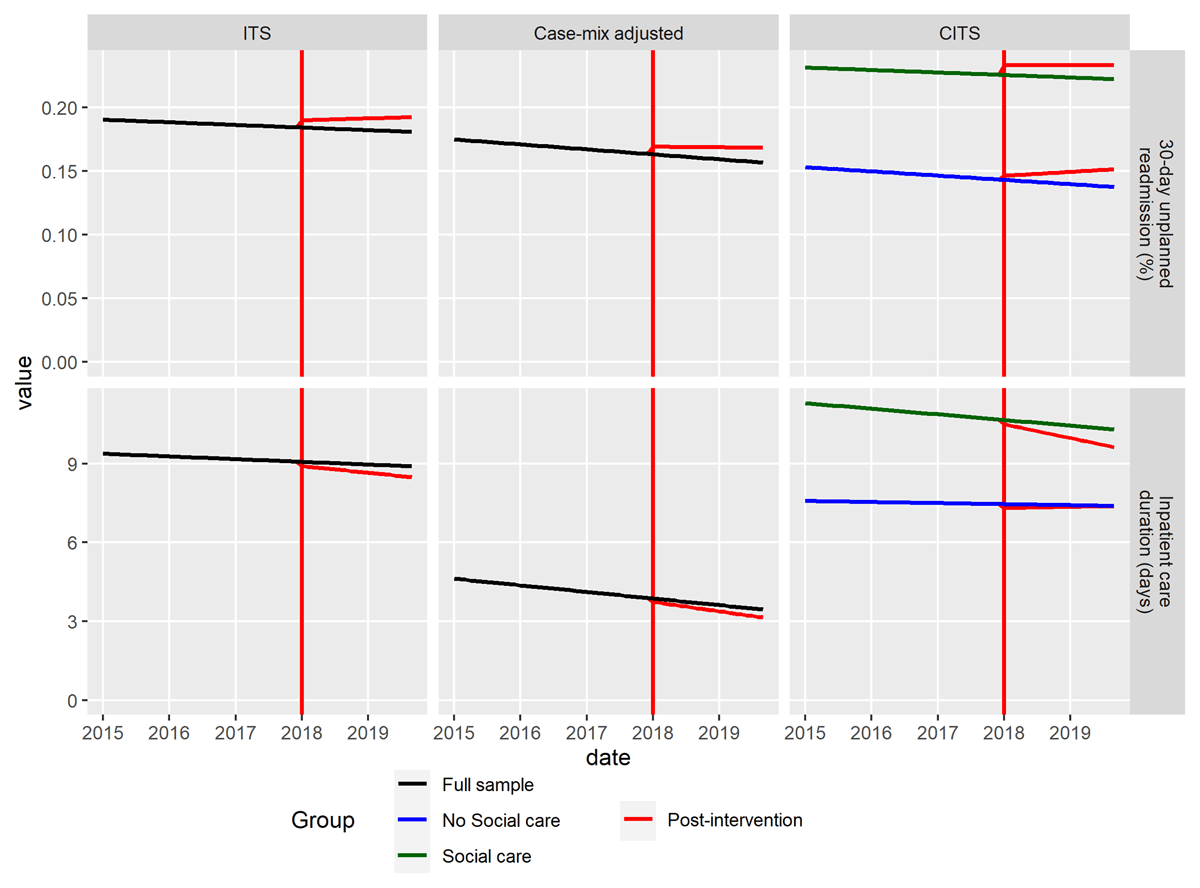
Figure 3
Results of the ITS-analysis (left), case-mix adjusted ITS-analysis (middle) and CITS-analysis (right) for 30 day unplanned readmission (top) and inpatient length of stay (bottom). Note that intercepts differ from the averages presented in figure 1 due to the use of varying random intercepts in all models, and to the estimation of effects at the mode value of covariates in the case-mix adjusted models.
Table 1
ITS analysis fixed effect coefficients in full study sample.
| COEFFICIENT | 30-DAY UNPLANNED READMISSION (PERCENT, 95% CI) | INPATIENT LENGTH OF STAY (DAYS, 95% CI) |
|---|---|---|
| Intercept | 19.047 (18.642 – 19.382) | 9.381 (9.254 – 9.535) |
| Change per month since start | –0.017 (–0.03 – –0.004) | –0.009 (–0.013 – –0.005) |
| Post-intervention level change | 0.571 (0.108 – 1.039) | –0.156 (–0.259 – –0.055) |
| Post-intervention change per month | 0.029 (–0.004 – 0.06) | –0.013 (–0.019 – –0.006) |
[i] Effects with 95% confidence intervals excluding zero are written in bold text. Coefficients represent average effects of the reform in the full study sample.
Table 2
Case-mix adjusted ITS analysis fixed effect coefficients.
| COEFFICIENT | 30-DAY UNPLANNED READMISSION (PERCENT, 95% CI) | INPATIENT LENGTH OF STAY (DAYS, 95% CI) | |
|---|---|---|---|
| Intercept | 20.879 (19.23 – 22.543) | 5.445 (5.163 – 5.739) | |
| Study effects | Change per month since start | –0.033 (–0.046 – –0.019) | –0.021 (–0.026 – –0.016) |
| Post-intervention level change | 0.593 (0.143 – 1.043) | –0.129 (–0.246 – –0.012) | |
| Post-intervention change per month | 0.028 (–0.006 – 0.058) | –0.009 (–0.017 – –0.002) | |
| Covariates | Age | –0.094 (–0.114 – –0.073) | –0.036 (–0.039 – –0.032) |
| Female | –2.018 (–2.26 – –1.789) | 0.094 (0.061 – 0.127) | |
| Civil status: Married (ref) | |||
| Civil status: Divorced | 0.181 (–0.13 – 0.486) | –0.054 (–0.094 – –0.012) | |
| Civil status: Unmarried | –0.059 (–0.457 – 0.302) | 0.145 (0.08 – 0.21) | |
| Civil status: Widow | –1.198 (–1.467 – –0.918) | –0.11 (–0.149 – –0.07) | |
| Planned admission | –5.281 (–5.581 – –4.923) | –1.617 (–1.721 – –1.501) | |
| Number of diagnoses | 1.152 (1.101 – 1.207) | 0.591 (0.572 – 0.611) | |
| Number of Interventions | –0.229 (–0.288 – –0.168) | 1.344 (1.313 – 1.374) | |
| Ambulatory Care Sensitive Condition | 0.629 (0.203 – 1.056) | –0.186 (–0.254 – –0.124) | |
| Social services: None (ref) | |||
| Social services: In-home care | 8.759 (8.436 – 9.091) | 2.207 (2.113 – 2.299) | |
| Social services: Nursing home | 3.218 (2.702 – 3.76) | 4.954 (4.733 – 5.191) |
[i] Effects with 95% confidence intervals excluding zero are written in bold text. Study effect coefficients represent average effects of the reform in the full study sample.
Table 3
CITS analysis fixed effect coefficients.
| COEFFICIENT | 30-DAY UNPLANNED READMISSION (PERCENT, 95% CI) | INPATIENT LENGTH OF STAY (DAYS, 95% CI) | |
|---|---|---|---|
| Main effects in non-target (no social care) group | Intercept | 15.319 (14.896 – 15.743) | 7.578 (7.459 – 7.726) |
| Change per month since start | –0.028 (–0.044 – –0.011) | –0.003 (–0.007 – 0) | |
| Post-intervention level change | 0.322 (–0.248 – 0.884) | –0.145 (–0.239 – –0.03) | |
| Post-intervention change per month | 0.053 (0.013 – 0.089) | 0.007 (–0.001 – 0.012) | |
| Coefficient interaction effect in target (social care) group | Intercept | 7.828 (7.27 – 8.294) | 3.731 (3.489 – 3.913) |
| Change per month since start | 0.011 (–0.015 – 0.037) | –0.014 (–0.02 – –0.006) | |
| Post-intervention level change | 0.447 (–0.502 – 1.397) | –0.018 (–0.26 – 0.155) | |
| Post-intervention change per month | –0.036 (–0.094 – 0.017) | –0.033 (–0.044 – –0.019) |
[i] Effects with 95% confidence intervals excluding zero are written in bold text. Main effect coefficients represent average effects in the non-target population, and coefficient interactions may in this case be interpreted as the difference between non-target and target populations – The interaction effect point estimate added to the main effect point estimate equals the effect size in the target group.