

Figure 1
Recruitment flowchart (intervention group).
Table 1
Participant baseline characteristics; intervention and control groups.
| INTERVENTION n = 1,549 (%) | ACTIVE CONTROL n = 868 (%) | p-VALUE/PASSIVE CONTROL (n = 2,174) | |
|---|---|---|---|
| Age category (in 2015): | p = 0.259* | ||
| up to 54 years | 225 (15) | 136 (16) | 294 (14) |
| 55 to 74 years | 684 (44) | 430 (50) | 990 (46) |
| 75 years and above | 640 (41) | 302 (35) | 890 (41) |
| Gender: | p = 0.895* | ||
| female | 822 (53) | 414 (48) | 1,194 (55) |
| male | 727 (47) | 454 (52) | 980 (45) |
| Aboriginal and/or Torres Strait Islander (N = 2,181) | 16 (1) | 16 (2) | p = 0.043 |
| Employment status (N = 2,205): | p < 0.001 | ||
| retired | 1,043 (72) | 506 (66) | |
| permanently ill/unable to work | 153 (11) | 89 (12) | |
| employed (full/part-time/casual) | 126 (9) | 110 (14) | |
| unemployed | 90 (6) | 21 (3) | |
| home duties/carer | 22 (2) | 28 (4) | |
| student | 9 (1) | 8 (1) | |
| Participant lives with (N = 2,090): | p = 0.451 | ||
| spouse | 726 (53) | 392 (55) | |
| alone | 373 (27) | 191 (27) | |
| other family members | 279 (20) | 129 (18) | |
| Has a carer (N = 2,209) | 454 (31) | 207 (28) | p = 0.118 |
| Carer lives with the participant (N = 662) | 374 (81) | 167 (84) | p = 0.338 |
| Participant is also a carer (N = 2,190) | 123 (8) | 68 (9) | p = 0.451 |
| Smoking status (N = 2,226): | p < 0.001 | ||
| current smoker | 210 (14) | 73 (10) | |
| stopped | 569 (38) | 399 (54) | |
| never smoked | 702 (47) | 273 (37) | |
| Highest level of education (N = 2,147): | p < 0.001 | ||
| up to Grade 12 | 1,095 (78) | 444 (60) | |
| TAFE certificate, trade, or apprenticeship | 212 (15) | 222 (30) | |
| university/postgraduate | 99 (7) | 75 (10) | |
| Total annual household income before tax (N = 1,918): | p < 0.001 | ||
| $39,999 or less | 1,094 (84) | 456 (74) | |
| $40,000 to $59,999 | 164 (13) | 87 (14) | |
| $60,000 to $79,999 | 25 (2) | 29 (5) | |
| $80,000 or more | 22 (2) | 41 (7) | |
| Private health insurance (N = 2,197) | 293 (20) | 166 (22) | p = 0.303 |
| Private health insurance with hospital cover (N = 442) | 239 (85) | 140 (88) | p = 0.427 |
| Private health insurance with extras cover (N = 425) | 226 (82) | 112 (75) | p = 0.067 |
Table 2
Per person per year episodes/claims, inflation-adjusted per patient per year healthcare expenditure (AUD$) and per patient GCIC programme cost by study group.
| PER PERSON PER YEAR | TYPE OF HEALTHCARE | PRE–ENROLMENT | FULL PROGRAMME IMPLEMENTATION | |||||||
|---|---|---|---|---|---|---|---|---|---|---|
| INTERVENTION | CONTROL | INTERVENTION | CONTROL | |||||||
| AVERAGE | % | AVERAGE | % | AVERAGE | %a | %b | AVERAGE | % | ||
| Healthcare Utilisation | ||||||||||
| GCHHS Events | Emergency department attendances | 0.9 | – | 0.8 | – | 1.8 | – | – | 1.2 | – |
| Outpatient visits | 4.1 | – | 3.4 | – | 8.4 | – | – | 5.8 | – | |
| Inpatient admissions | 1.5 | – | 1.6 | – | 3.4 | – | – | 2.8 | – | |
| PPHc | 0.2 | – | 0.2 | – | 0.4 | – | – | 0.3 | – | |
| LOS (days) | Inpatients | 3.88 | – | 4.53 | – | 8.75 | – | – | 5.21 | – |
| PPHc | 0.46 | – | 0.6 | – | 1.64 | – | – | 0.91 | – | |
| MBS/PBS Claimsd (n) | MBS | 53.2 | – | 50.4 | – | 82.3 | – | – | 77.6 | – |
| PBS | 57.7 | – | 53.6 | – | 79.7 | – | – | 93.6 | – | |
| Healthcare Expenditure (AUD$, Sept 2018) | ||||||||||
| GCHHS | Emergency | 740 | 5.0 | 690 | 4.6 | 1,680 | 5.8 | 4.5 | 1,120 | 5.0 |
| Outpatients | 1,830 | 12.3 | 1,460 | 9.8 | 3,170 | 11.0 | 8.5 | 2,150 | 9.6 | |
| Inpatients | 7,300 | 49.0 | 8,040 | 54.1 | 16,430 | 57.2 | 43.9 | 10,470 | 46.9 | |
| PPHe | 910 | – | 1,120 | – | 3,130 | – | – | 1,710 | – | |
| Sub–total GCHHS expenditure | 9,870 | 66.2 | 10,190 | 68.6 | 21,280 | 74.1 | 56.9 | 13,740 | 61.6 | |
| MBS/PBS Benefits paid | MBS | 2,920 | 19.6 | 2,750 | 18.5 | 4,110 | 14.3 | 11.0 | 3,960 | 17.7 |
| PBS | 2,110 | 14.2 | 1,920 | 12.9 | 3,330 | 11.6 | 8.9 | 4,620 | 20.7 | |
| Sub–total MBS/PBS benefits paid | 5,030 | 33.8 | 4,670 | 31.4 | 7,440 | 25.9 | 19.9 | 8,580 | 38.4 | |
| All healthcare expenditure (AUD$) | 14,900 | 100.0 | 14,860 | 100.0 | 28,720 | 100.0 | 76.8 | 22,320 | 100.0 | |
| GCIC expenditure (AUD$) | – | – | – | – | 8700 | – | 23.2 | – | – | |
| Total healthcare expenditure (AUD$) | 14,900 | 100.0 | 14,860 | 100.0 | 37,420 | 100.0 | 100.0 | 22,320 | 100.0 | |
[i] PPH = potentially preventable hospitalisations; GCHHS = Gold Coast Hospital and Health Service; LOS = Length of stay; MBS = Medicare Benefits Schedule; PBS = Pharmaceutical Benefits Scheme; a Proportion of healthcare costs excluding GCIC program cost for the intervention group; b Proportion of healthcare costs including GCIC program cost for the intervention group; c Of all inpatient admissions; d Active control participants only; ePPH expenditure is excluded from sub-total GCHHS expenditure because it is a part of inpatients expenditure; all costs rounded to nearest ten dollars and standardised to the value on September 2018.
Table 3
GCIC direct programme expenditure.
| COST ITEM | AMOUNT (AUD$) | |
|---|---|---|
| Labour expenses | ||
| Managerial and Administration | 5,353,057 | |
| Nursing | 4,820,261 | |
| Medical | 4,289,264 | |
| Allied Health Practitioners | 3,146,068 | |
| Information and Technology, Project and Professional Staff | 3,416,986 | |
| Brokered Services | 935,801 | |
| Other Employee Related Expensesa | 355,475 | |
| Total Labour | 22,316,912 | |
| Non-labour expensesb | 3,947,704 | |
| Total Expenses | 26,264,617 |
[i] Allied Health Practitioners = occupational therapists, pharmacist, physiotherapist, psychologist, social workers; Nursing = nurse practitioner, nurse manager, nurse navigators, clinical nurse, registered nurses, enrolled nurse; Managerial and Administration = managing director, operations manager, divisional finance manager, legal officer, administration officers, service navigators; Information Technology, Project and Professional Staff = principal analysts, principal project officers, project manager, project assistant, research manager, research assistant, contractors (staff training and project development); Medical = medical directors (general physician and general practice), geriatrician, staff specialists, medical registrars; Brokered Services = includes costs associated with engagement of Allied Health Services Australia, Royal District Nursing Service (RDNS) Elan Medical Supplies, and interpreter services; Training and establishment costs written into the Standing Offer of Arrangement with RDNS; a Includes WorkCover premiums, labour related taxes, benefits, training and development; b Includes supplies, services, rent, utilities (electricity), building establishment costs.
Table 4
Results of difference-in-difference analysis (study group x period of programme) on per patient per year episode, length of stay, expenditure, MBS and PBS use.
| PER PERSON PER YEAR | TYPE OF HEALTHCARE | DIFFERENCE-IN-DIFFERENCE | p-VALUE |
|---|---|---|---|
| GCHHS Episodes | Emergency department attendances | 0.362a | <.001* |
| Outpatient visits | 0.181a | <.001* | |
| Inpatient admissions | 0.299a | <.001* | |
| PPH | 0.392a | <.001* | |
| LOS (days) | Inpatient admissions | 0.673b | <.001* |
| PPH | 0.840b | 0.023* | |
| Number of Claims | MBS | 0.005a | 0.548 |
| PBS | –0.235a | <.001* | |
| Expenditure (AUD$, Sept 2018) | Emergency department | 0.328b | 0.862 |
| Outpatient costs | 0.160b | 0.801 | |
| Inpatient admission costs | 0.547b | 0.539 | |
| PPH costs | 0.814b | 0.837 | |
| MBS | –0.024b | 0.981 | |
| PBS | –0.420b | 0.916 |
[i] n.b. A value of 0.01 was added to GCIC Participants with zero healthcare utilization/cost; Generalised linear model (GLM) with log link function applied; *Significance p < 0.05; a Poisson regression; b Log-normal regression; PPH = potentially preventable hospitalisations; LoS = length of stay; MBS = Medicare Benefits Schedule; PBS=Pharmaceutical Benefits Scheme.
Table 5
Programme effect on patient reported outcome measures, intervention, and active controls.
| PATIENT-REPORTED OUTCOME MEASURE | SURVEY TIME-POINT | STUDY GROUP | DIFFERENCE-IN-DIFFERENCE | p-VALUE | |
|---|---|---|---|---|---|
| INTERVENTION | CONTROL | ||||
| AQoL-4D | Baseline | 0.535 (0.300) | 0.515 (0.286) | –0.03 | 0.117 |
| Last follow-up | 0.502 (0.293) | 0.485 (0.285) | |||
| ICECAP-Oa | Baseline | 0.866 (0.161) | 0.821 (0.155) | –0.037 | 0.005* |
| Last follow-up | 0.822 (0.171) | 0.797 (0.175) | |||
| LSNS-6 | Baseline | 20.4 (6.74) | 18.3 (6.36) | –1.769 | <0.001* |
| Last follow-up | 18.8 (6.32) | 18.2 (6.20) | |||
| SAPS-7 | Baseline | 24.5 (3.80) | 21.2 (4.58) | –2.725 | <0.001* |
| Last follow-up | 21.9 (4.10) | 20.8 (4.35) | |||
| PACIC | Baseline | 2.88 (0.85) | 3.08 (1.08) | 0.326 | <0.001* |
| Last follow-up | 3.23 (1.08) | 3.10 (1.09) | |||
[i] a Participants aged 65+ In 2015; * Significance p < 0.05.
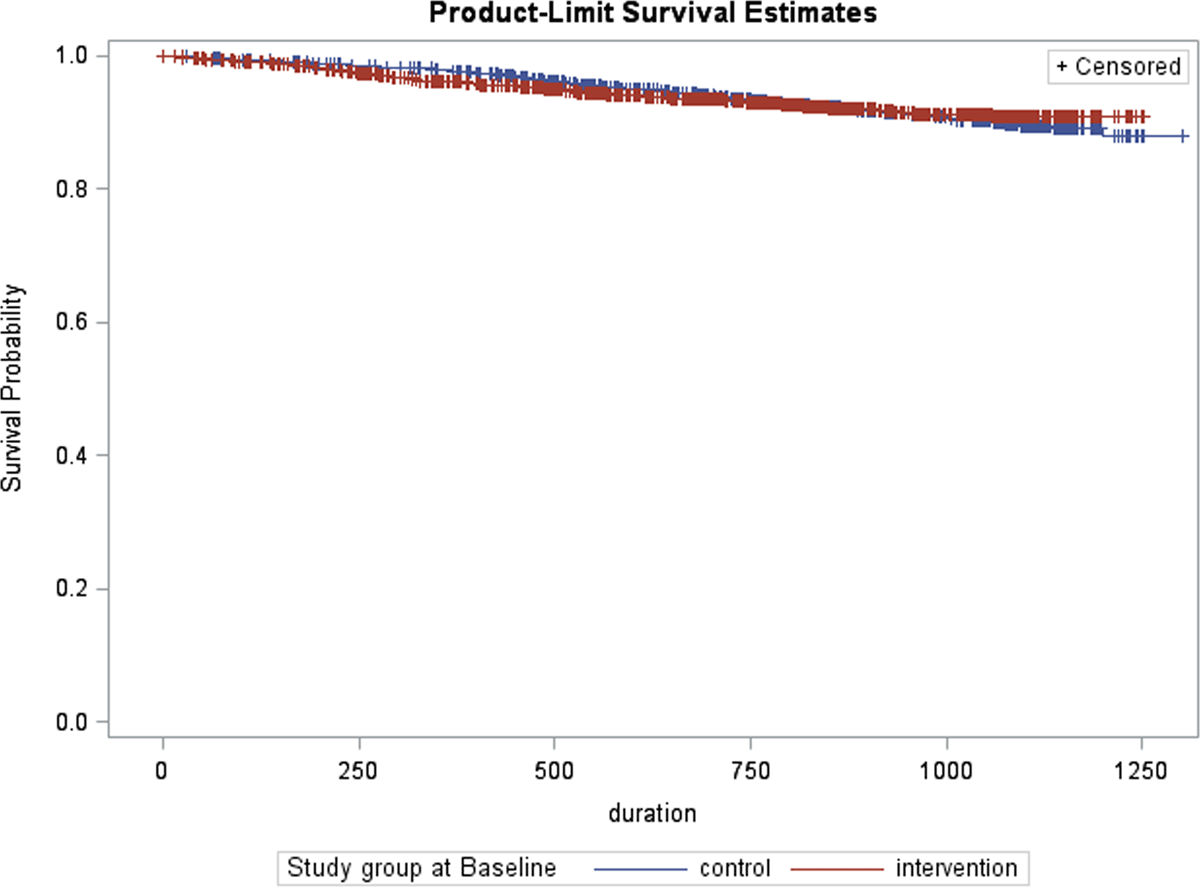
Figure 2
Kaplan-Meier survival function (non cancer-related deaths excluded).