
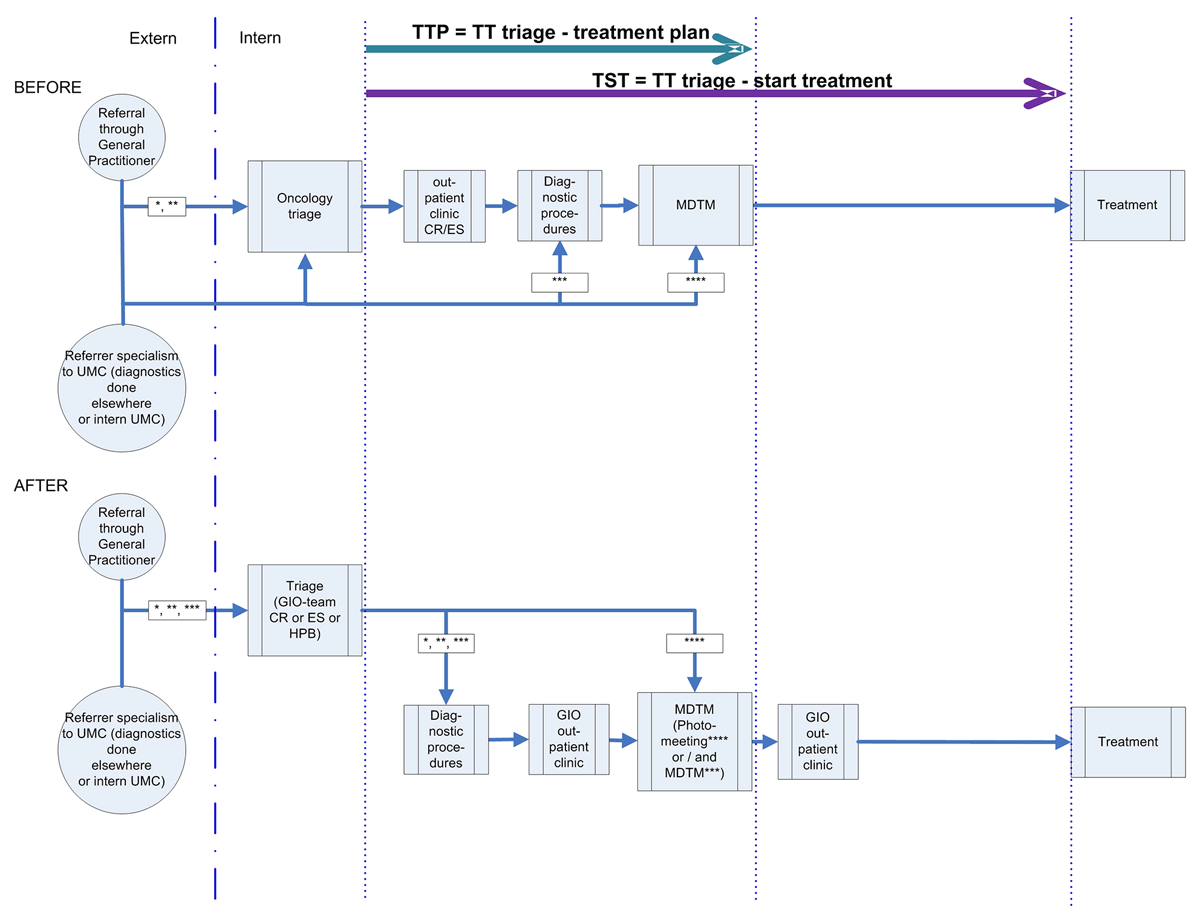
Figure 1
Before and after the reorganization with indicators.
Legend: The green and purple arrows indicate TTP and TST respectively. For an explanation see the methods section Process indicators and study design.
Abbreviations: GIO: Gastro-Intestinal Oncology, MDTM: Multidisciplinary team meeting; TTP: Time to Treatment Plan and TST: Time to Start Treatment, TT: Throughput Time, UMC: University Medical Centre.
In the schematic arrows: *: Colorectal (CR), **: Esophagus-Stomach (ES), ***: Hepatobiliary (HPB) tertiary, ****: Hepatobiliary quaternary.
Table 1
Throughput times, number of MDTMs and hospital visits before and after the reorganisation in the different pathways.
| COLORECTAL | HEPATOBILIARY | ESOPHAGUS-STOMACH | |||||||
|---|---|---|---|---|---|---|---|---|---|
| BEFORE | AFTER | BEFORE | AFTER | BEFORE | AFTER | ||||
| Number of patients diagnosed* | 2014 (n = 32) | 2015 (n = 34) | p | 2014 (n = 36) | 2015 (n = 32) | p | 2014 (n = 28) | 2015 (n = 32) | p |
| Median (IQR) | Median (IQR) | Median (IQR) | Median (IQR) | Median (IQR) | Median (IQR) | ||||
| Throughput time (days) | |||||||||
| TTP triage – treatment plan | 8.0 (4.3;26.8) | 13.0 (6.0;22.5) | .653 | 5.5 (1.0;12.0) | 9.0 (5.0;22.0) | .035 | 15.0 (7.0;23.0) | 13.0 (5.3;19.0) | .292 |
| treatment plan within 21 days** | 66% | 74% | .485 | 89% | 72% | .075 | 71% | 87% | .370 |
| TST triage – start treatment | 37.5 (24.3;55.8) | 34.0 (24.0;46.0) | .663 | 58.0 (46.5;68.5) | 47.0 (37.0;54.0) | .026 | 31.0 (22.5;41.5) | 28.0 (20.5;39.5) | .521 |
| start treatment within 63 days** | 85% | 93% | .420 | 60% | 88% | .024 | 96% | 100% | 1.000 |
| Number of MDTMs | 1.0 (1.0;2.0) | 1.0 (1.0;2.0) | .307 | 1.0 (1.0;1.0) | 1.0 (1.0;2.0) | .026 | 2.0 (1.0;2.0) | 1.0 (1.0;2.0) | .079 |
| Number of patients treated*** | 2014 (n = 26) | 2015 (n = 27) | 2014 (n = 25) | 2015 (n = 25) | 2014 (n = 25) | 2015 (n = 25) | |||
| Number of hospital visits | |||||||||
| triage – treatment plan | 2.0 (1.0;3.0) | 3.0 (2.0;4.0) | .092 | 1.0 (0.0;3.0) | 1.0 (1.0;3.0) | .027 | 4.0 (2.0;5.8) | 3.0 (2.0;4.0) | .037 |
| triage – start treatment | 3.5 (3.0;5.0) | 5.0 (3.0;6.0) | .157 | 3.0 (2.0;4.0) | 3.0 (2.0;4.0) | .933 | 5.5 (4.0;7.0) | 5.0 (3.0;6.0) | .238 |
[i] Legend:
Abbreviations: IQR: Inter Quartile Range (25th and 75th percentiles), MDTM: Multidisciplinary team meeting, TST: time to start treatment, TTP: time to treatment plan; *: number of patients consecutively discussed in the MDTM in the UMC of the care pathways. Differences between before and after the reorganisation were tested using Mann-Whitney-U, except the percentages **: ‘treatment plan within 21 days’ and ‘treatment within 63 days’ were tested using with Chi2 test, ***: number of patients discussed in the UMC MDTM that were treated in the UMC or in the region.
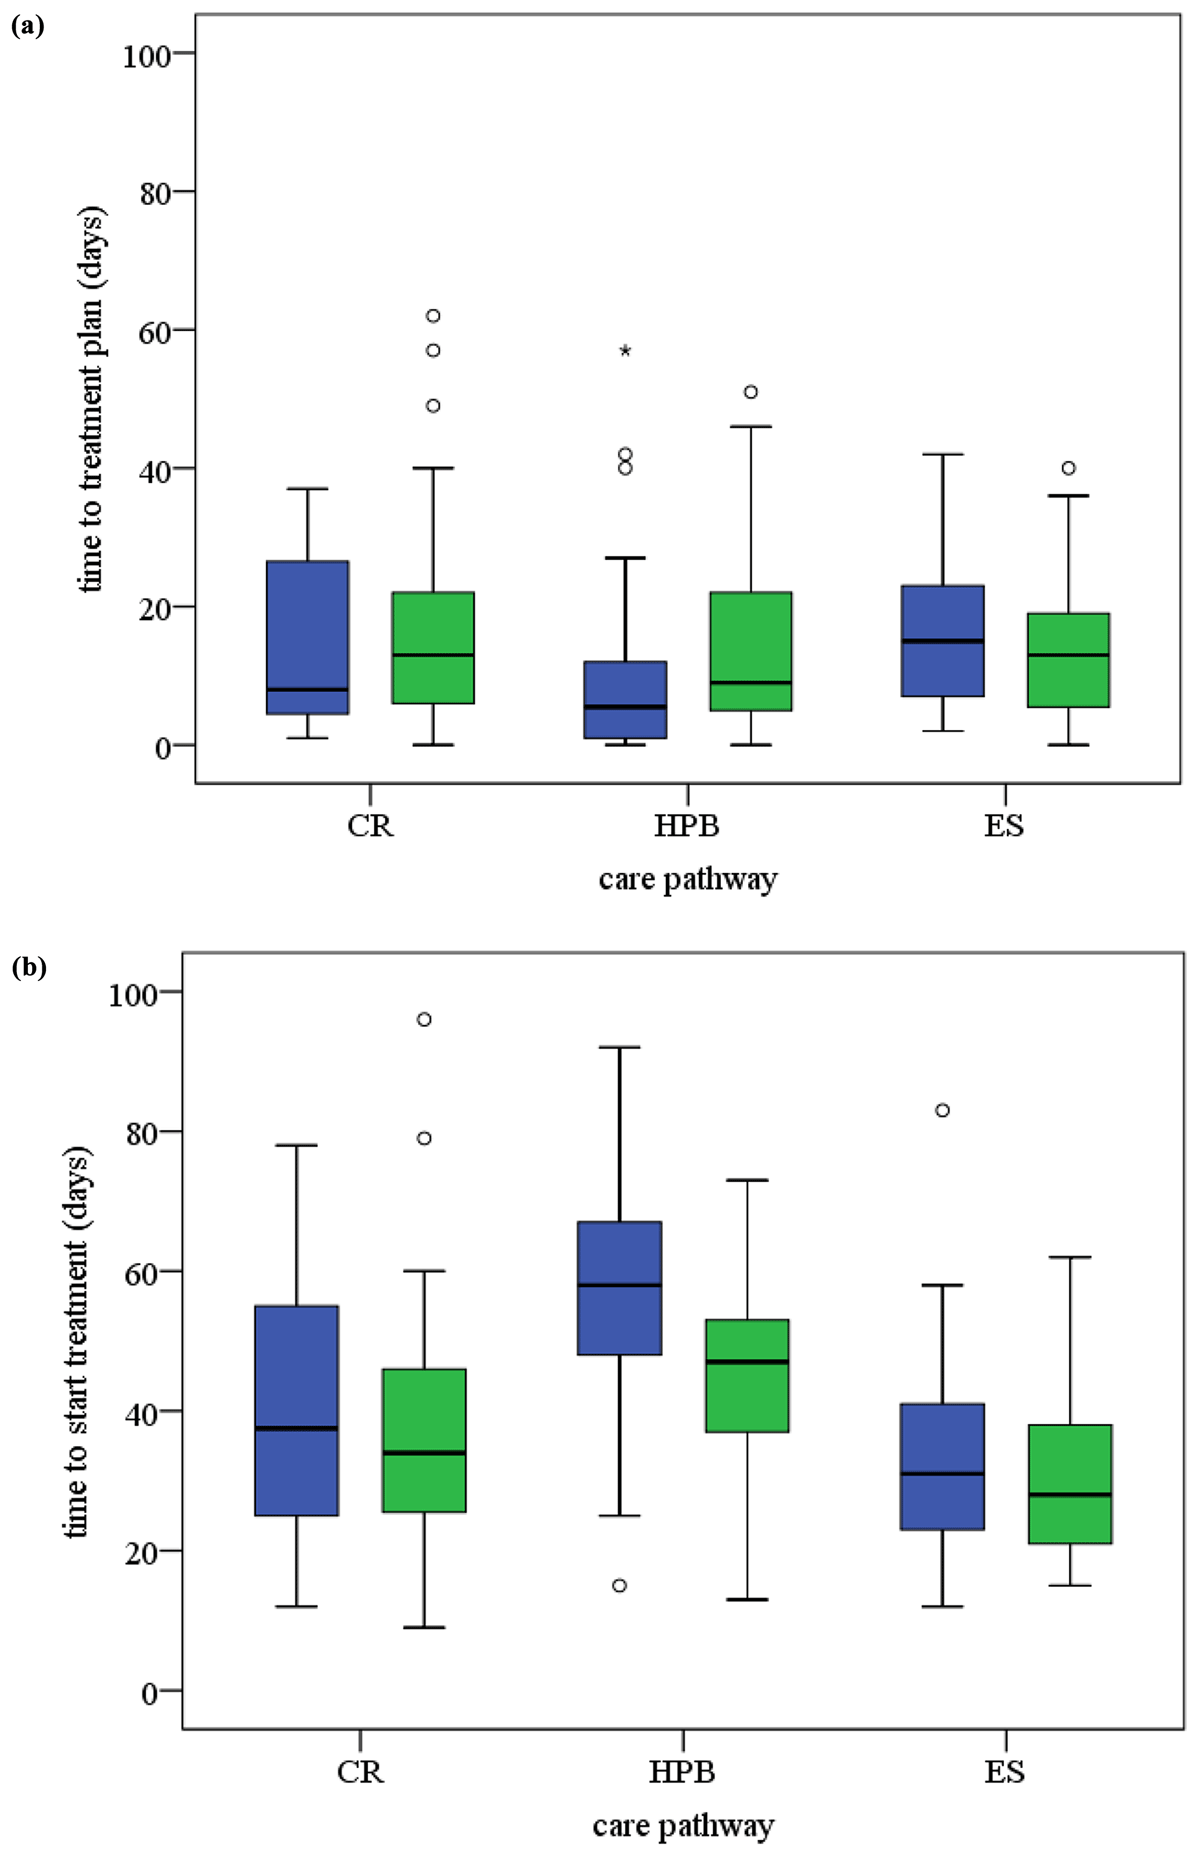
Figure 2
(a) Box and whisker plots time to treatment plan. (b) Box and whisker plots time to start treatment.
Legend: CR: colorectal, HPB: hepatobiliary, ES: esophagus-stomach; TST: time to start treatment; TTP: time to treatment plan.
Blue is before and green is after the MDTM reorganisation; O: outlier, *: outlier Tukey’s method IQR; IQR: Inter Quartile Range.
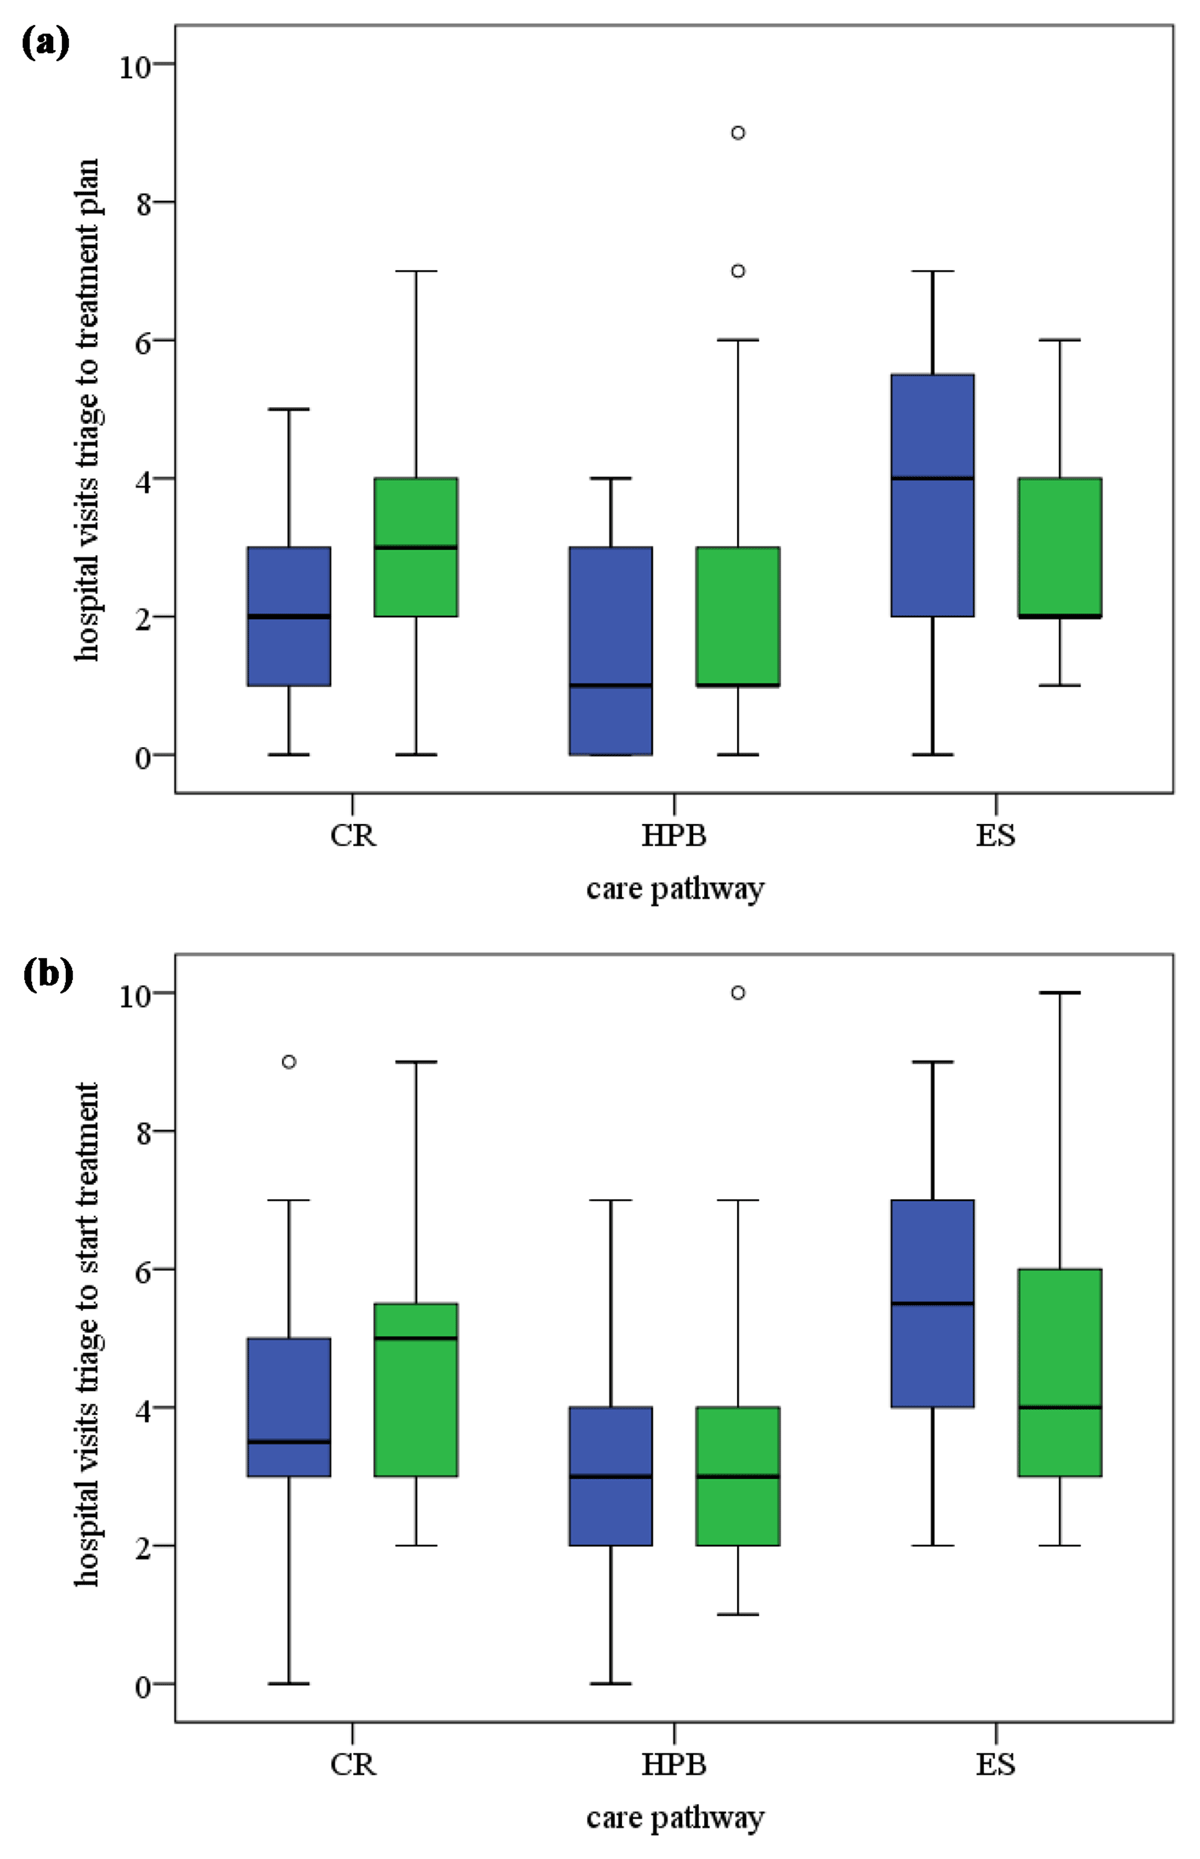
Figure 3
(a) Box and whisker plots number of hospital visits from triage to treatment plan. (b) Box and whisker plots number of hospital visits between triage and start treatment.
Legend: hospitals visits per patient (CR: colorectal, HPB: hepatobiliary, ES: esophagus-stomach).
Blue is before and green is after the MDTM reorganisation; O: outlier.